Copyright
©The Author(s) 2023.
World J Gastrointest Surg. May 27, 2023; 15(5): 812-824
Published online May 27, 2023. doi: 10.4240/wjgs.v15.i5.812
Published online May 27, 2023. doi: 10.4240/wjgs.v15.i5.812
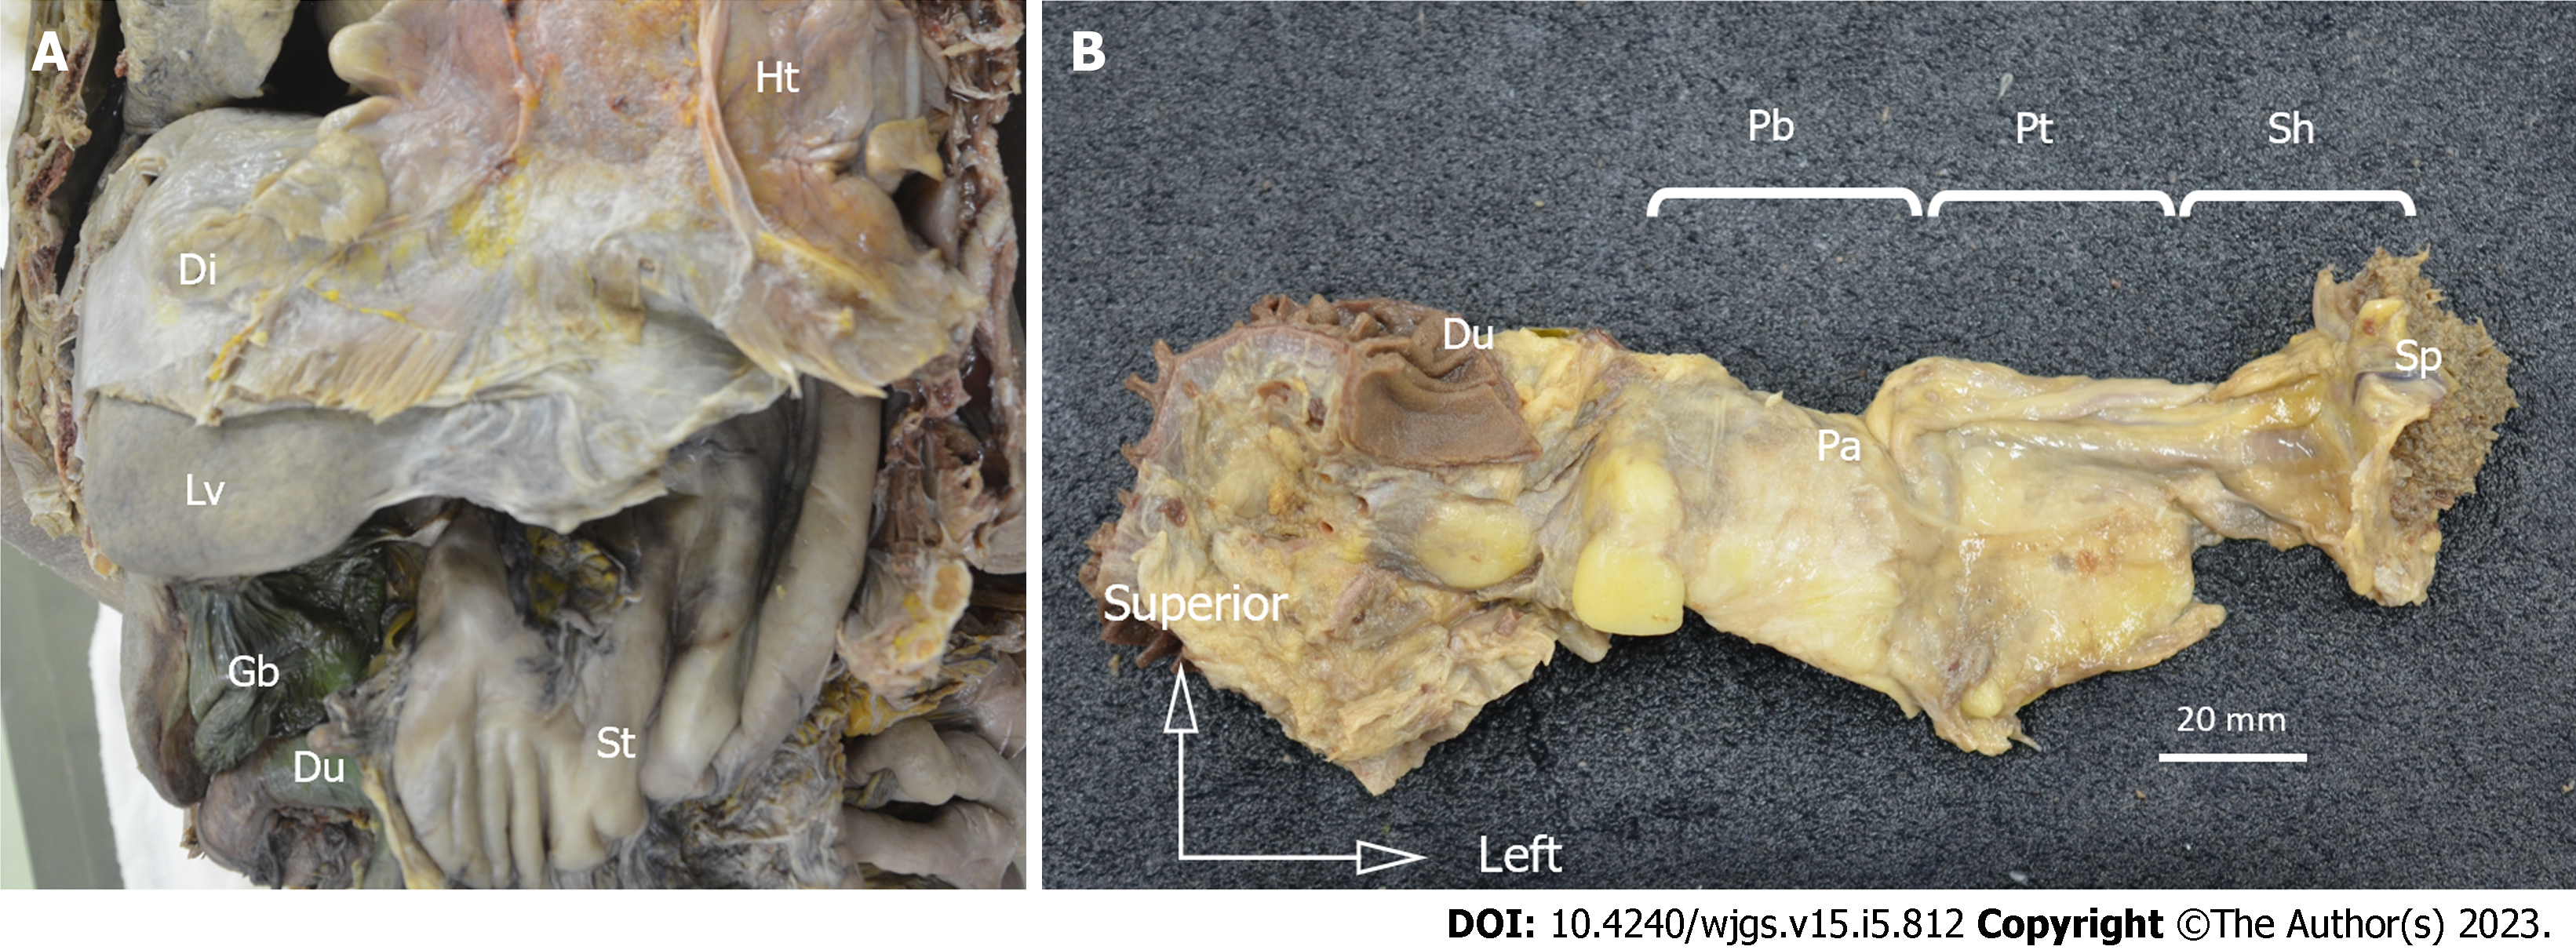
Figure 1 Resected specimens.
Resected specimens. A: Laparotomy was performed, and the esophagus, stomach, duodenum, spleen, pancreas, and vessels were resected in an en-bloc fashion; B: The duodenal bulb, horizontal leg, and lower bile duct were removed, and the duodenum, pancreas, spleen, and surrounding tissue were dissected from the retroperitoneum in an en-bloc fashion. Ht: Heart; Di: Diaphragm; Lv: Liver; St: Stomach; Du: Duodenum; Gb: Gallbladder; Pa: Pancreas; Pb: Pancreatic body; Pt: Pancreatic tail; Sh: Splenic hilum; Sp: Spleen.
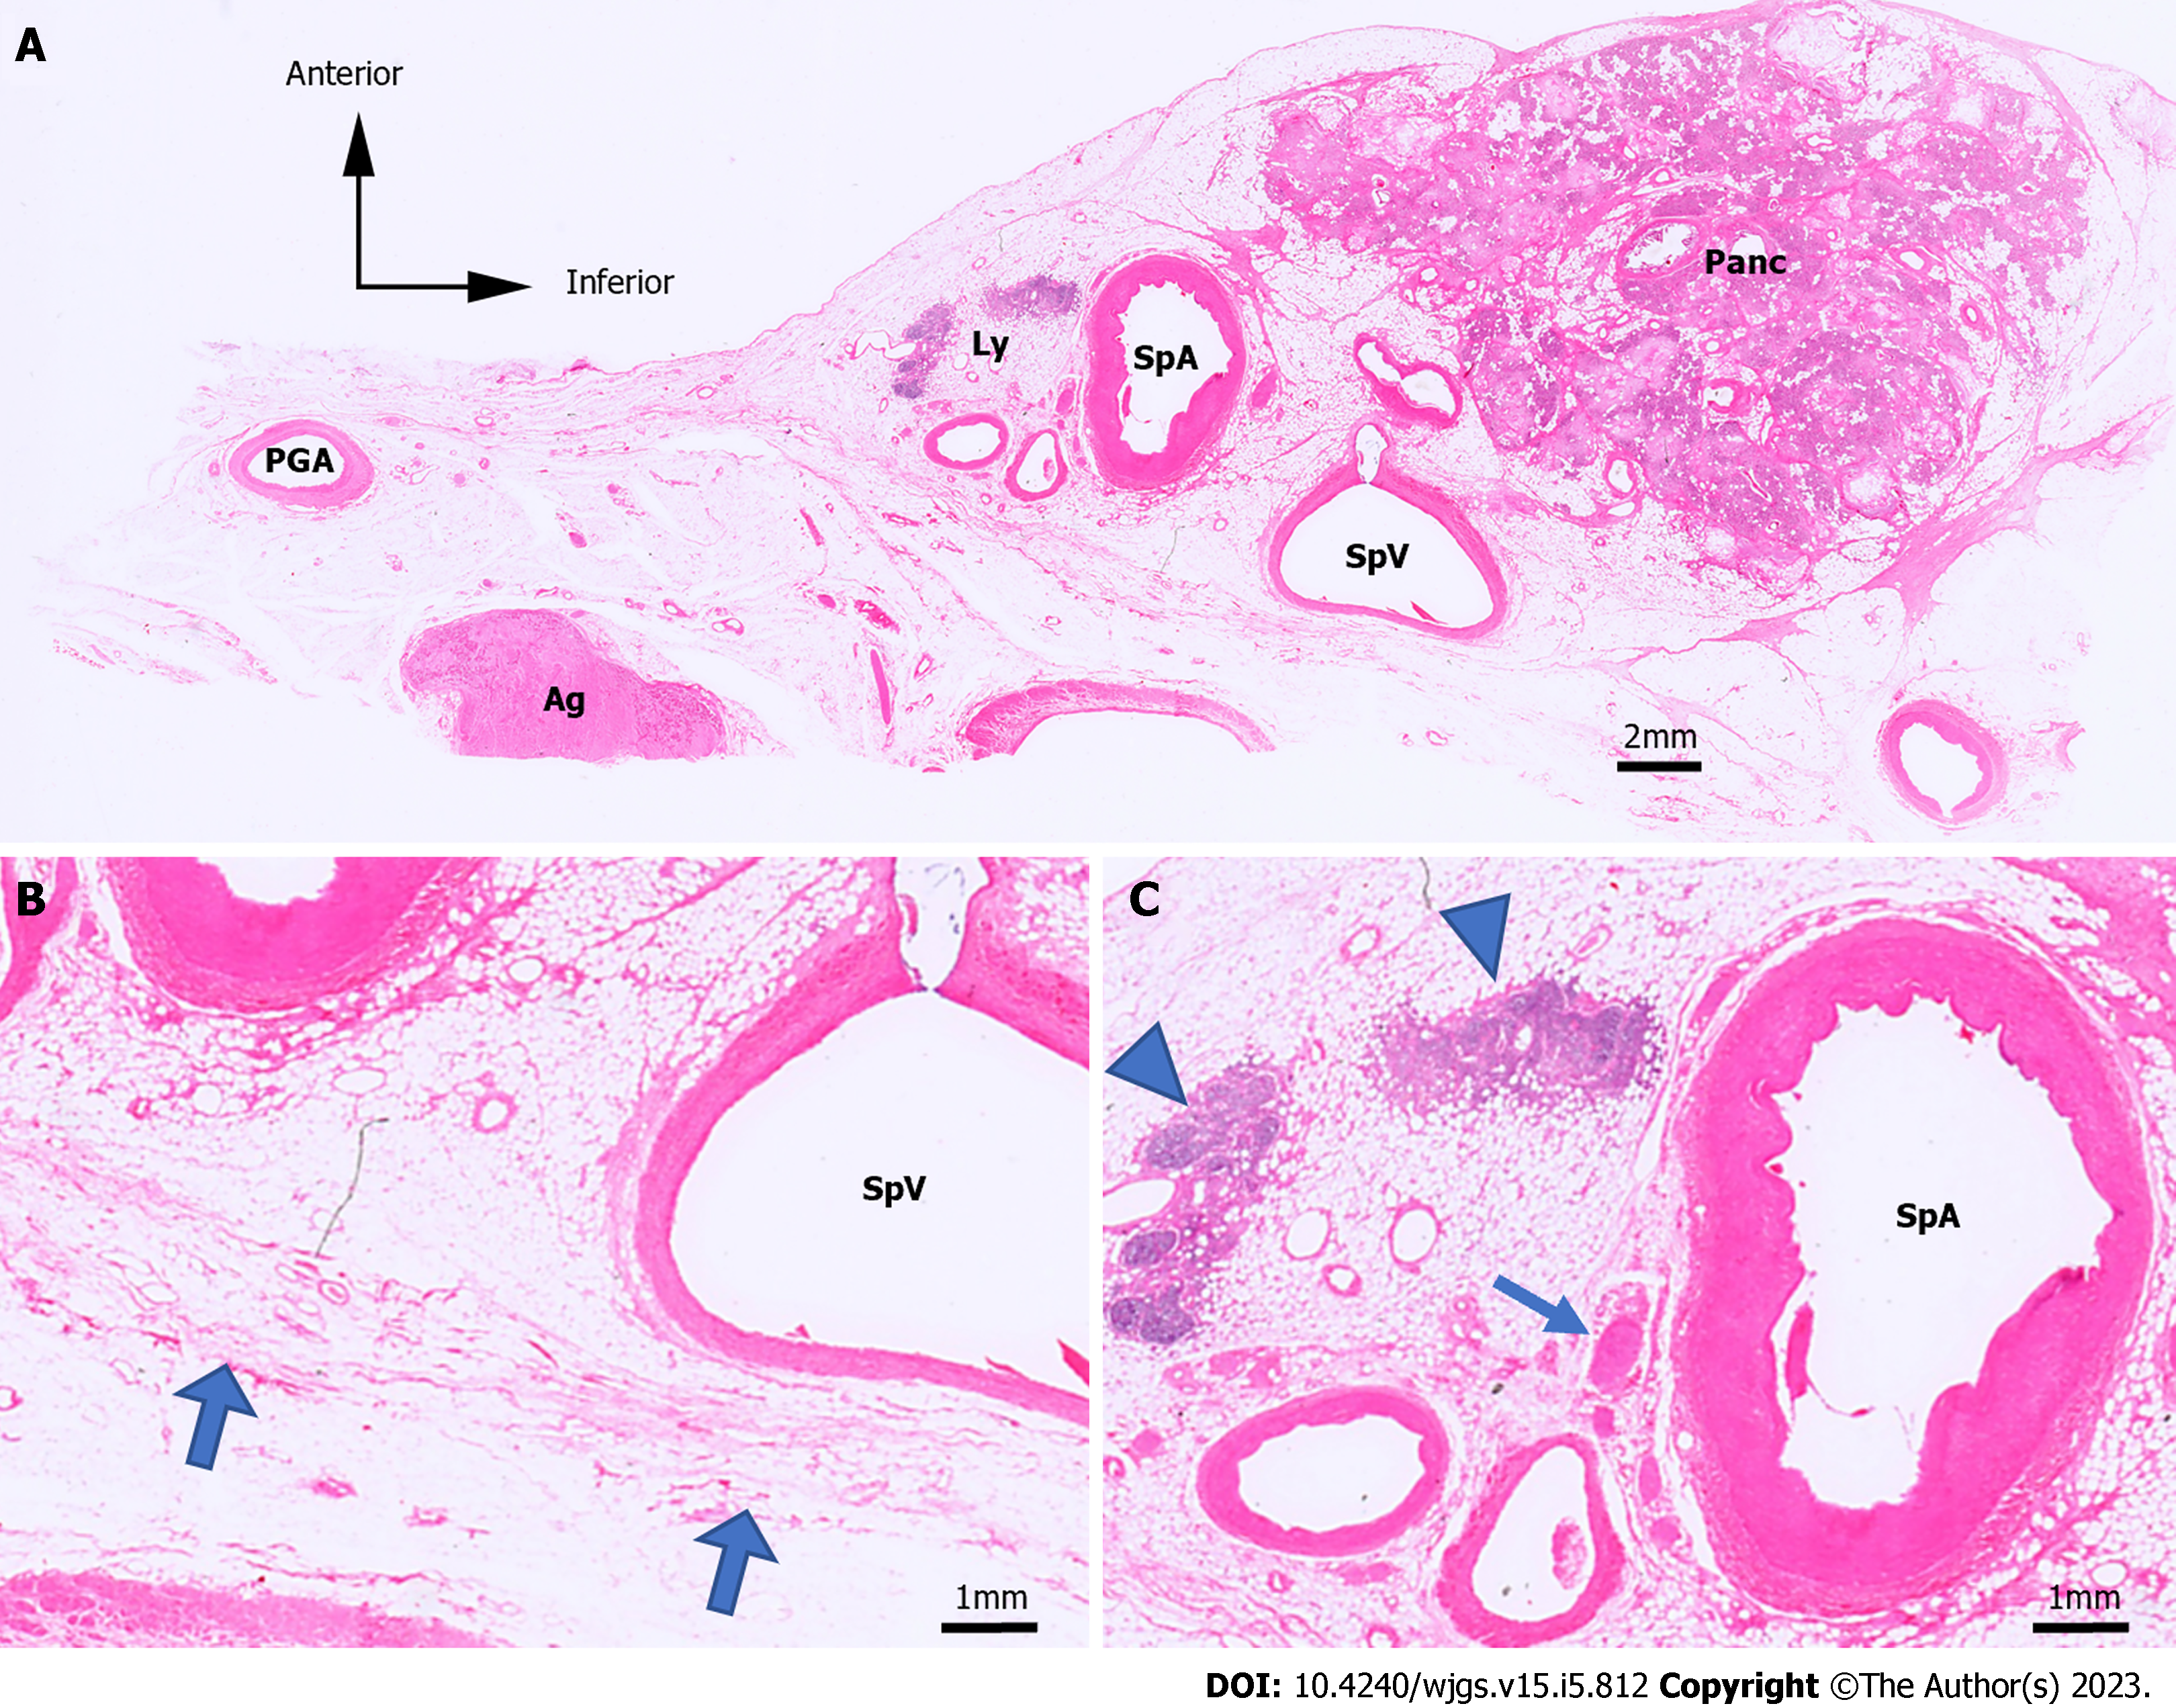
Figure 2 Hematoxylin & eosin-stained microslides.
Hematoxylin & eosin (H&E)-stained microslides. A: H&E-stained images of the No. 11 lymph node (LN) region in case 1; B and C: Enlarged image of A. The retroperitoneal layer can be seen as fibrous structures, indicated by the thick arrows. H&E, hematoxylin and eosin; Panc: Pancreas; SpA: Splenic artery; SpV: Splenic vein; Ly: Lymph; Ag: Adrenal gland; PGA: Post-gastric artery; Arrowhead: Lymph node; Arrow: Nerve; Thick arrow: Border with the retroperitoneal region.
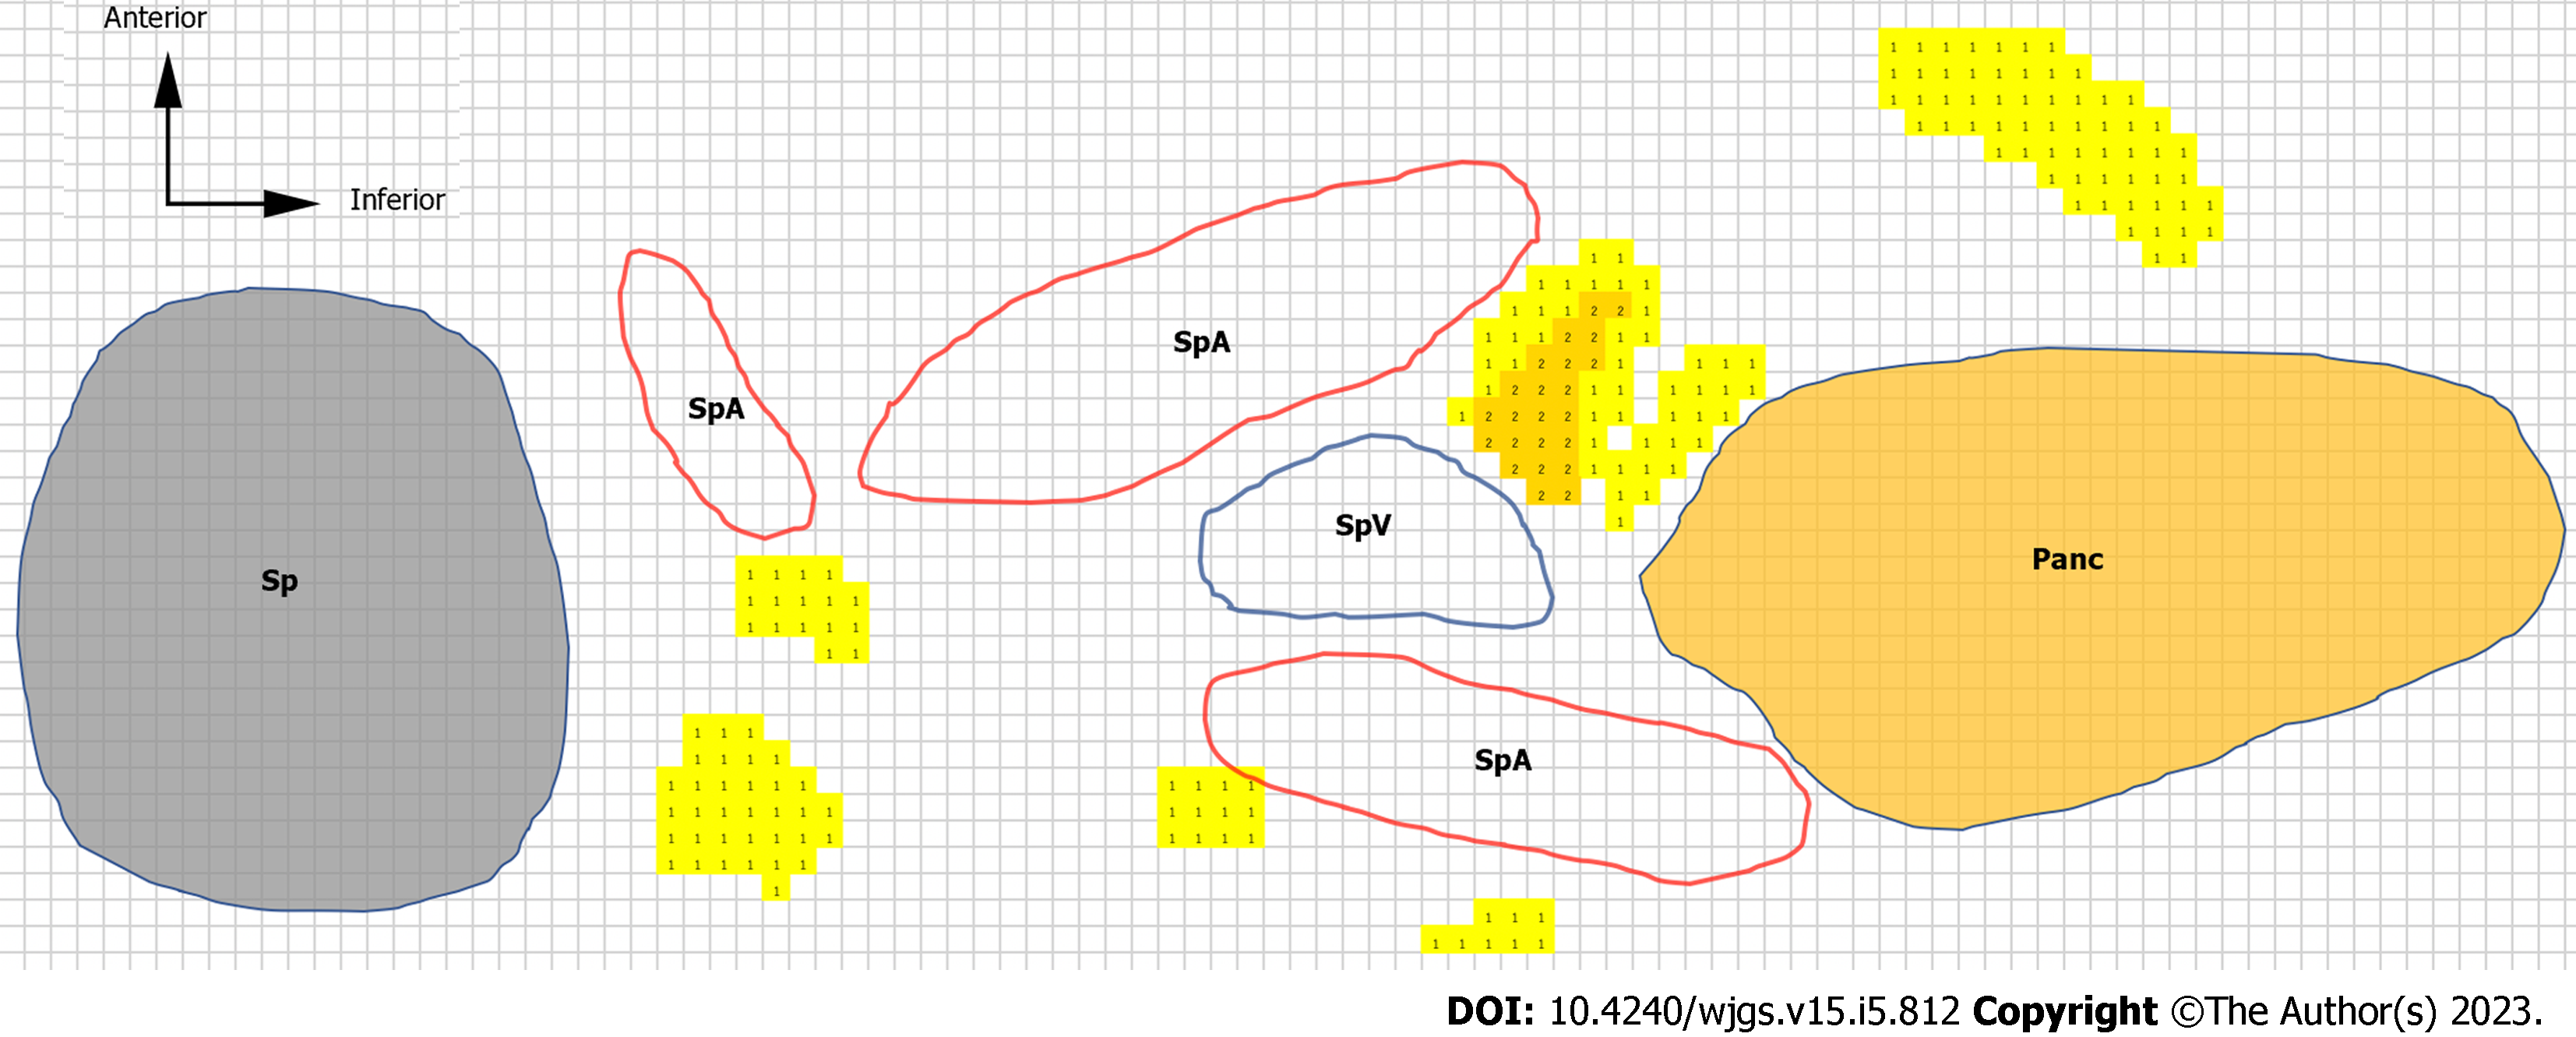
Figure 3 Heatmap and color scale.
We traced the major structures [i.e., pancreatic parenchyma, spleen, splenic artery, splenic vein, and lymph nodes (LNs)] around the No. 11d LN region in case 4. The number of LNs is represented as a heatmap. We made the heatmap using the color scale function of Microsoft Excel for Mac (version 16.16.27[202012]). The scale is set to show that the number of LNs increases as the color changes from yellow to red. The colored cells with numbers are LN heatmaps. LN: Lymph node; Sp: Spleen; Panc: Pancreas; SpA: Splenic artery; SpV: Splenic vein.
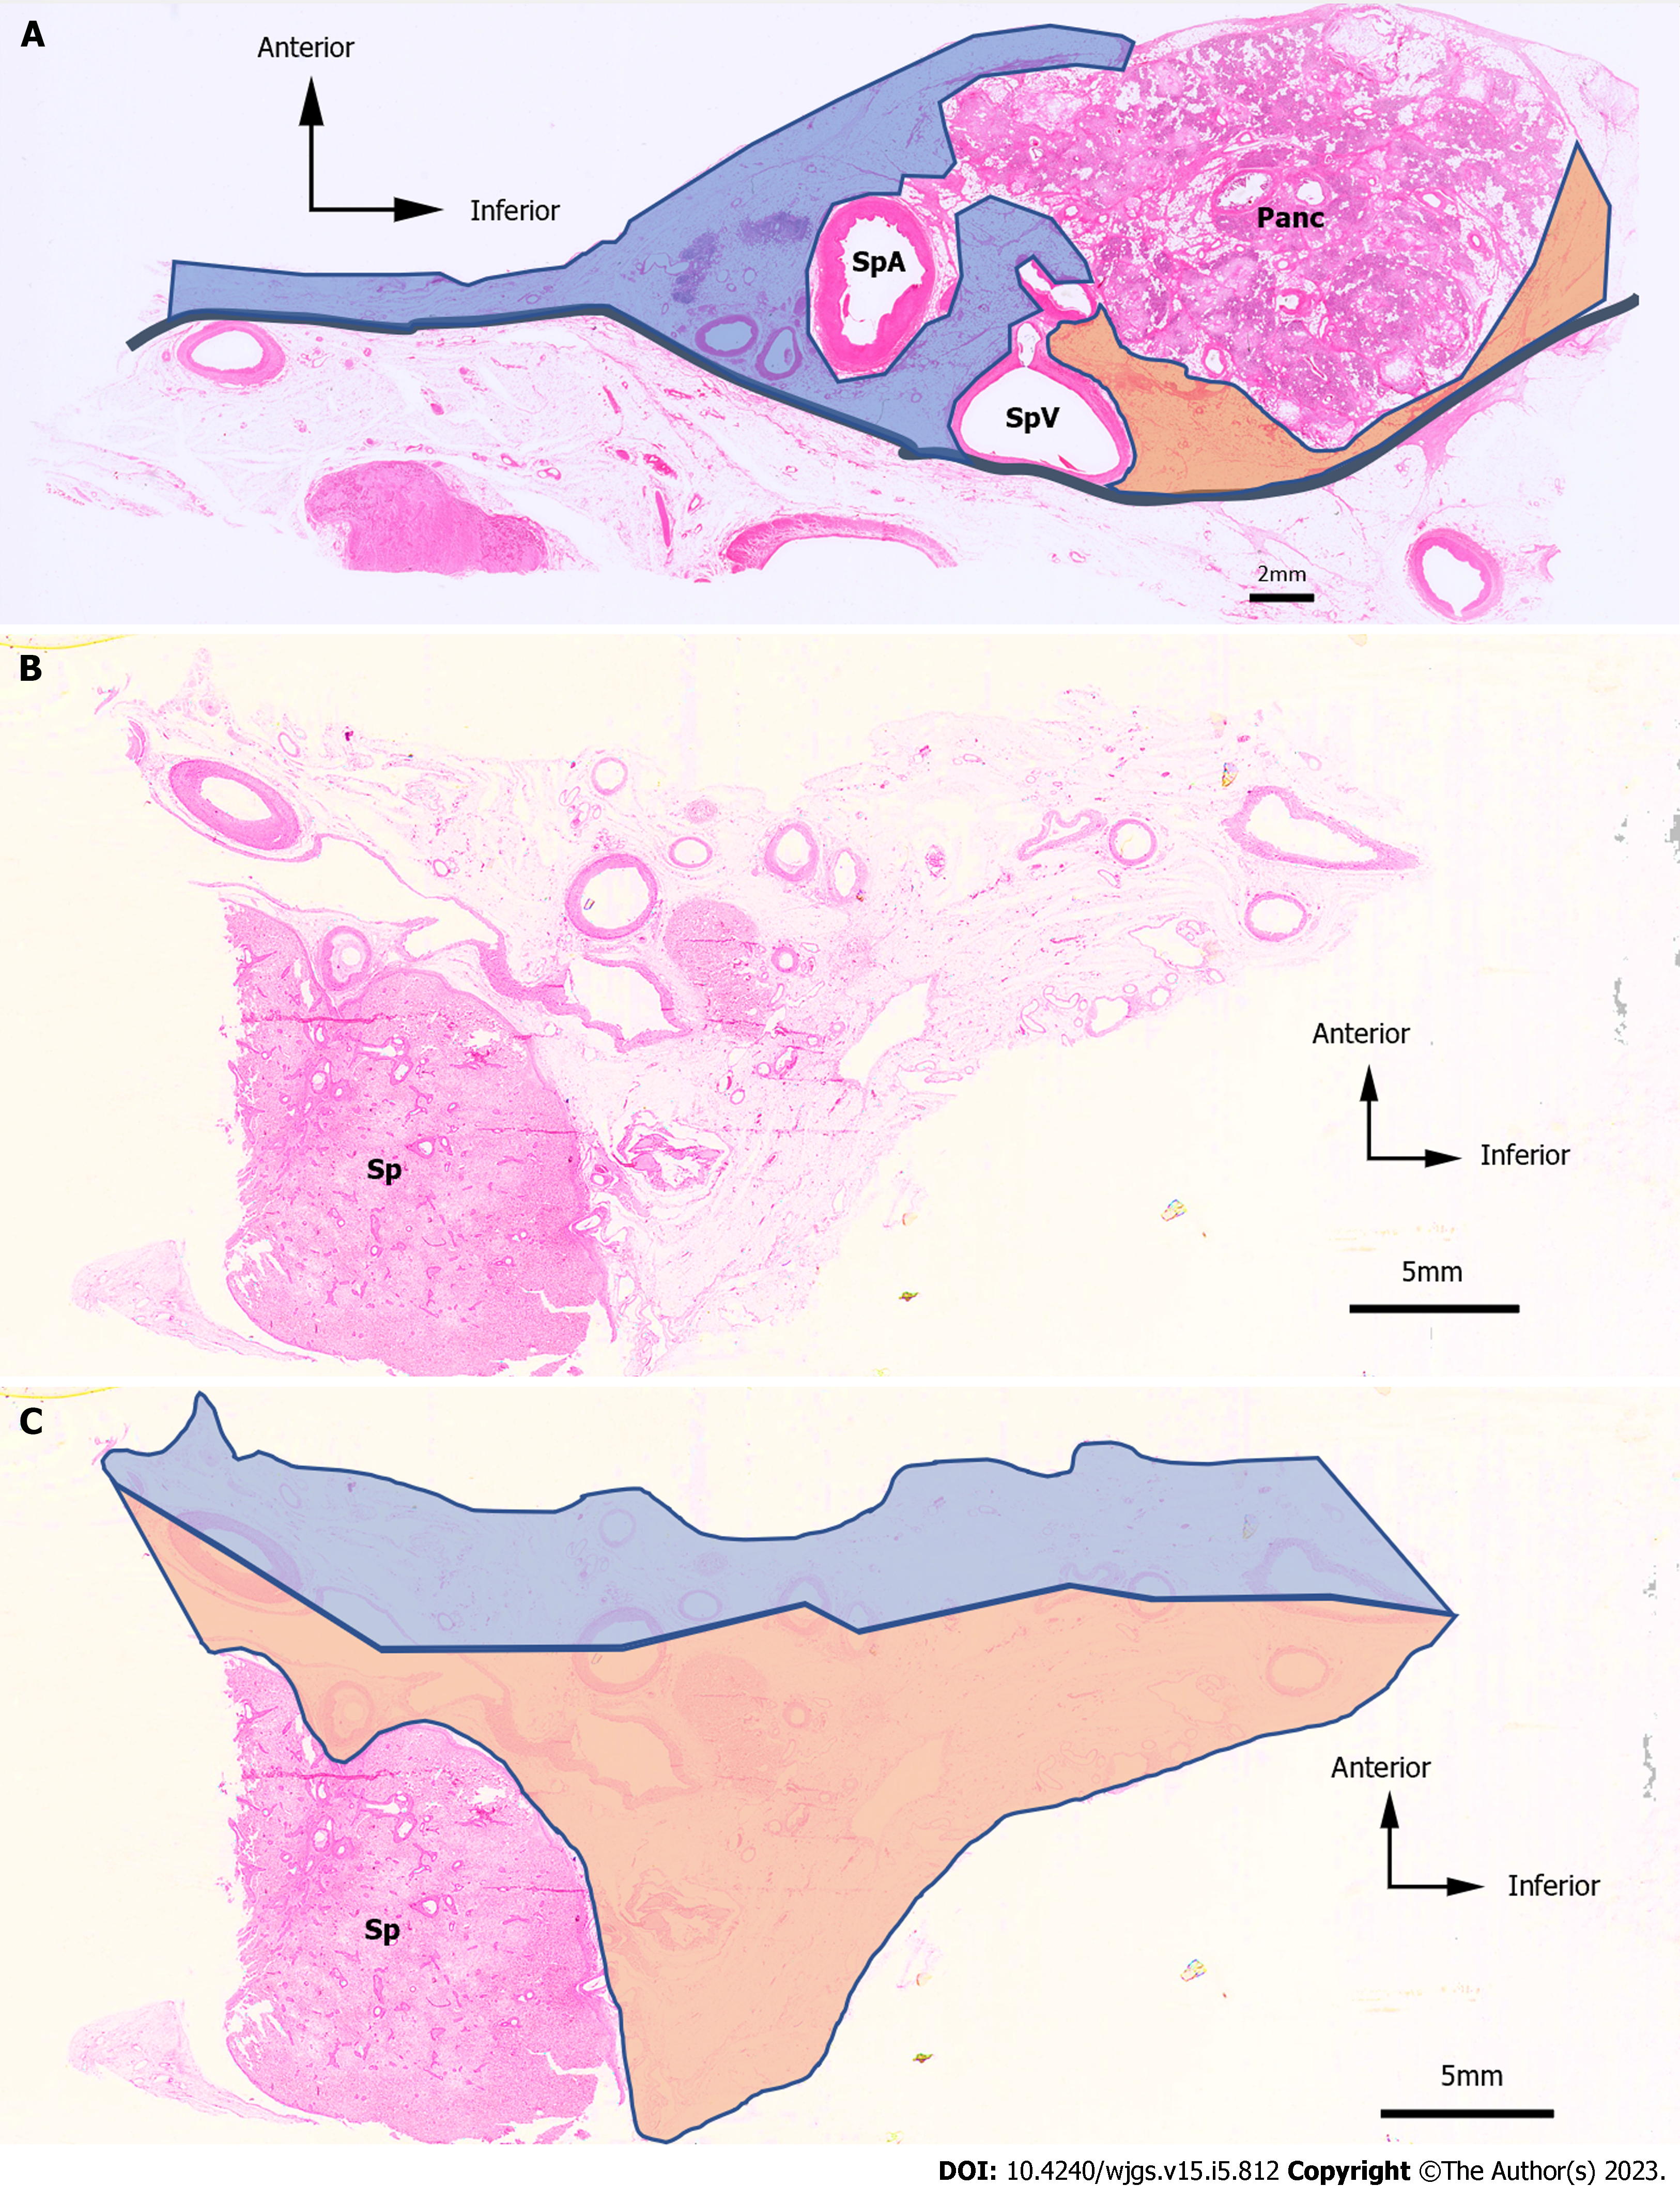
Figure 4 Hematoxylin & eosin-stained images and an example of the anterior side and the posterior side.
Hematoxylin & eosin (H&E)-stained images and an example of the anterior side and the posterior side. A: H&E-stained images of the No. 11 lymph node (LN) region in case 1. The anterior side is represented by the blue area, and the posterior side is represented by the orange area; B: H&E-stained images of the No. 10 LN region in case 4; C: The anterior side is represented as the blue area, and the posterior side is represented as the orange area. H&E: Hematoxylin and eosin; LN: Lymph node; Panc: Pancreas; SpA: Splenic artery; SpV: Splenic vein; Sp: Spleen.
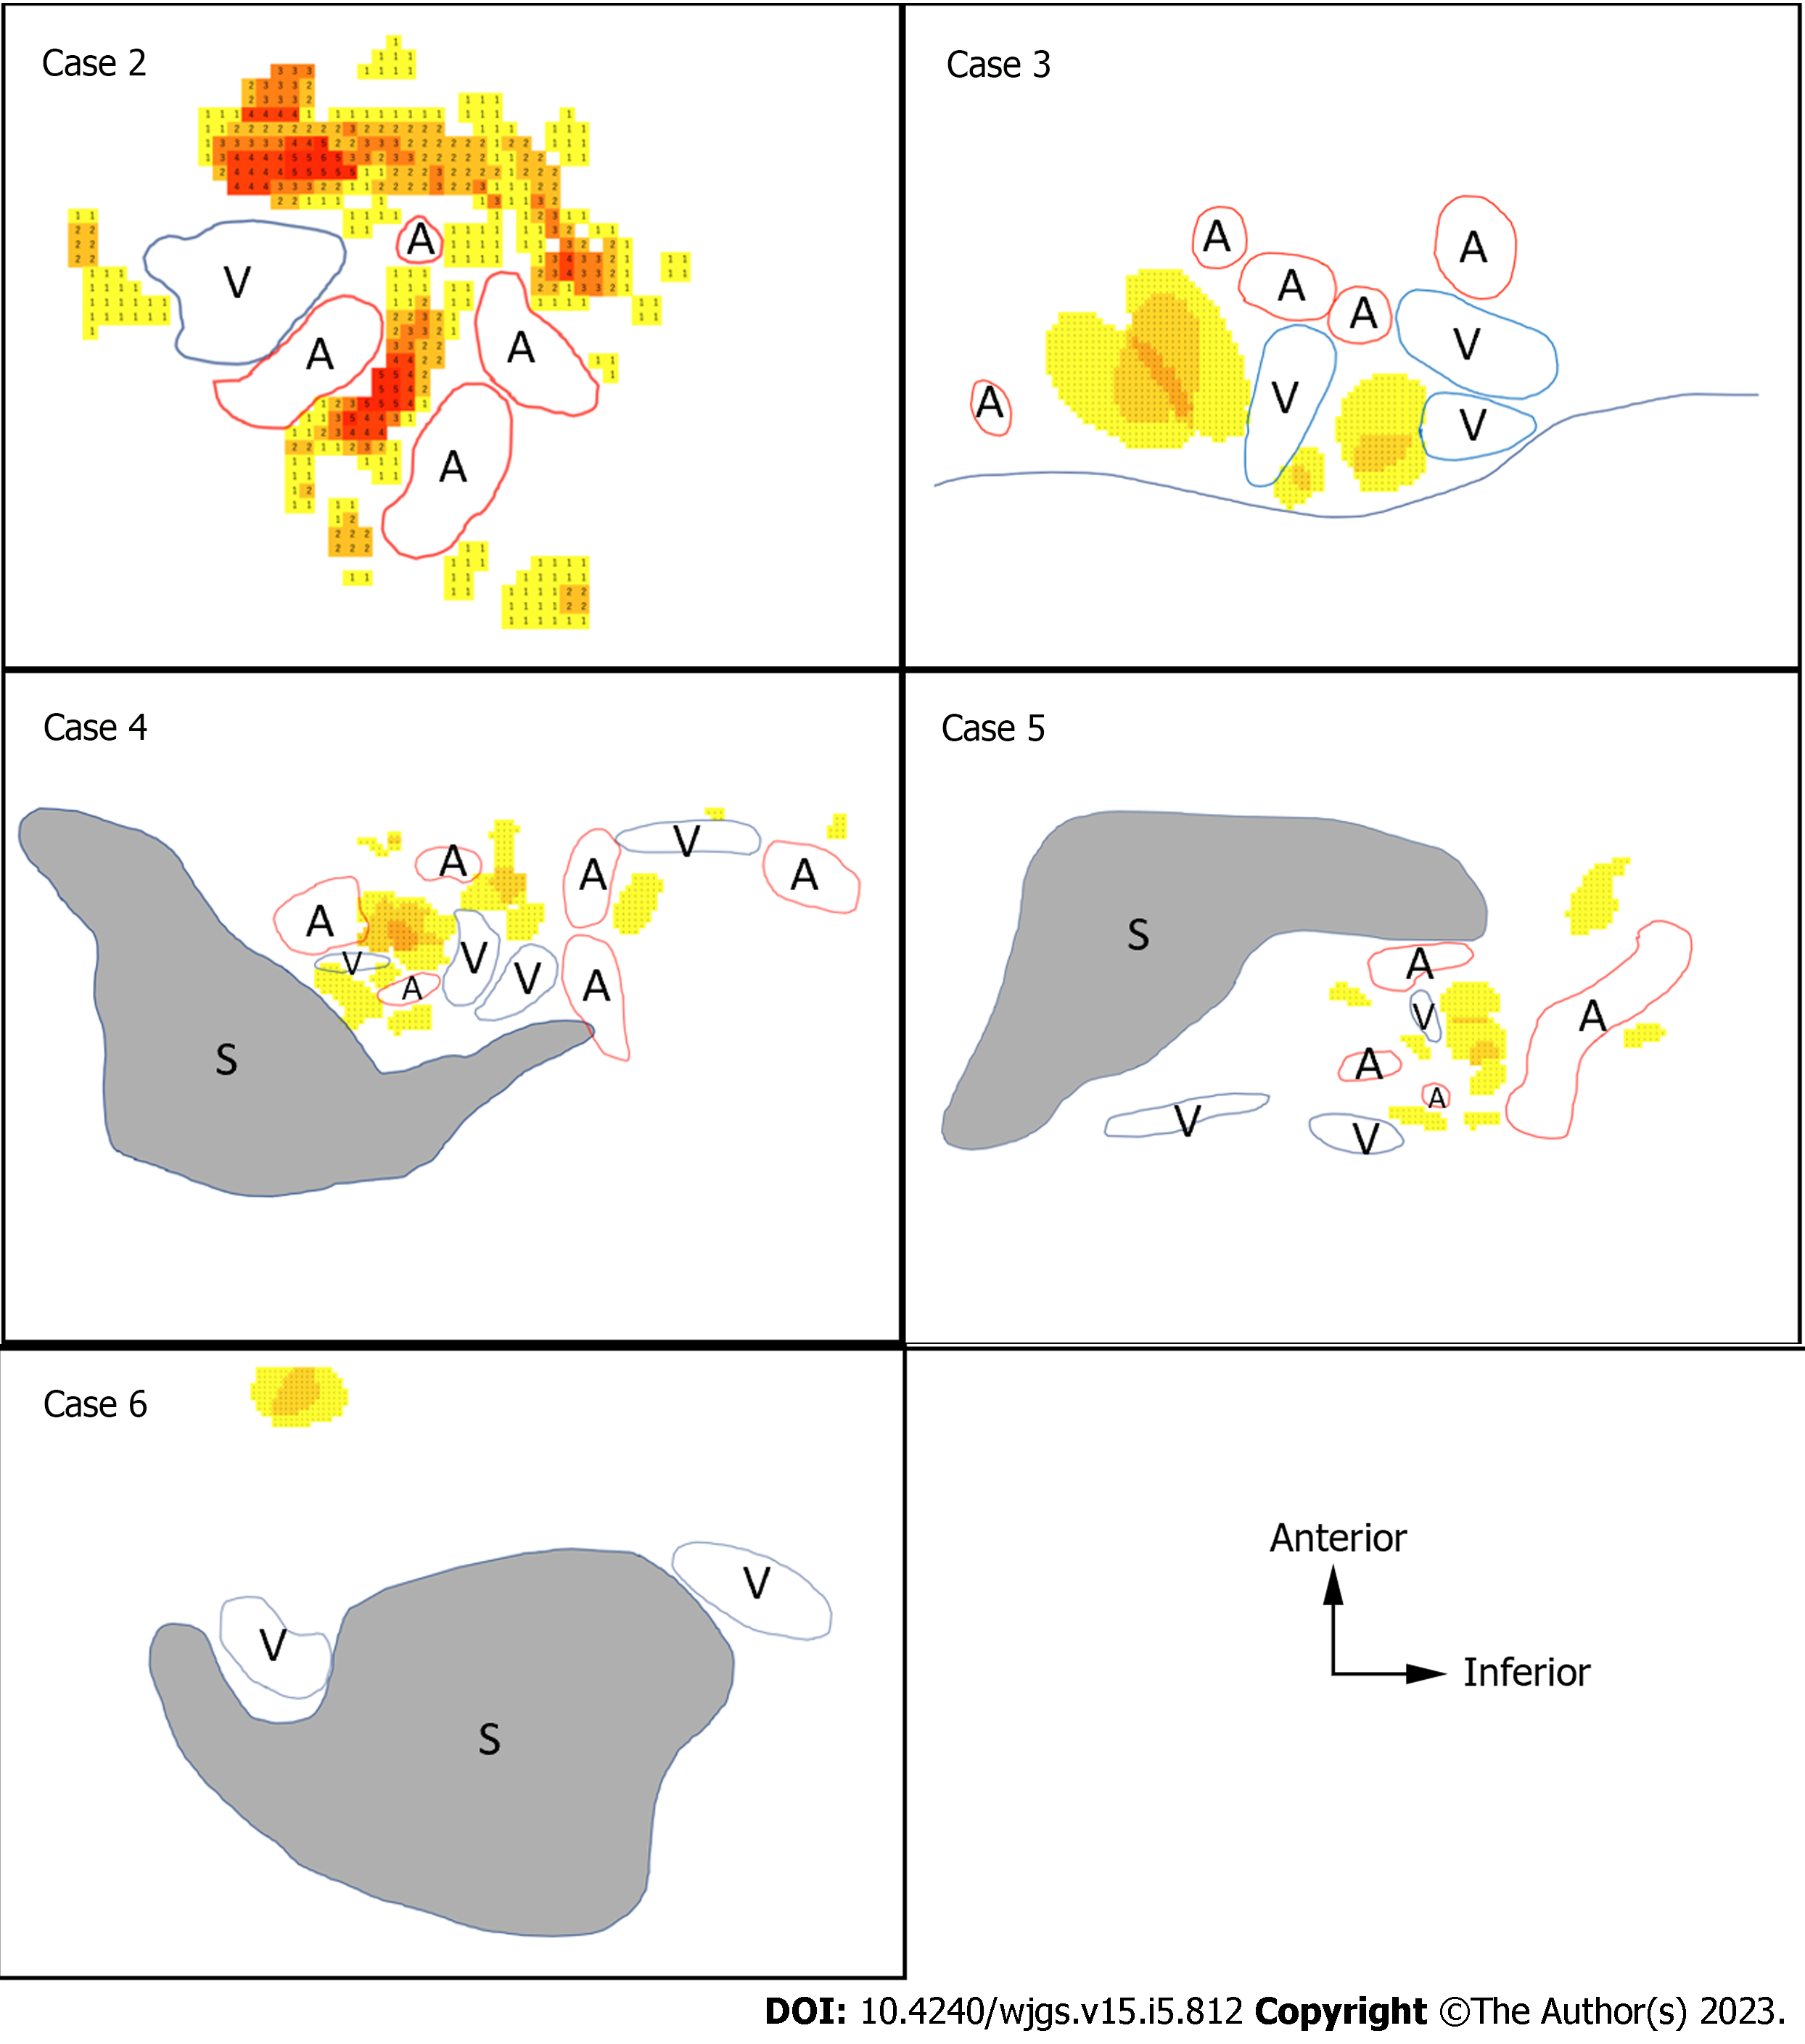
Figure 5 Heatmaps of the splenic hilum region.
Heatmaps of the splenic hilum region. Heatmaps of the five cadavers studied for the splenic hilum utilizing the color scale of Microsoft Excel for Mac (version 16.16.27[202012]). The scale is set to show that the number of lymph nodes (LNs) increases as the color changes from yellow to red. The colored cells with numbers are LN heatmaps. A: Splenic artery; V: Splenic vein; S: Spleen; LN: Lymph node.
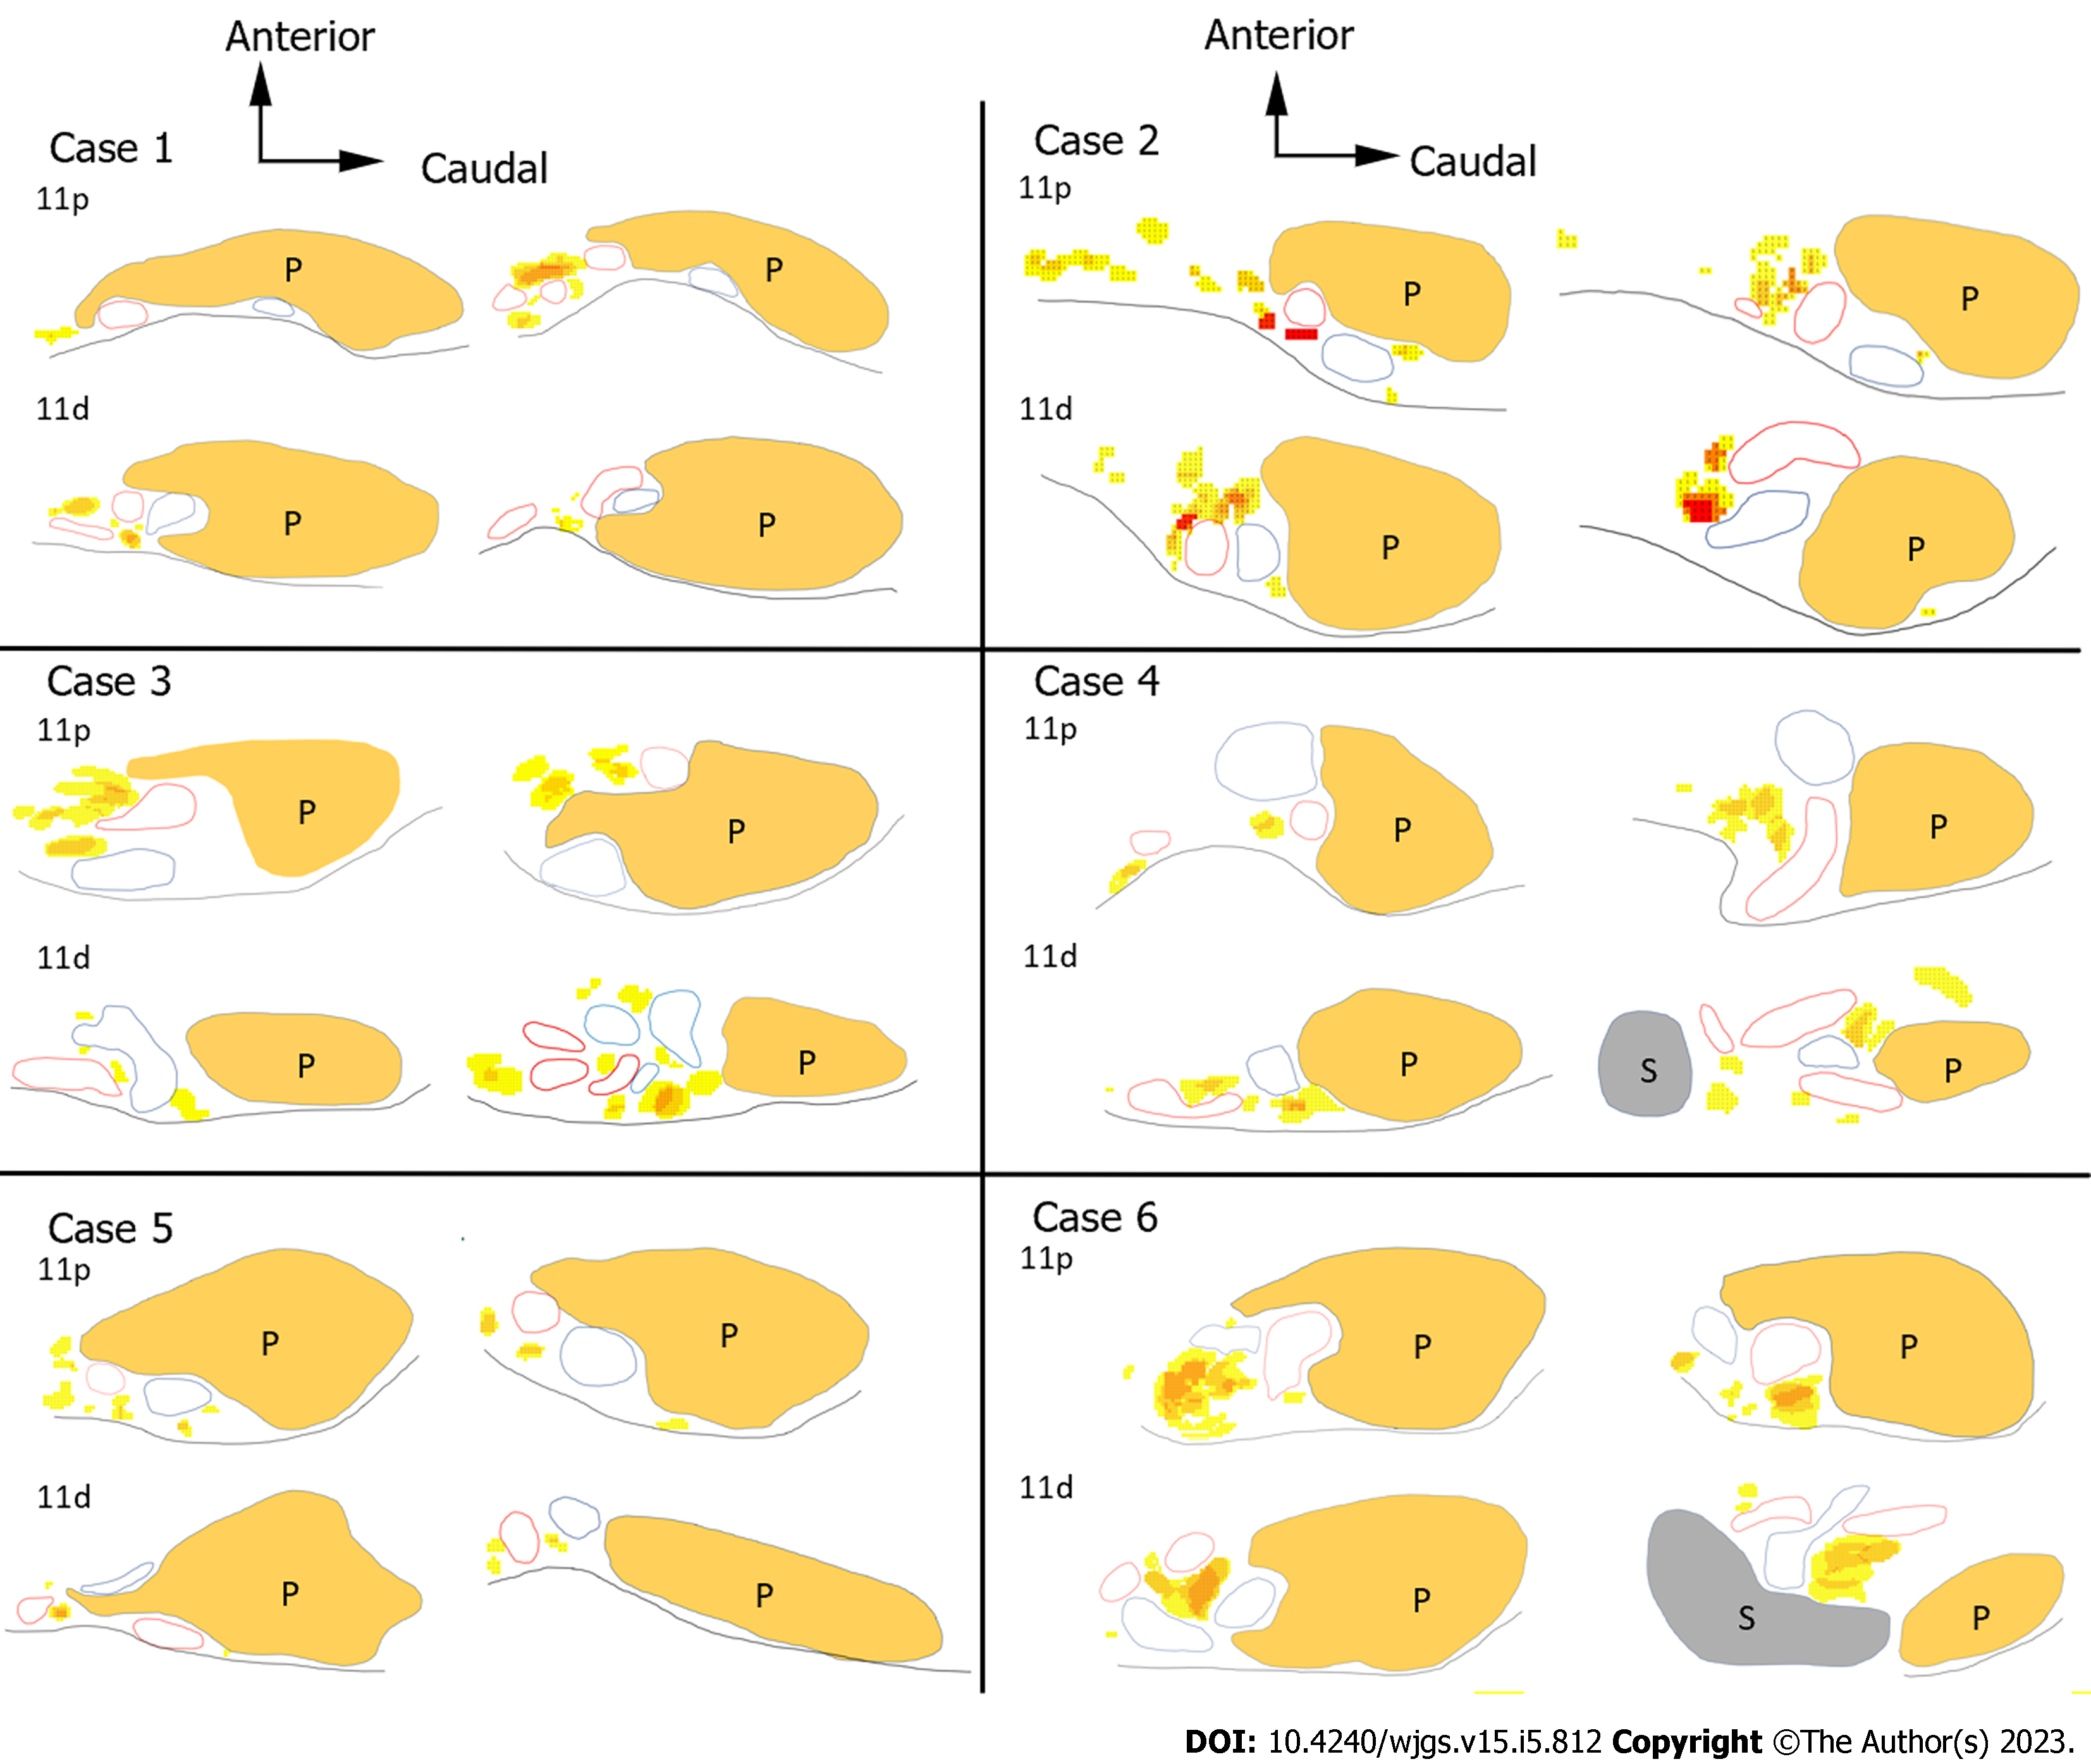
Figure 6 Heatmaps of the splenic artery lymph node region.
Heatmaps of the splenic artery lymph node (LN) region. Heatmaps of the No. 11p and No. 11d LN regions in each case. The color scale settings are the same as in Figure 5. LN: Lymph node; 11p: No. 11p lymph node; 11d: No. 11d lymph node; P: Pancreas; S: Spleen.
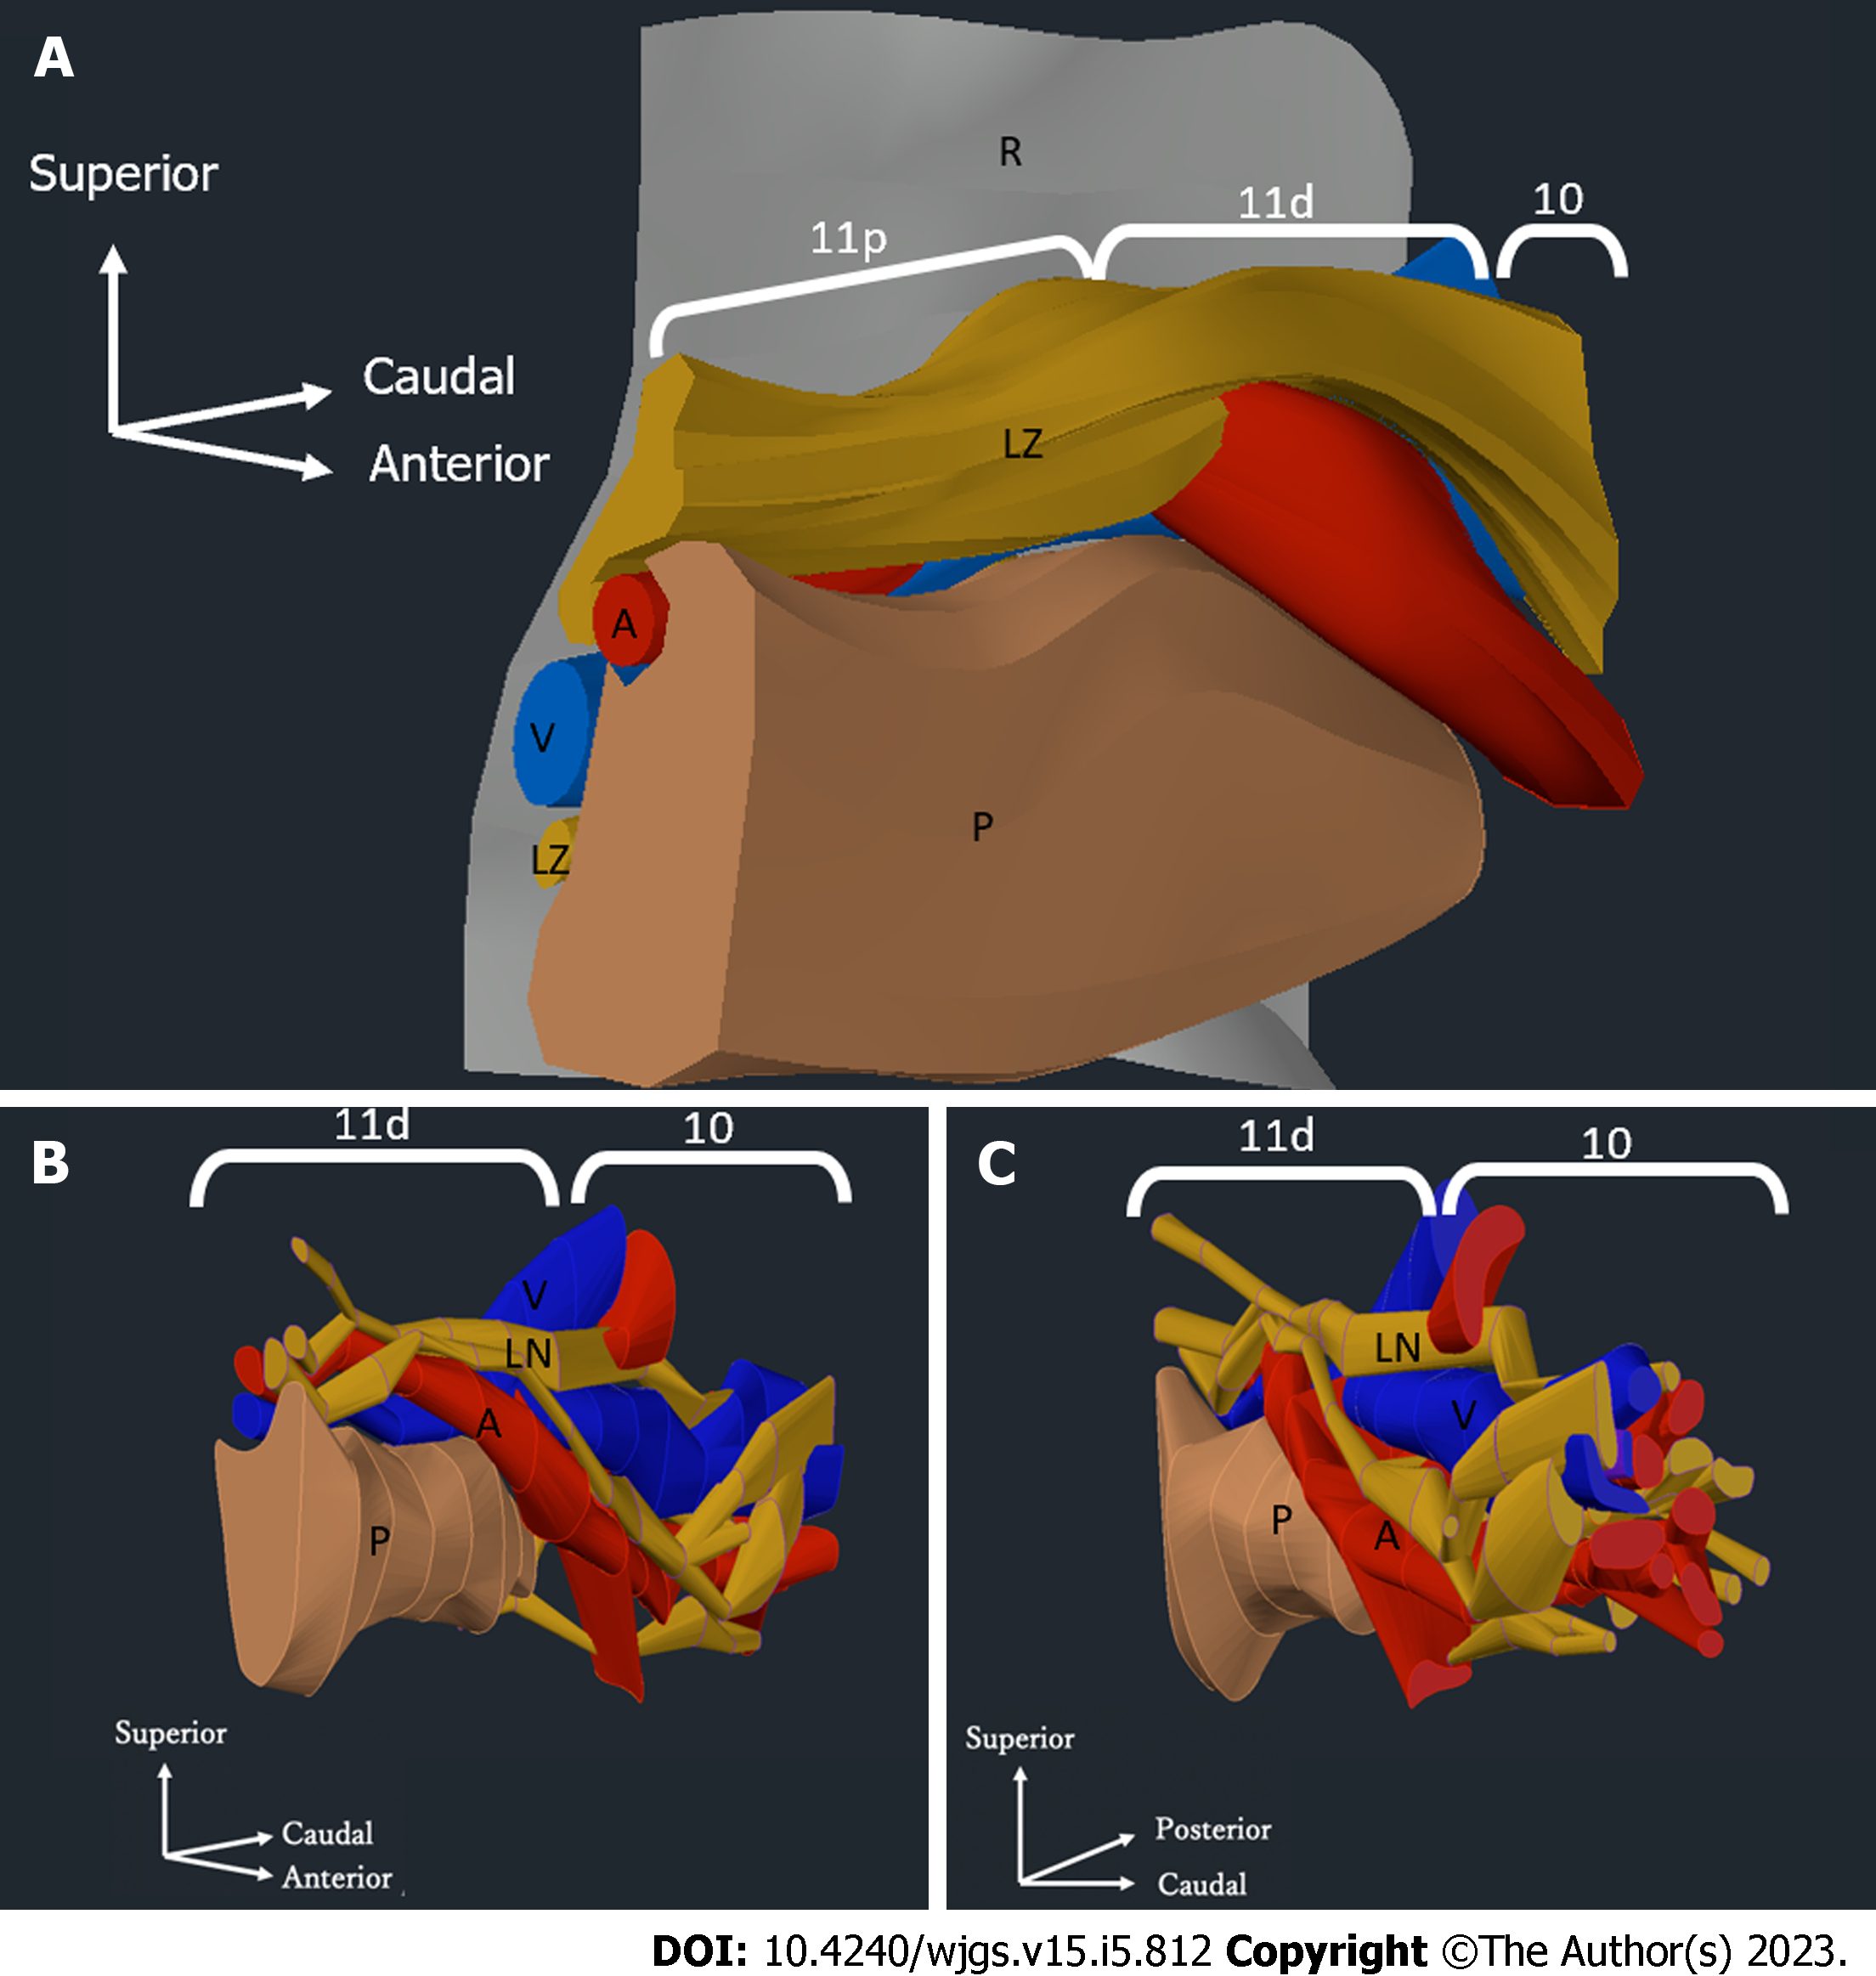
Figure 7 Three-dimensional model of the distribution of the pancreas, splenic artery, splenic vein, and lymph nodes.
Three-dimensional model of the distribution of the pancreas, splenic artery, splenic vein, and lymph nodes (LNs). A: Three-dimensional model of the distribution of the pancreatic parenchyma, splenic artery, splenic vein, and LNs in the No. 11 region in case 2. The yellow zones represent the areas that contain LNs and surrounding tissues; B and C: Three-dimensional model showing the distribution of the pancreatic parenchyma, splenic artery, splenic vein, and LNs in the region of LN No. 11p and LN No. 10 in case 2. The yellow zones represent the LNs. Three-dimensional model viewed from the pancreatic head toward the splenic hilum. The retroperitoneal side is on the left (B). Three-dimensional model of the splenic hilum looking toward the pancreatic head. The retroperitoneal side is on the right (C). Brown: Pancreatic parenchyma; Red: Splenic artery; Blue: Splenic vein; Yellow: Lymph nodes; Gray: Border with the retroperitoneum; R: Retroperitoneal; LZ: Lymph node zone; A: Splenic artery; V: Splenic vein; P: Pancreas; LN: Lymph node; 11p: No. 11p lymph node; 11d: No. 11d lymph node; 10: No. 10 lymph node.
- Citation: Umebayashi Y, Muro S, Tokunaga M, Saito T, Sato Y, Tanioka T, Kinugasa Y, Akita K. Distribution of splenic artery lymph nodes and splenic hilar lymph nodes. World J Gastrointest Surg 2023; 15(5): 812-824
- URL: https://www.wjgnet.com/1948-9366/full/v15/i5/812.htm
- DOI: https://dx.doi.org/10.4240/wjgs.v15.i5.812


