Copyright
©The Author(s) 2023.
World J Gastrointest Surg. Mar 27, 2023; 15(3): 471-479
Published online Mar 27, 2023. doi: 10.4240/wjgs.v15.i3.471
Published online Mar 27, 2023. doi: 10.4240/wjgs.v15.i3.471
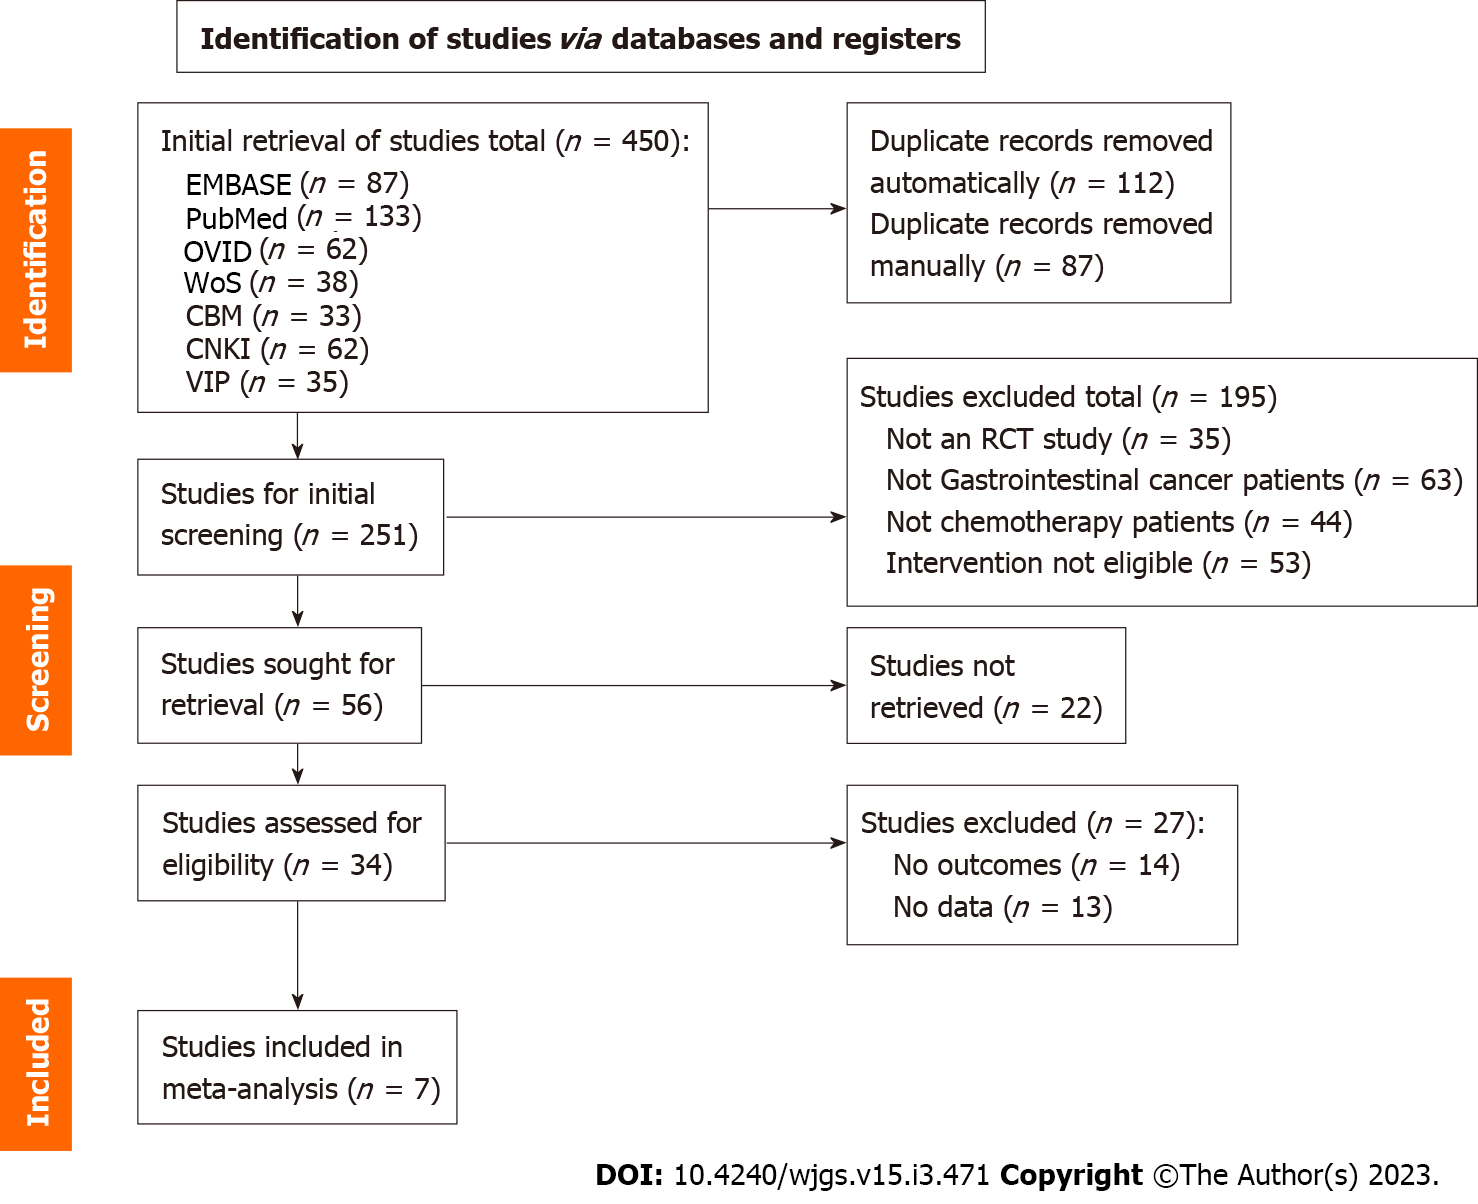
Figure 1 Literature selection flow chart.
RCT: Randomized control trial.
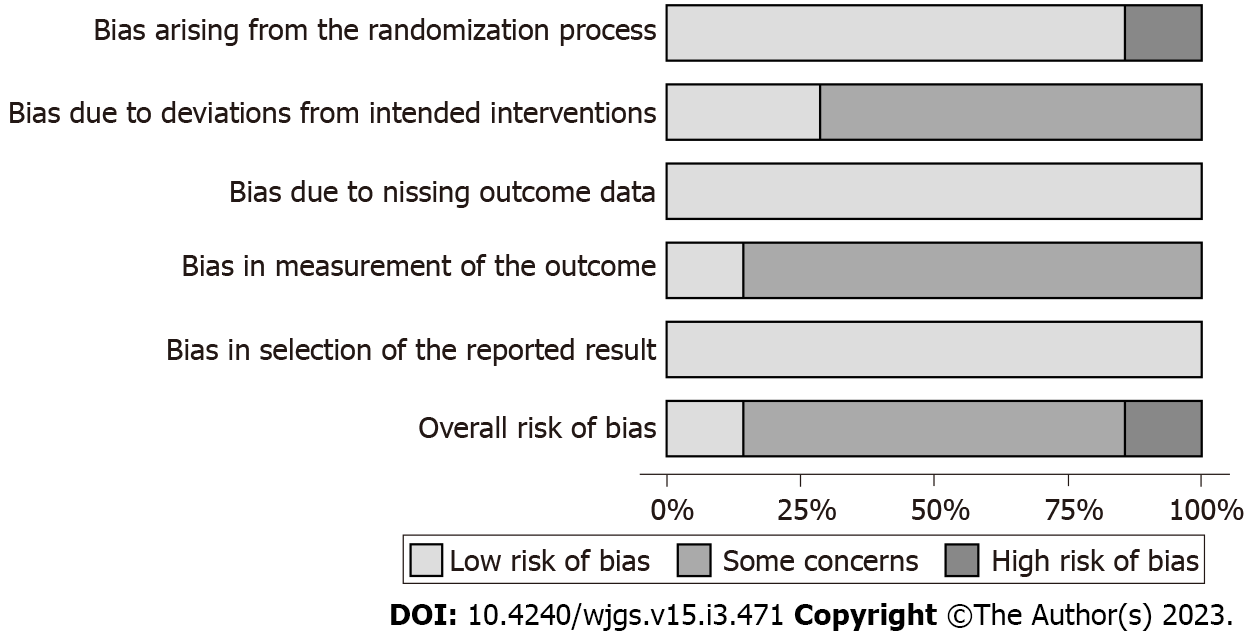
Figure 2 Bias analysis based on ROB 2.
0.
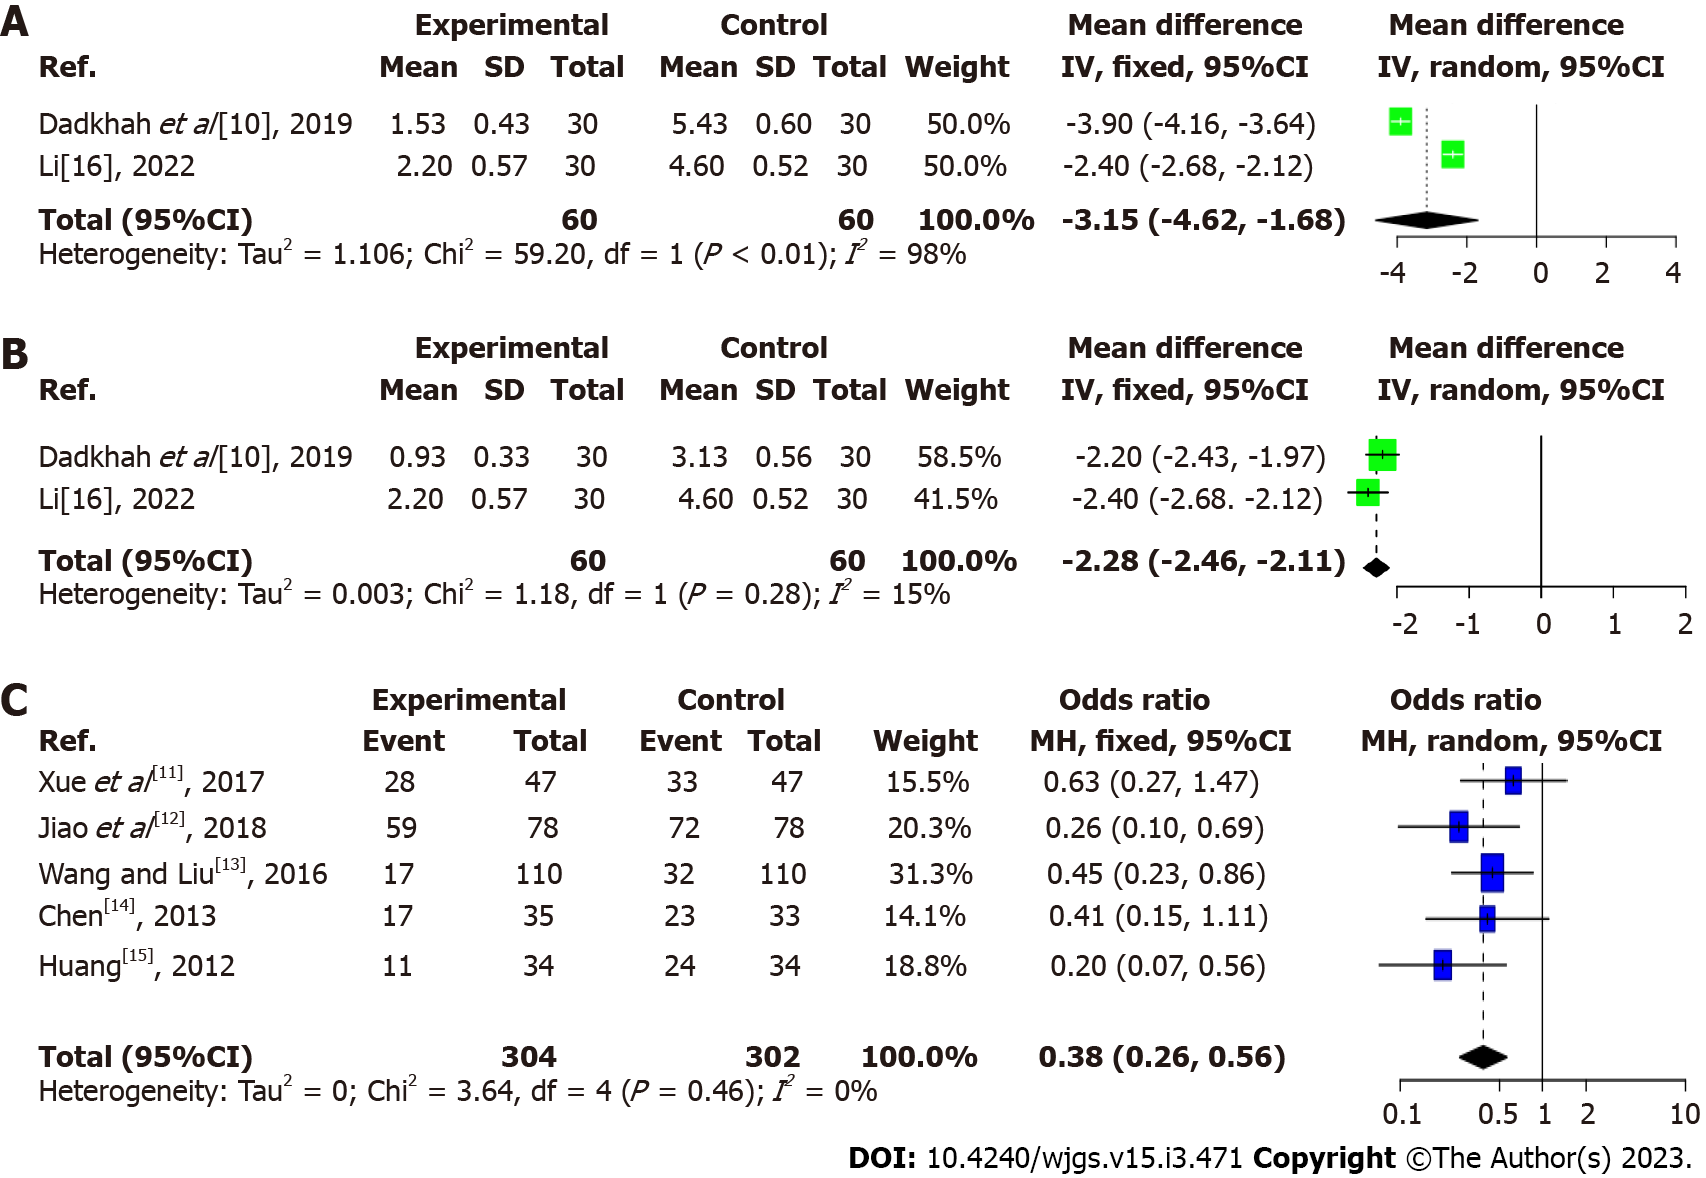
Figure 3 Effect of music therapy on nausea symptom score, vomiting symptom scores, and the number of cases of nausea and vomiting after chemotherapy.
A: Nausea symptom score; B: Vomiting symptom scores; C: The number of cases of nausea and vomiting. CI: Confidence interval.
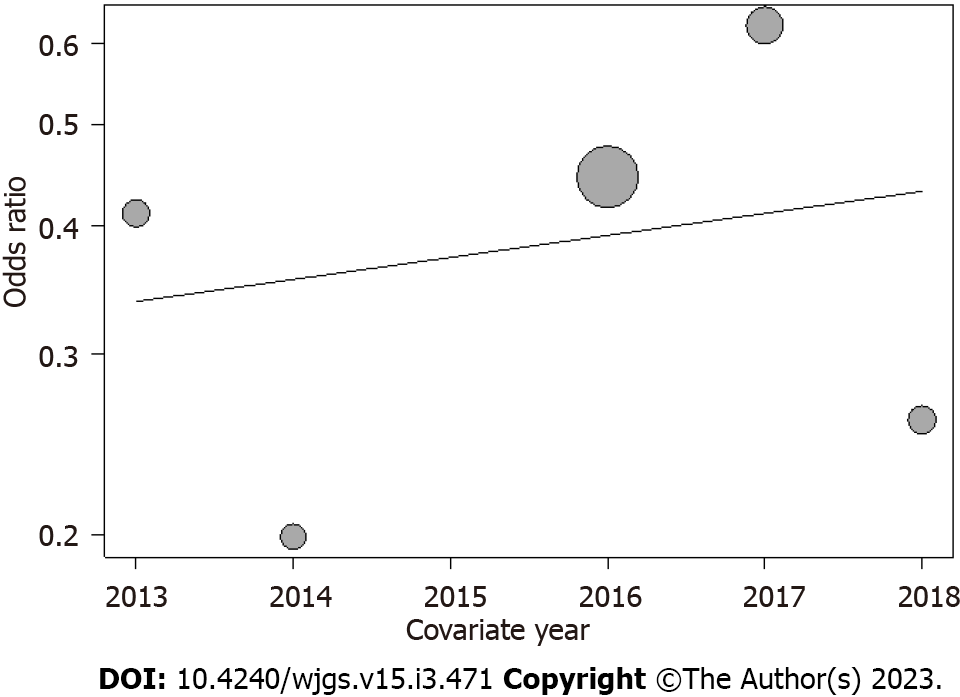
Figure 4 Meta-regression analysis of incidence indicators for nausea and vomiting: Publication year factor (P = 0.
68).
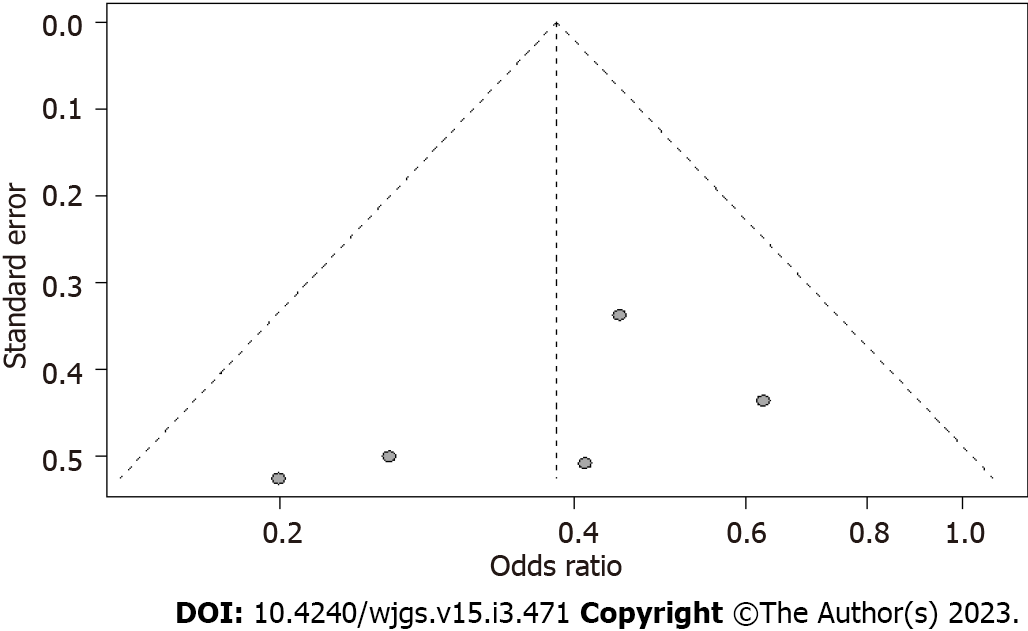
Figure 5 Funnel plot for nausea and vomiting incidence indicators.
- Citation: Zhong FP, Zhong J, Zhong MY. Effect of music therapy on chemotherapy-induced nausea and vomiting in gastrointestinal cancer: A systematic review and meta-analysis. World J Gastrointest Surg 2023; 15(3): 471-479
- URL: https://www.wjgnet.com/1948-9366/full/v15/i3/471.htm
- DOI: https://dx.doi.org/10.4240/wjgs.v15.i3.471


