Copyright
©The Author(s) 2023.
World J Gastrointest Surg. Feb 27, 2023; 15(2): 258-272
Published online Feb 27, 2023. doi: 10.4240/wjgs.v15.i2.258
Published online Feb 27, 2023. doi: 10.4240/wjgs.v15.i2.258
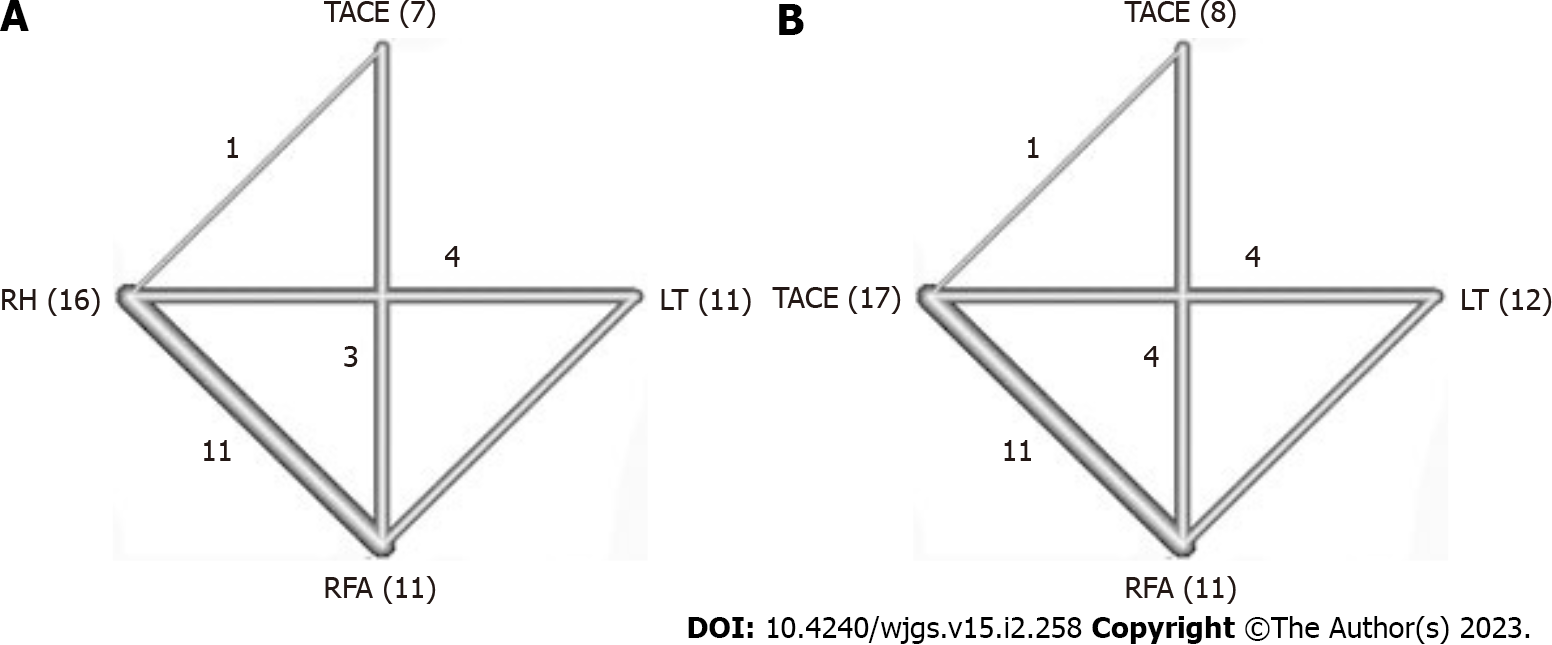
Figure 1 Network graph of study number.
Numbers appeared on the line of paired studies, and numbers with parenthesis at the angles of connected line were the cumulative number of subgroup of treatment methods in all studies. A: One-year and three-year overall survival (OS); B: Five-year OS. LT: Liver transplantation; RFA: Radiofrequency ablation; RH: Repeat hepatectomy; TACE: Transarterial chemoembolization.
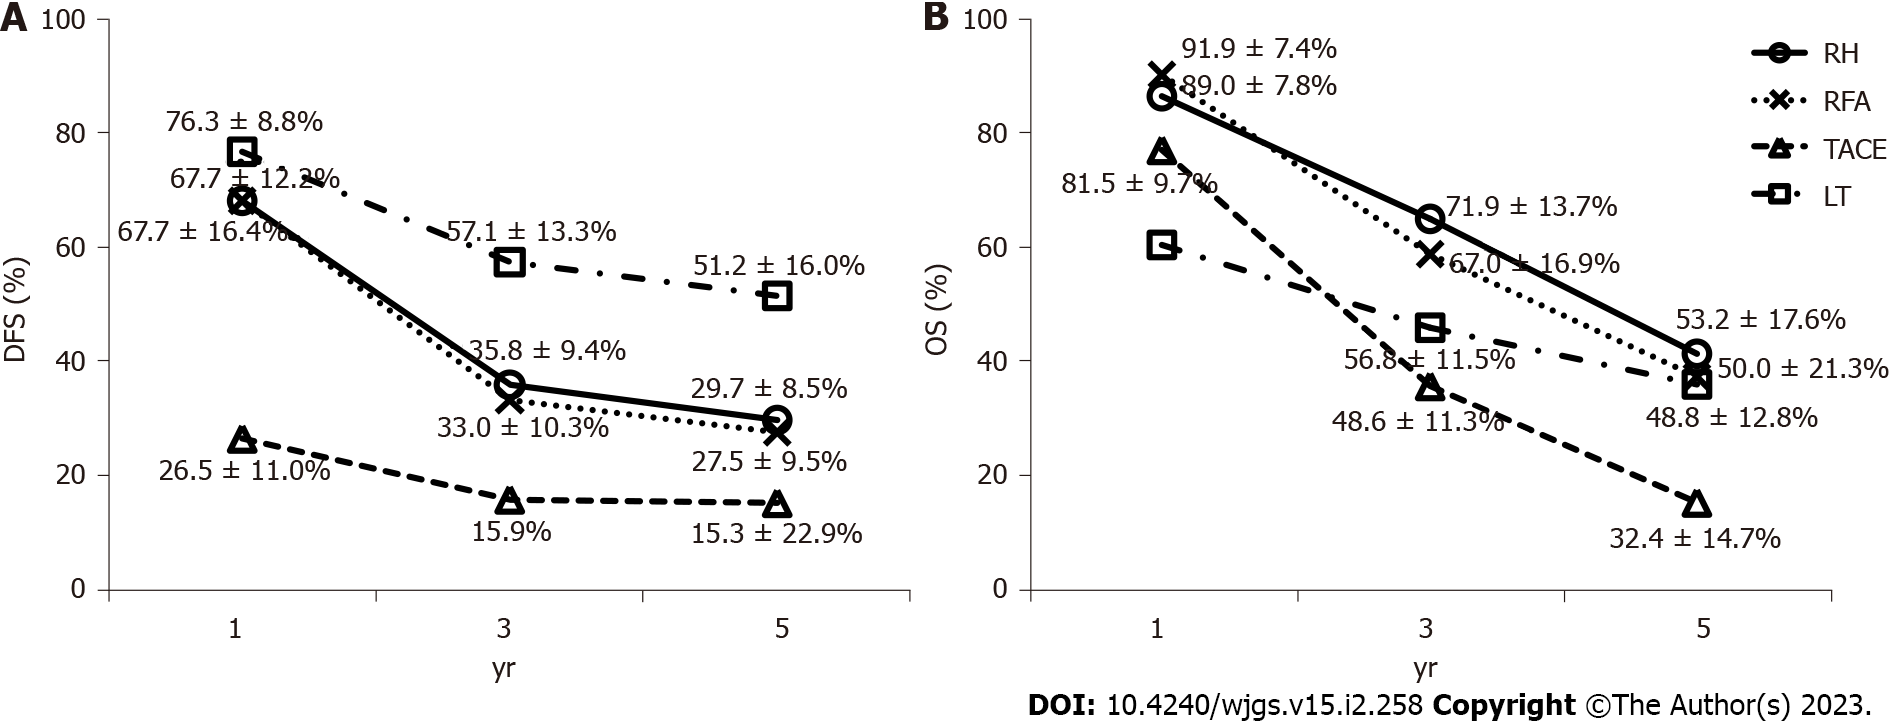
Figure 2 Pooled mean survival rates of disease-free and overall survival of the patients treated by repeated hepatectomy, radiofrequency ablation, transarterial chemoembolization, or liver transplantation in recurrent hepatocellular carcinoma from all studies.
A and B: The results of transarterial chemoembolization (TACE) disclosed the inferiority to other treatment options in disease-free survival (DFS) (A) or overall survival (B). The data of DFS were recorded and pooled together from recurrent-free survival in one arm of repeated hepatectomy and radiofrequency ablation and two arms of liver transplantation (LT), progression-free survival in one arm of TACE, and tumor-free rate in one arm of LT. DFS: Disease-free survival; LT: Liver transplantation; OS: Overall survival; RH: Repeated hepatectomy; RFA: Radiofrequency ablation; TACE: Transarterial chemoembolization.
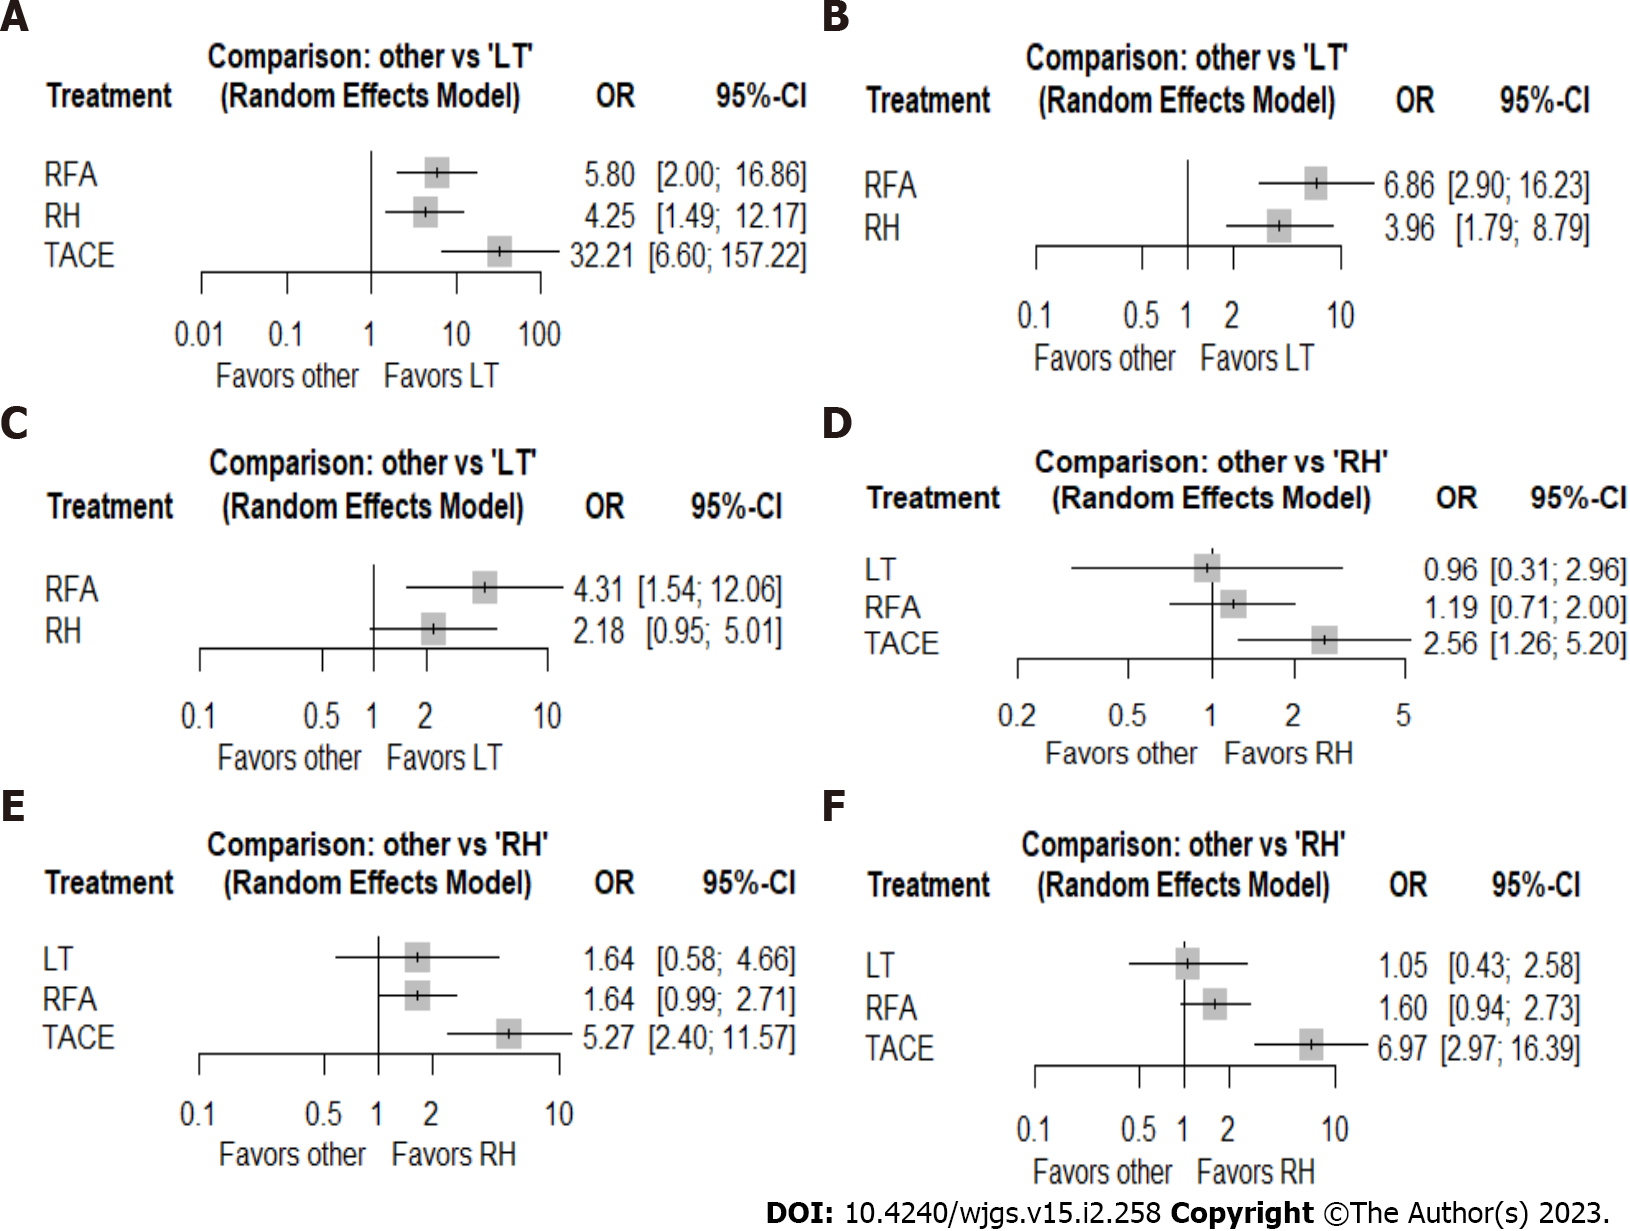
Figure 3 Forest plot analysis demonstrated the odds ratio (95%CI) of 1-year, 3-year, and 5-year disease-free survival in the liver transplantation subgroup compared with repeated hepatectomy, radiofrequency ablation, and transarterial chemoembolization and 1-year, 3-year, and 5-year overall survivalin the repeated hepatectomy subgroup compared with liver transplantation, radiofrequency ablation, and transarterial chemoembolization with the random effects model.
A: One-year disease-free survival (DFS); B: Three-year DFS; C: Five-year DFS; D: One-year overall survival (OS); E: Three-year OS; F: Five-year OS. RFA: Radiofrequency ablation; RH: Repeated hepatectomy; LT: Liver transplantation; OR: Odds ratio; TACE: Transarterial chemoembolization.
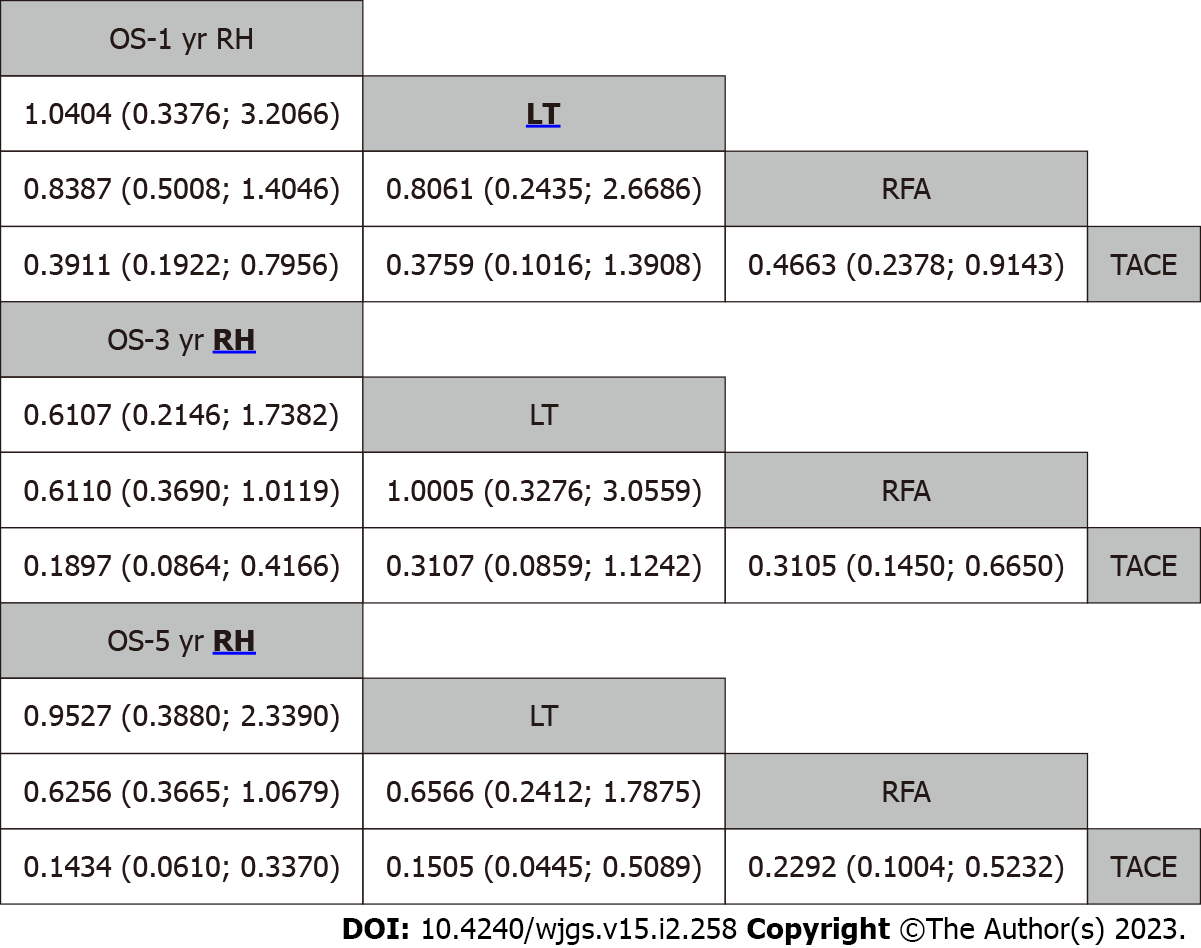
Figure 4 Hierarchic step diagram of cumulative comparative efficacy of treatment methods based on the effect size displayed with the odds ratio and corresponding 95% confidence interval of the 1-year, 3-year, and 5-year overall survival.
All results were presented as the ratio of the x-axis over the y-axis with the Wald test. The better option had an underline and bold letter. LT: Liver transplantation; OS: Overall survival; RFA: Radiofrequency ablation; RH: Repeated hepatectomy; TACE: Transarterial chemoembolization.
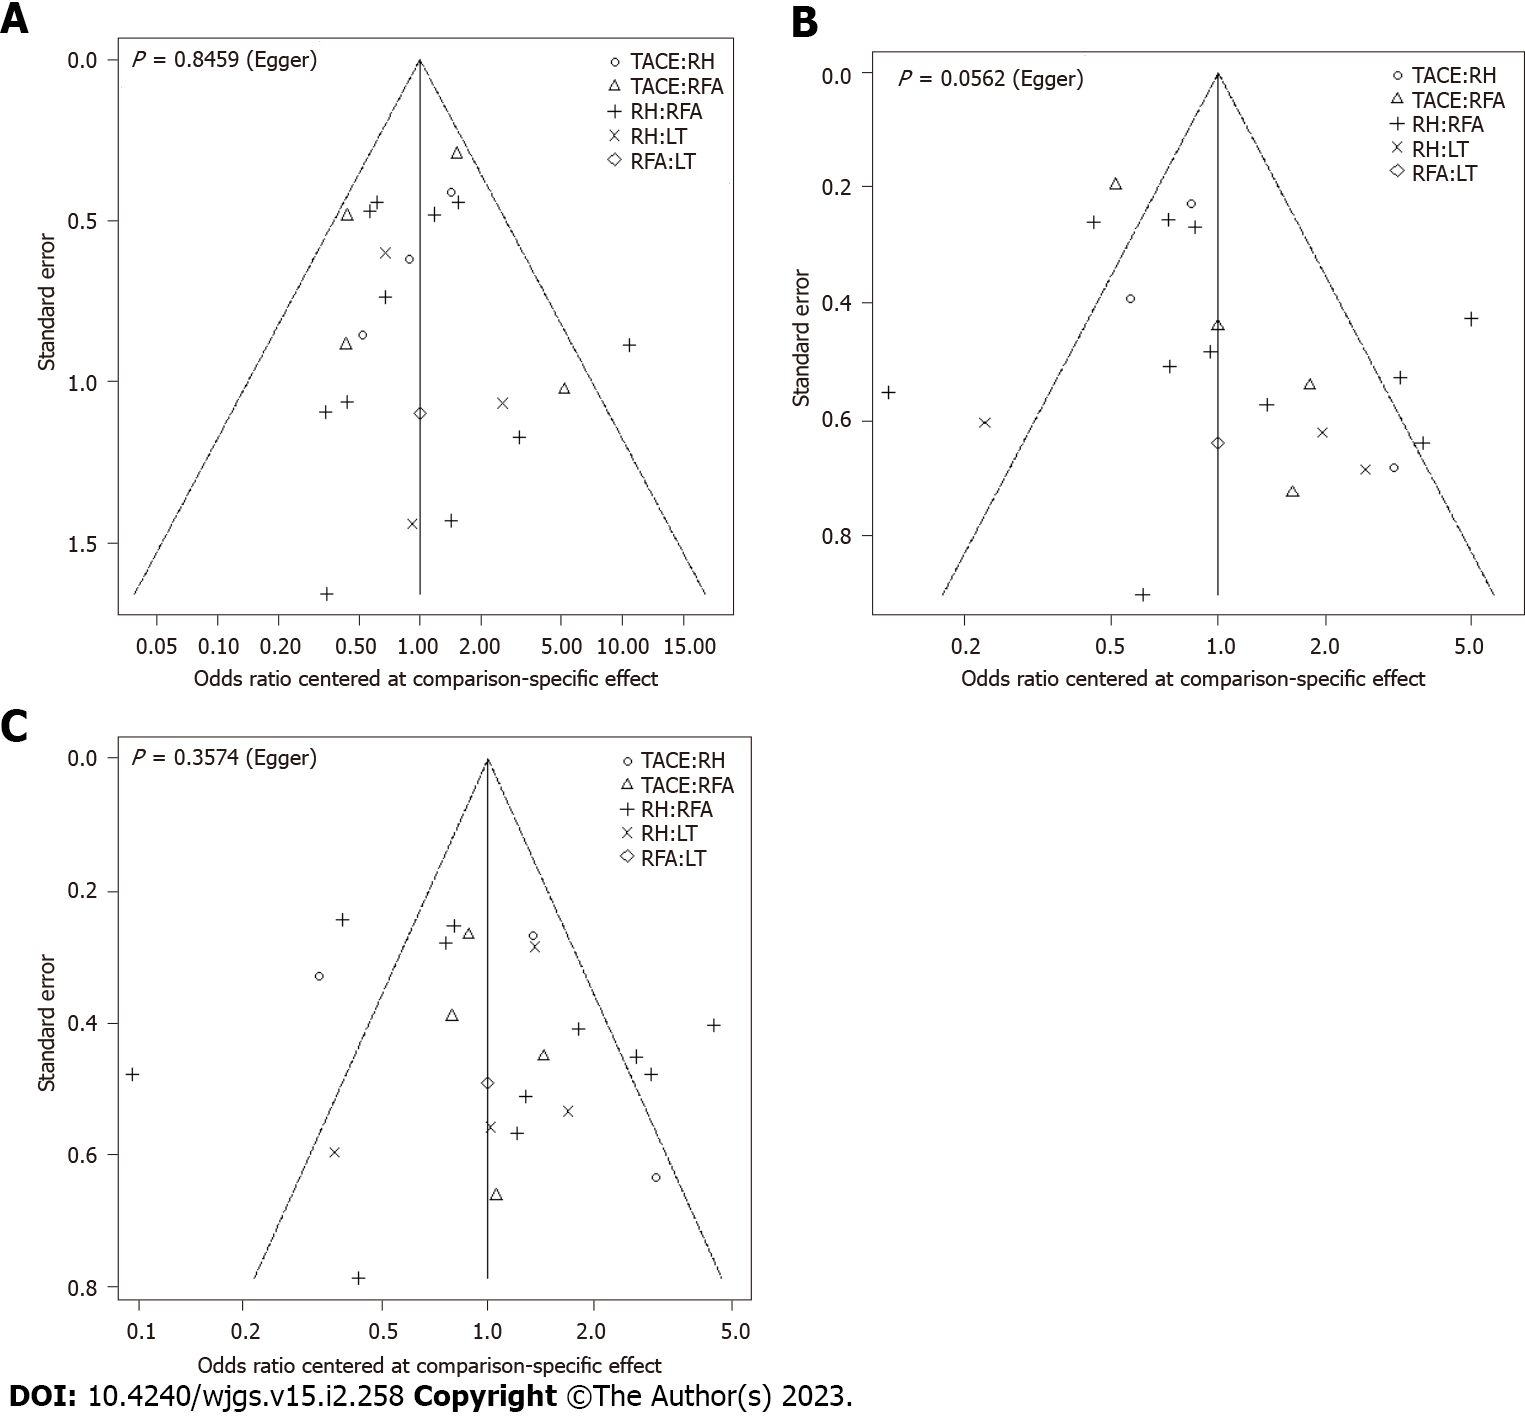
Figure 5 Publication bias measured by the comparison of the specific effect for 1-year, 3-year, and 5-year overall survival.
P > 0.05 were obtained among all studies after Egger’s regression test. A: One-year overall survival (OS); B: Three-year OS; C: Five-year OS. LT: Liver transplantation; RFA: Radiofrequency ablation; RH: Repeated hepatectomy; TACE: Transarterial chemoembolization.
- Citation: Chen JL, Chen YS, Ker CG. Network meta-analysis of the prognosis of curative treatment strategies for recurrent hepatocellular carcinoma after hepatectomy. World J Gastrointest Surg 2023; 15(2): 258-272
- URL: https://www.wjgnet.com/1948-9366/full/v15/i2/258.htm
- DOI: https://dx.doi.org/10.4240/wjgs.v15.i2.258


