Copyright
©The Author(s) 2023.
World J Gastrointest Surg. Dec 27, 2023; 15(12): 2945-2953
Published online Dec 27, 2023. doi: 10.4240/wjgs.v15.i12.2945
Published online Dec 27, 2023. doi: 10.4240/wjgs.v15.i12.2945
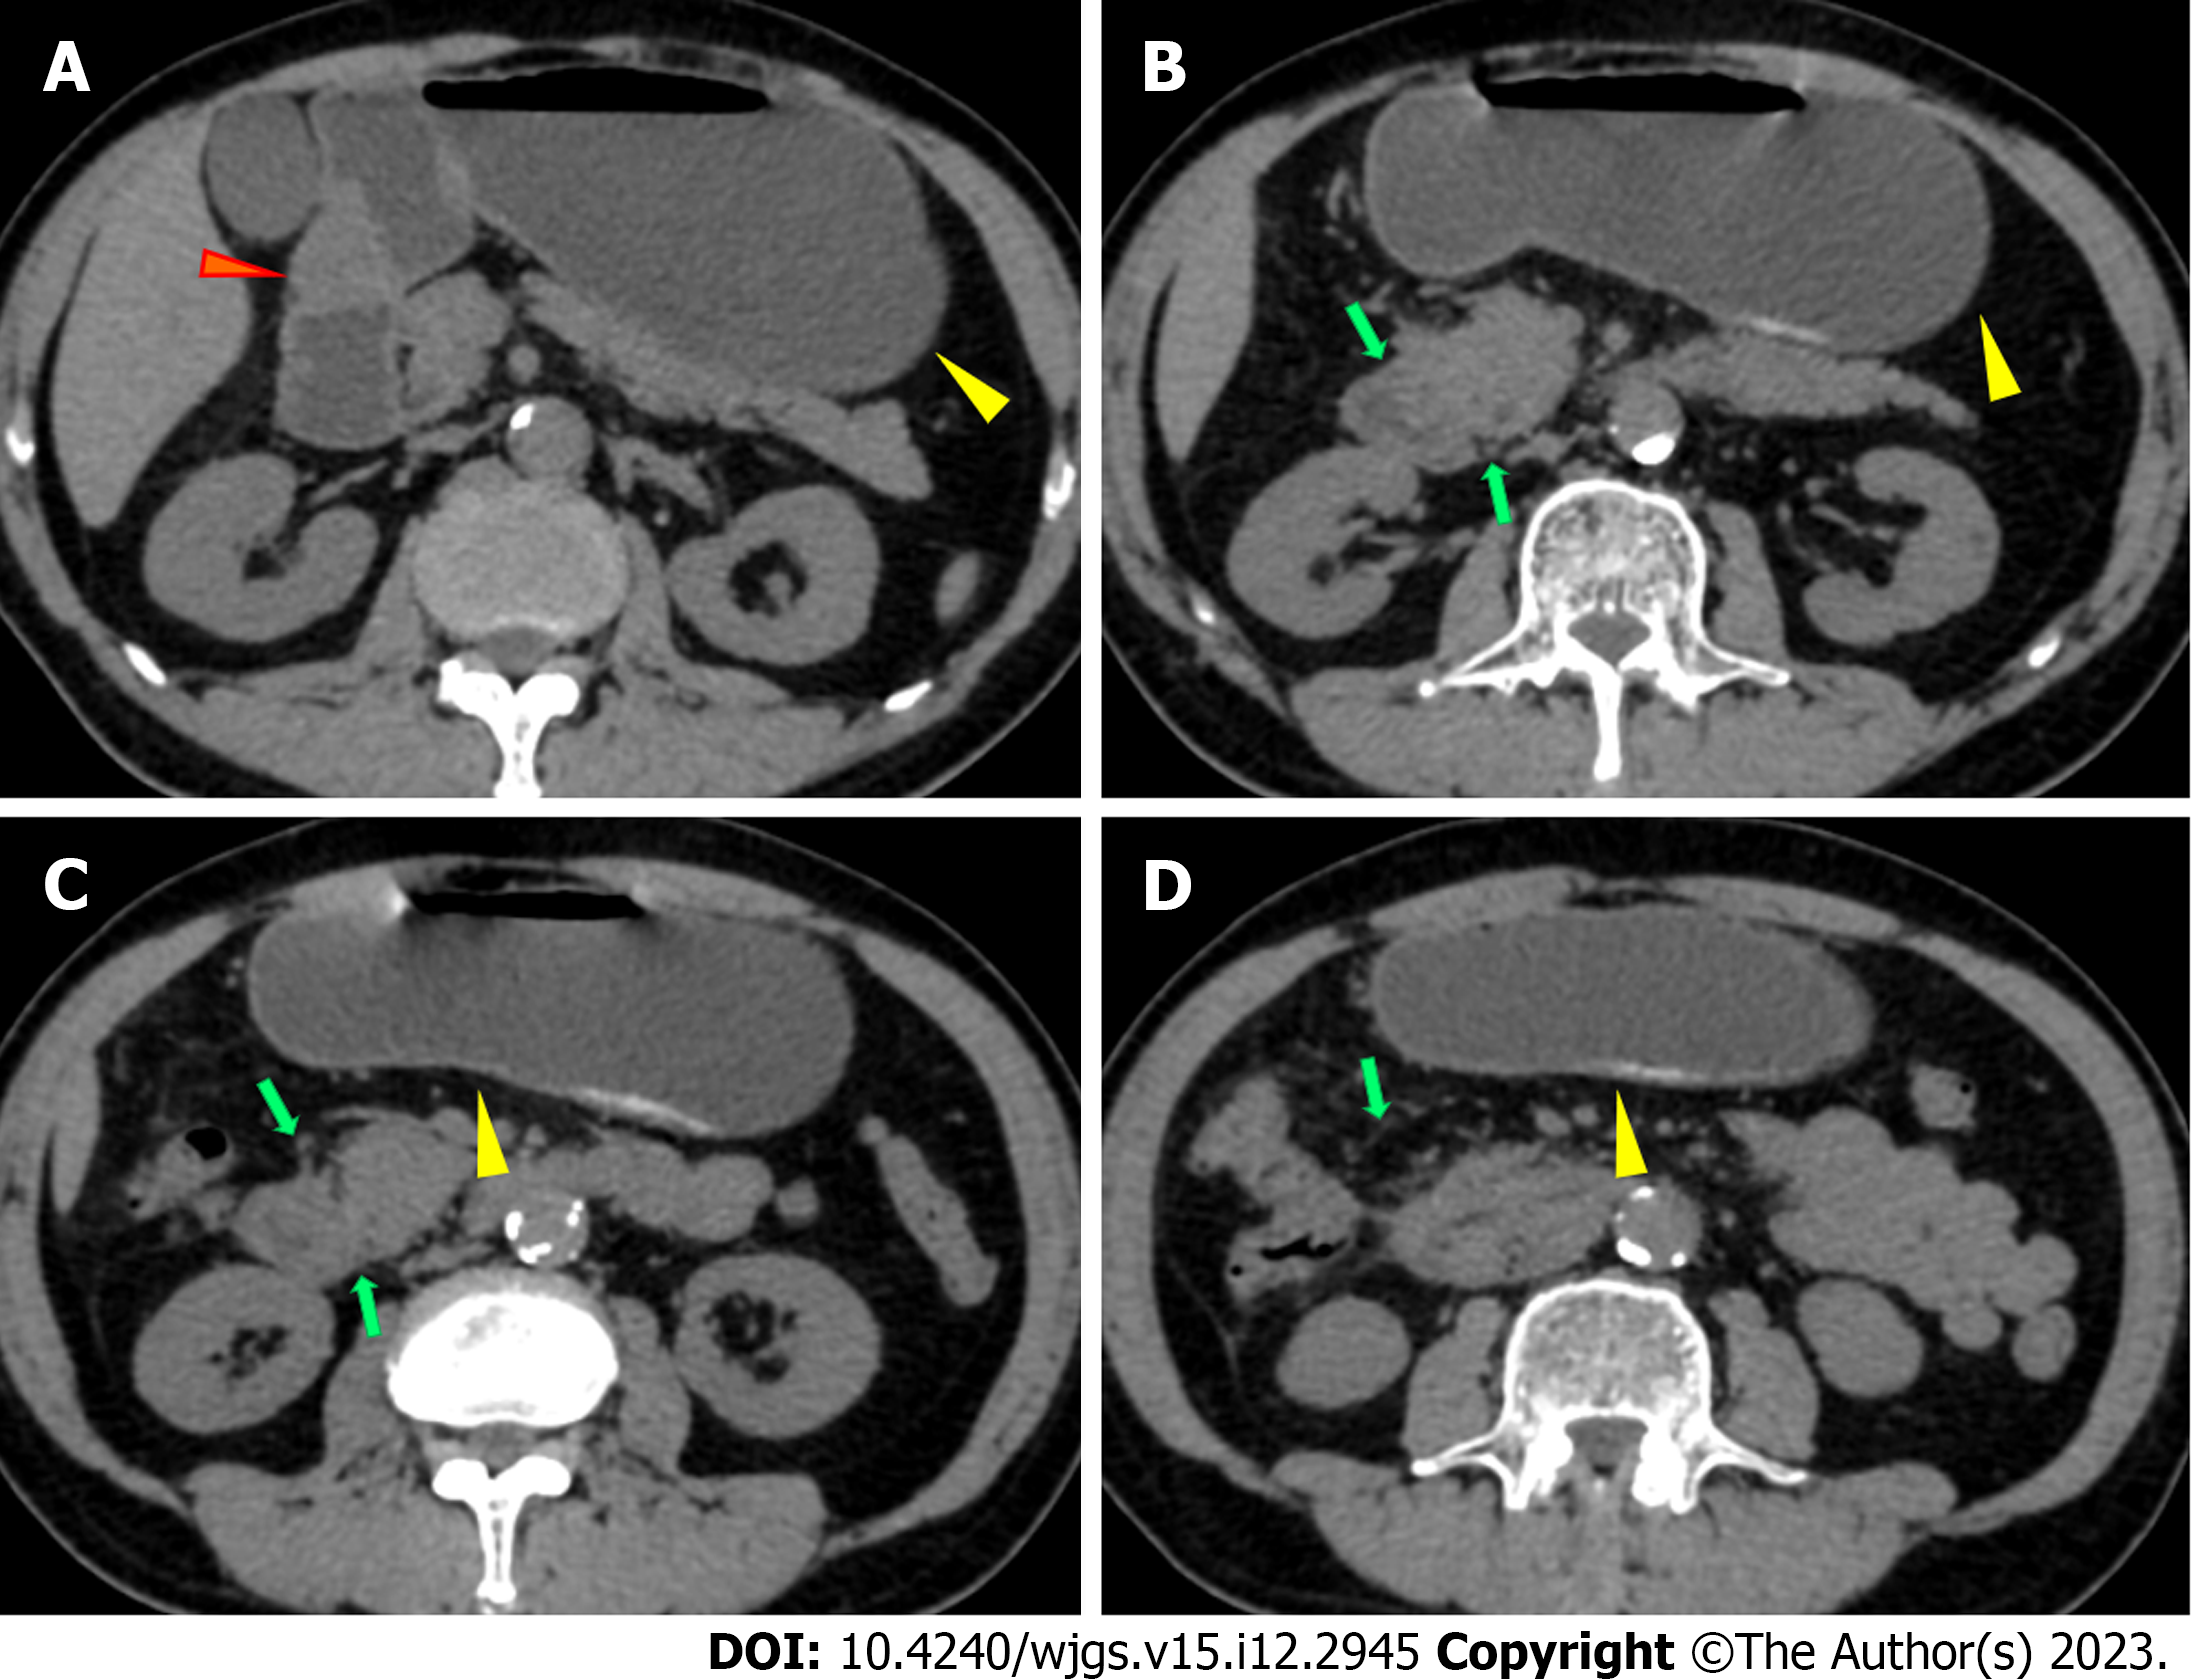
Figure 1 Abdominal plain computed tomography, axial view.
A: Abdominal plain computed tomography (CT) showed gastric retention (yellow arrow) and a nodule (35 mm × 23 mm) in the anterior wall of the pylorus (red arrow); B-D: Abdominal CT showed slight exudation in the descending and horizontal parts of the duodenum with broadening of the groove region, indicating local pancreatitis around the pancreatic head (green arrows) and gastric retention (yellow arrows).
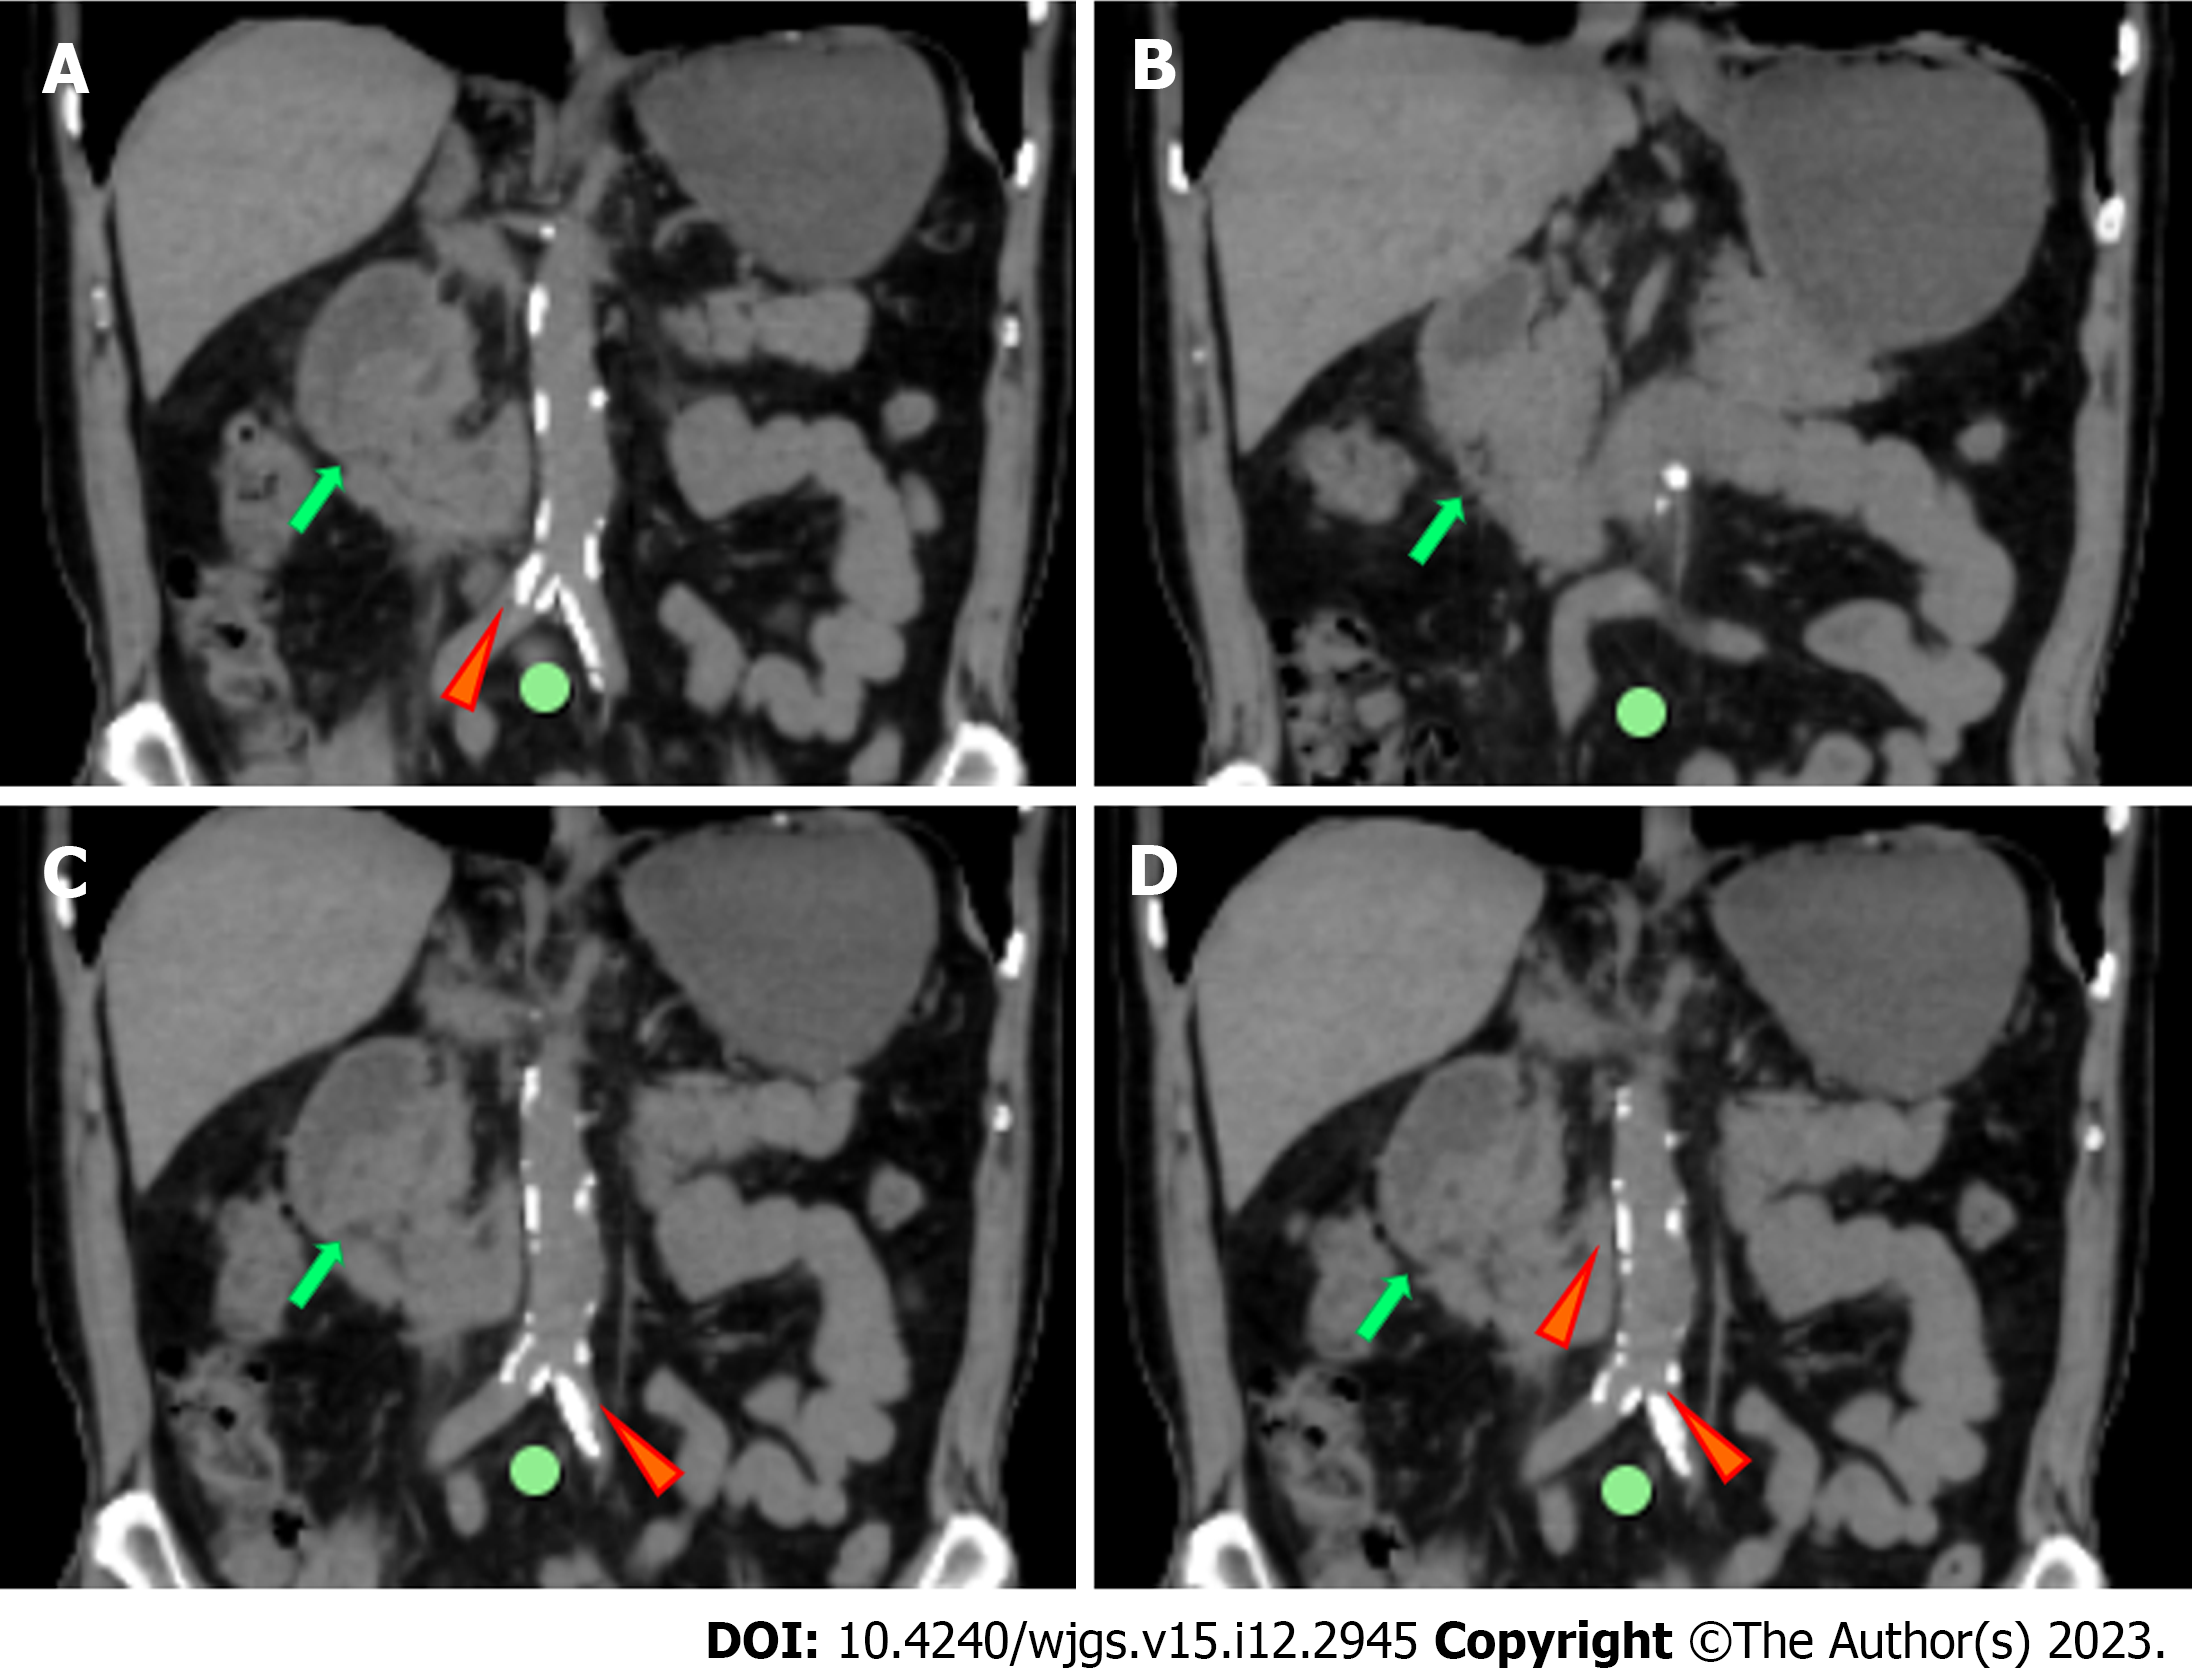
Figure 2 Abdominal plain computed tomography, coronal view.
A-D: An irregular nodule was found in the descending part of the duodenum with no clear demarcation (green arrows); A, C and D: Images showed abdominal aortic wall calcification (red arrows) and partial calcified endometrium inward migration.
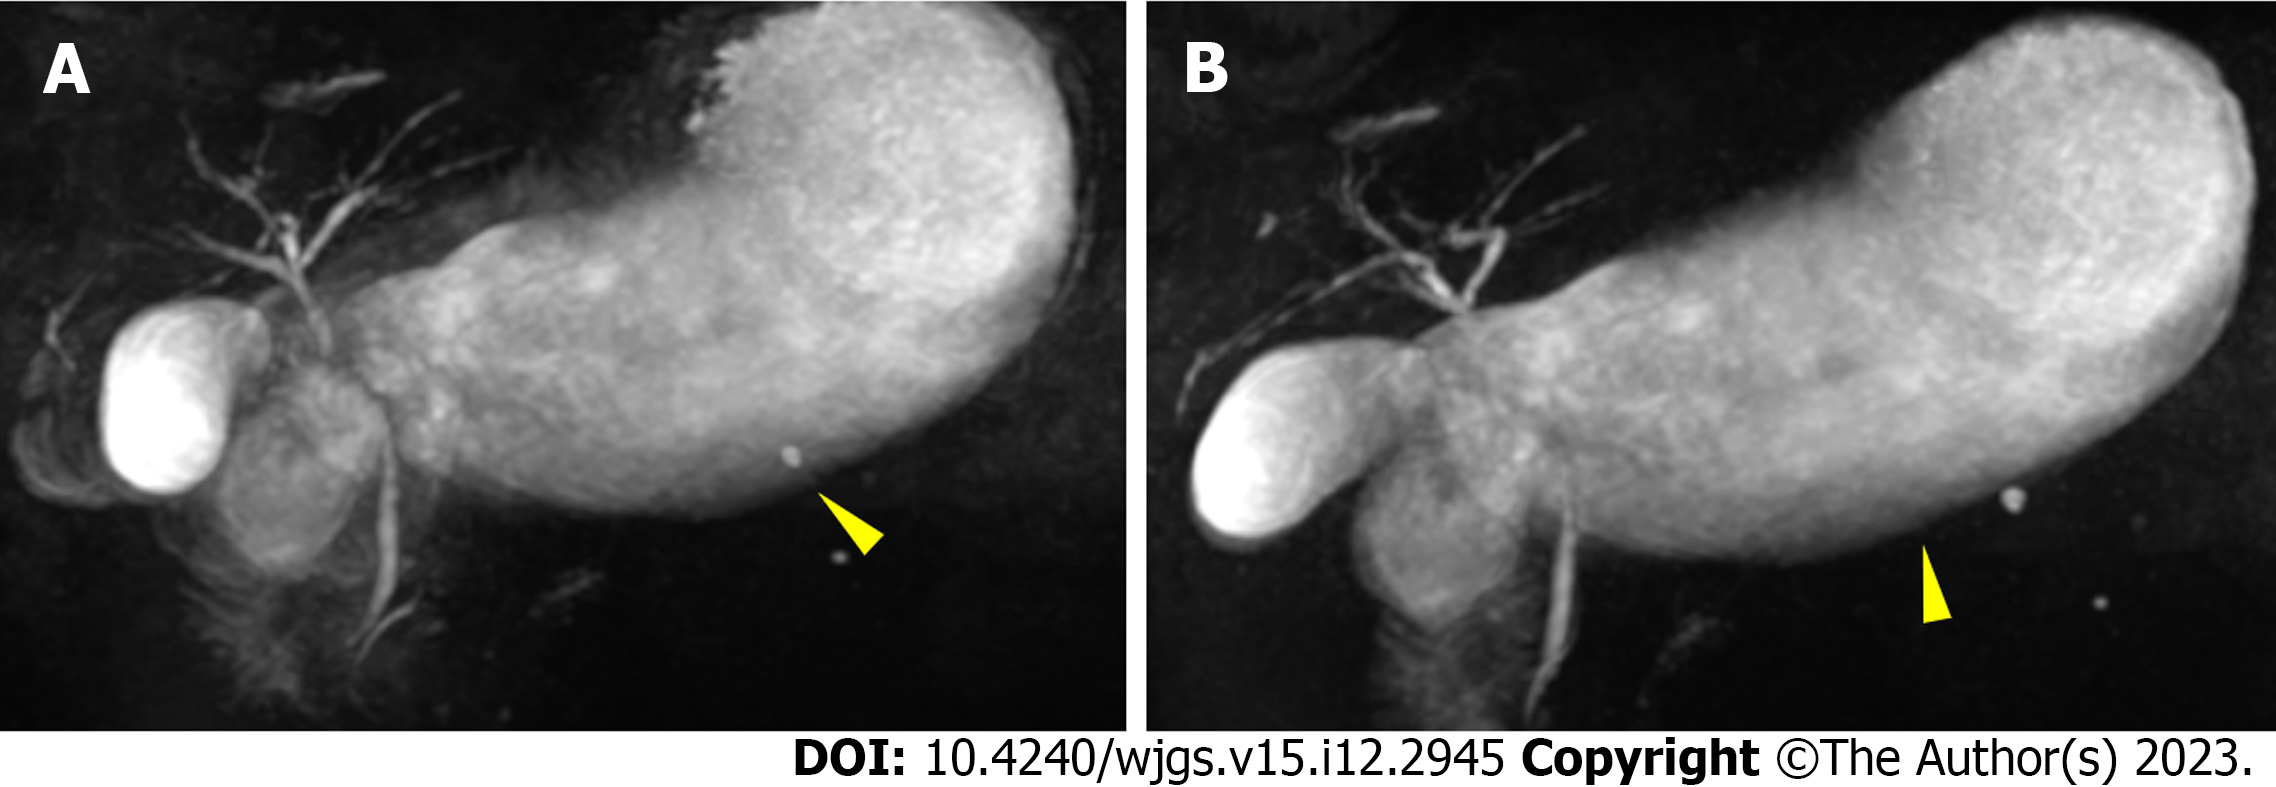
Figure 3 Magnetic resonance cholangiopancreatography.
A and B: Images showed a normal bile duct and pancreatic duct and gastric retention (yellow arrows).
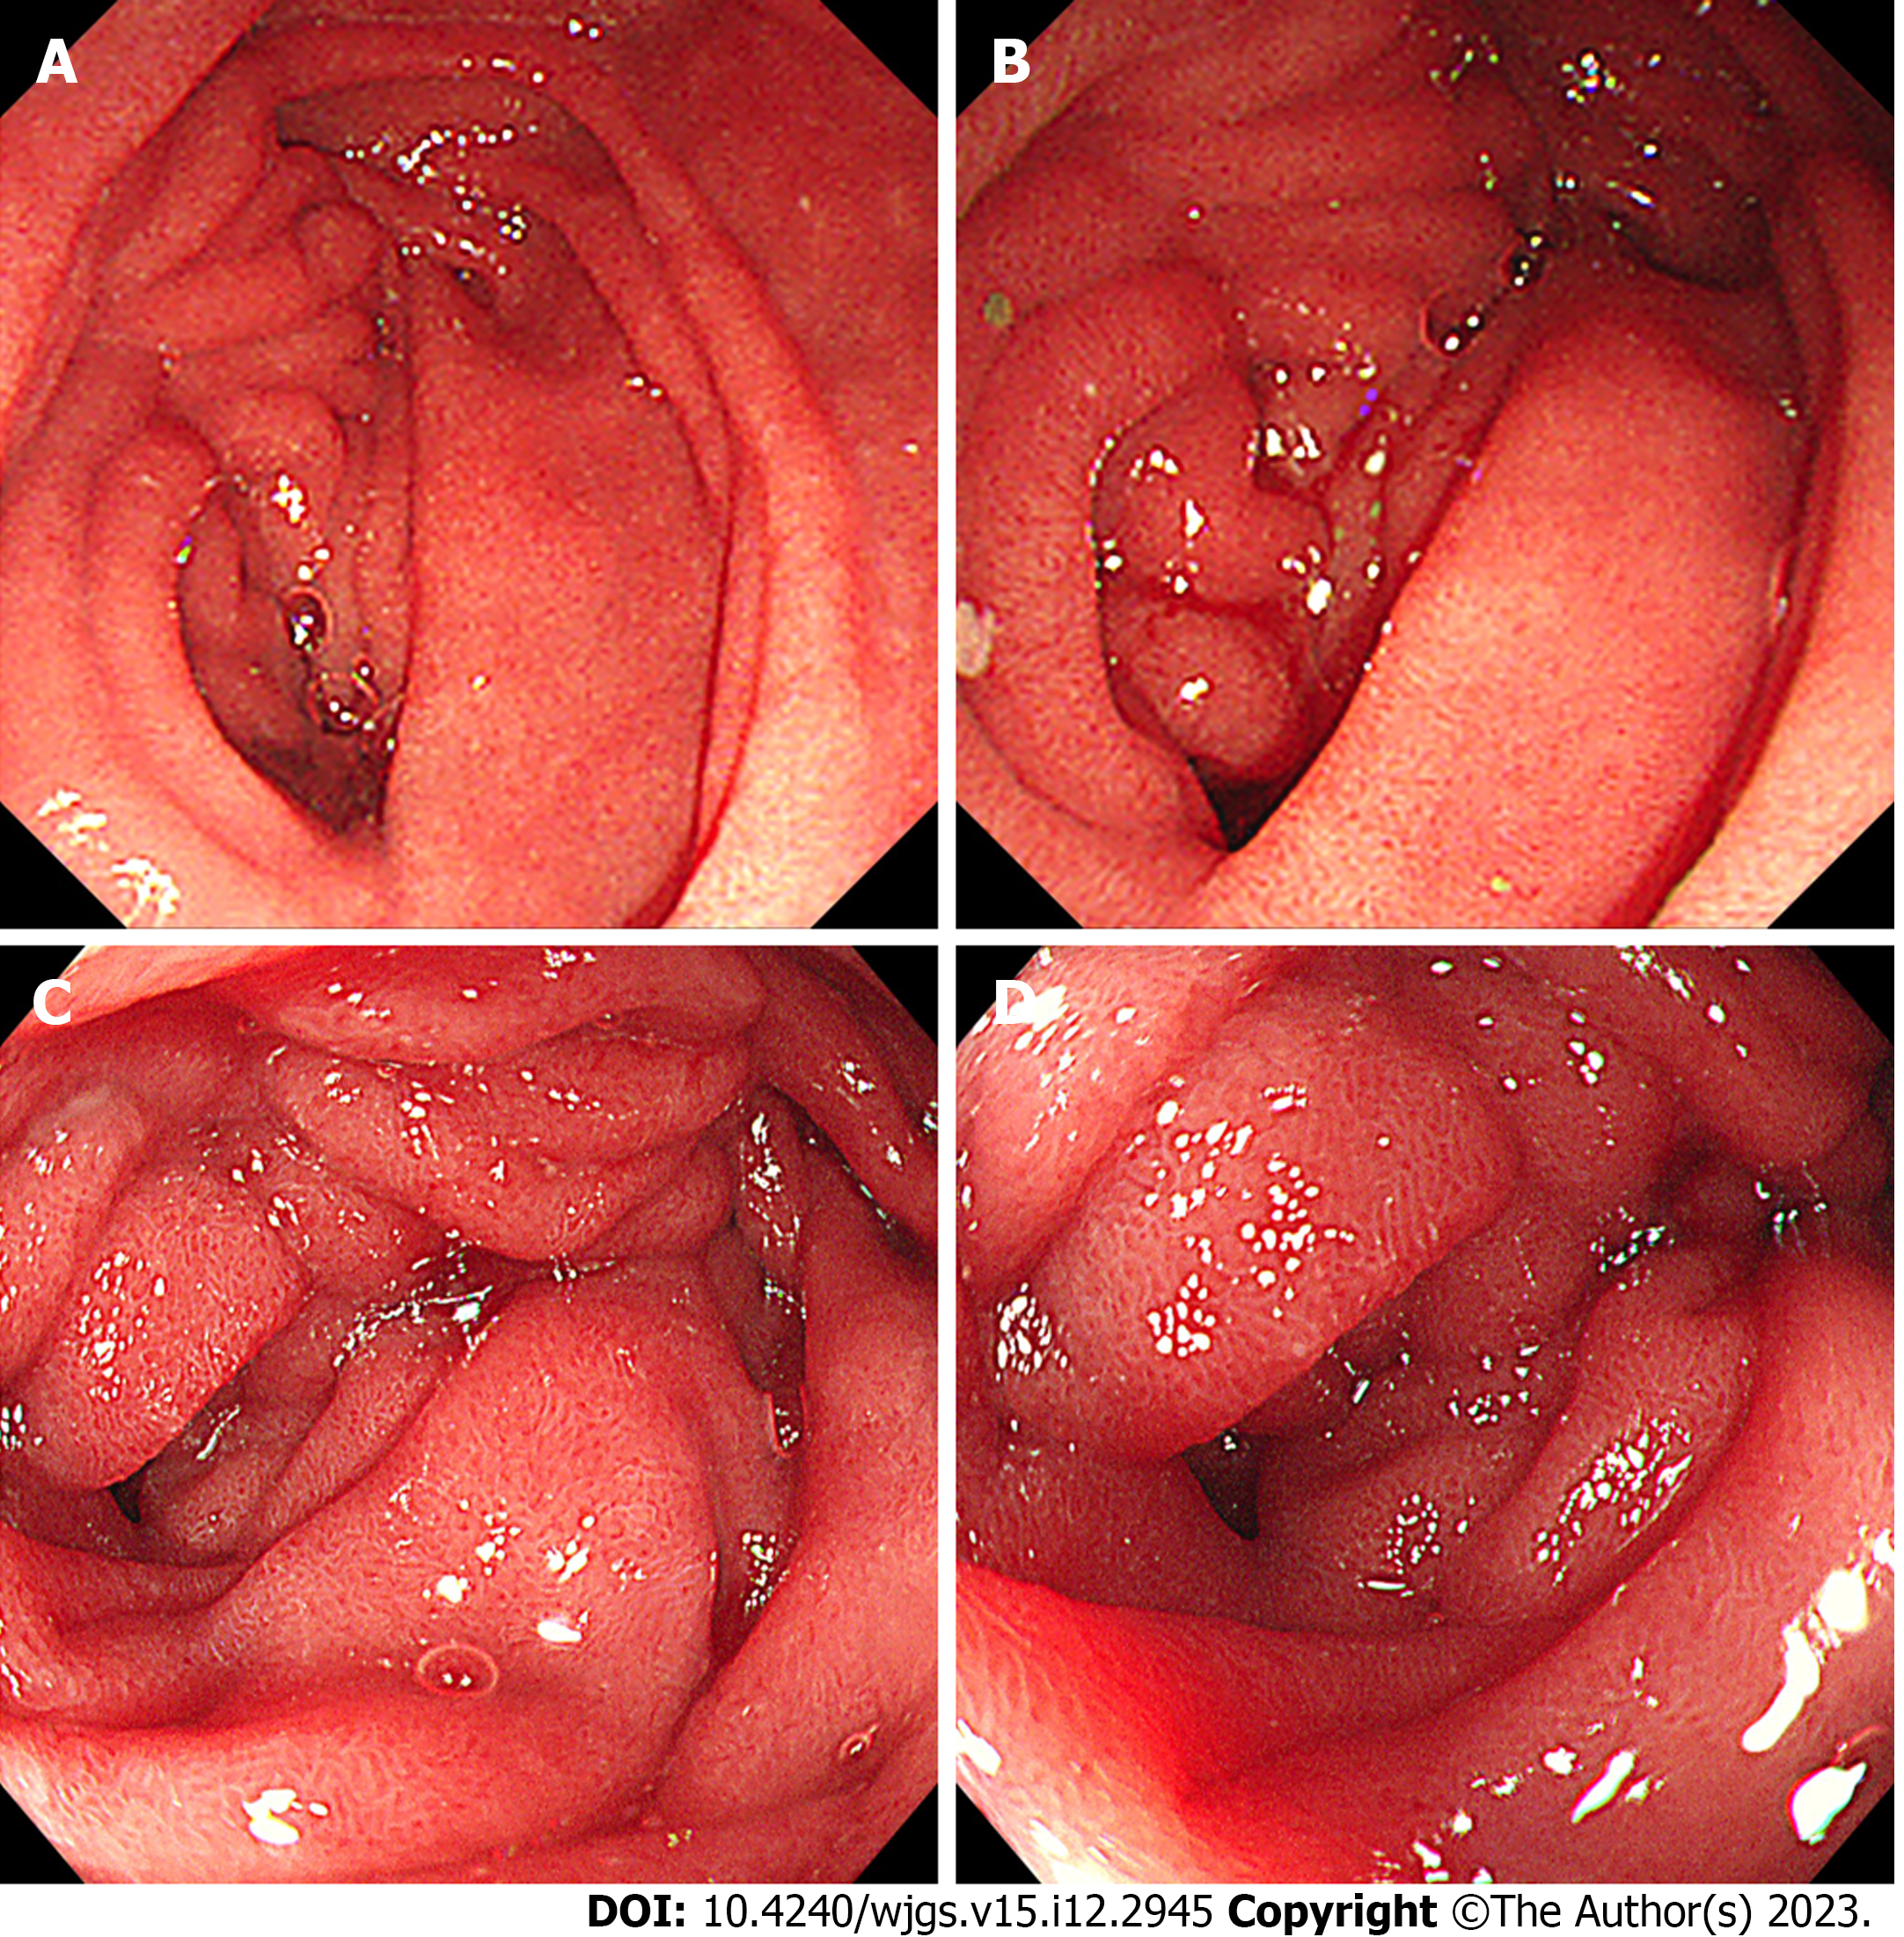
Figure 4 Upper gastrointestinal endoscopy.
A-D: The descending part of the duodenum showed slight edema and obvious luminal stenosis.
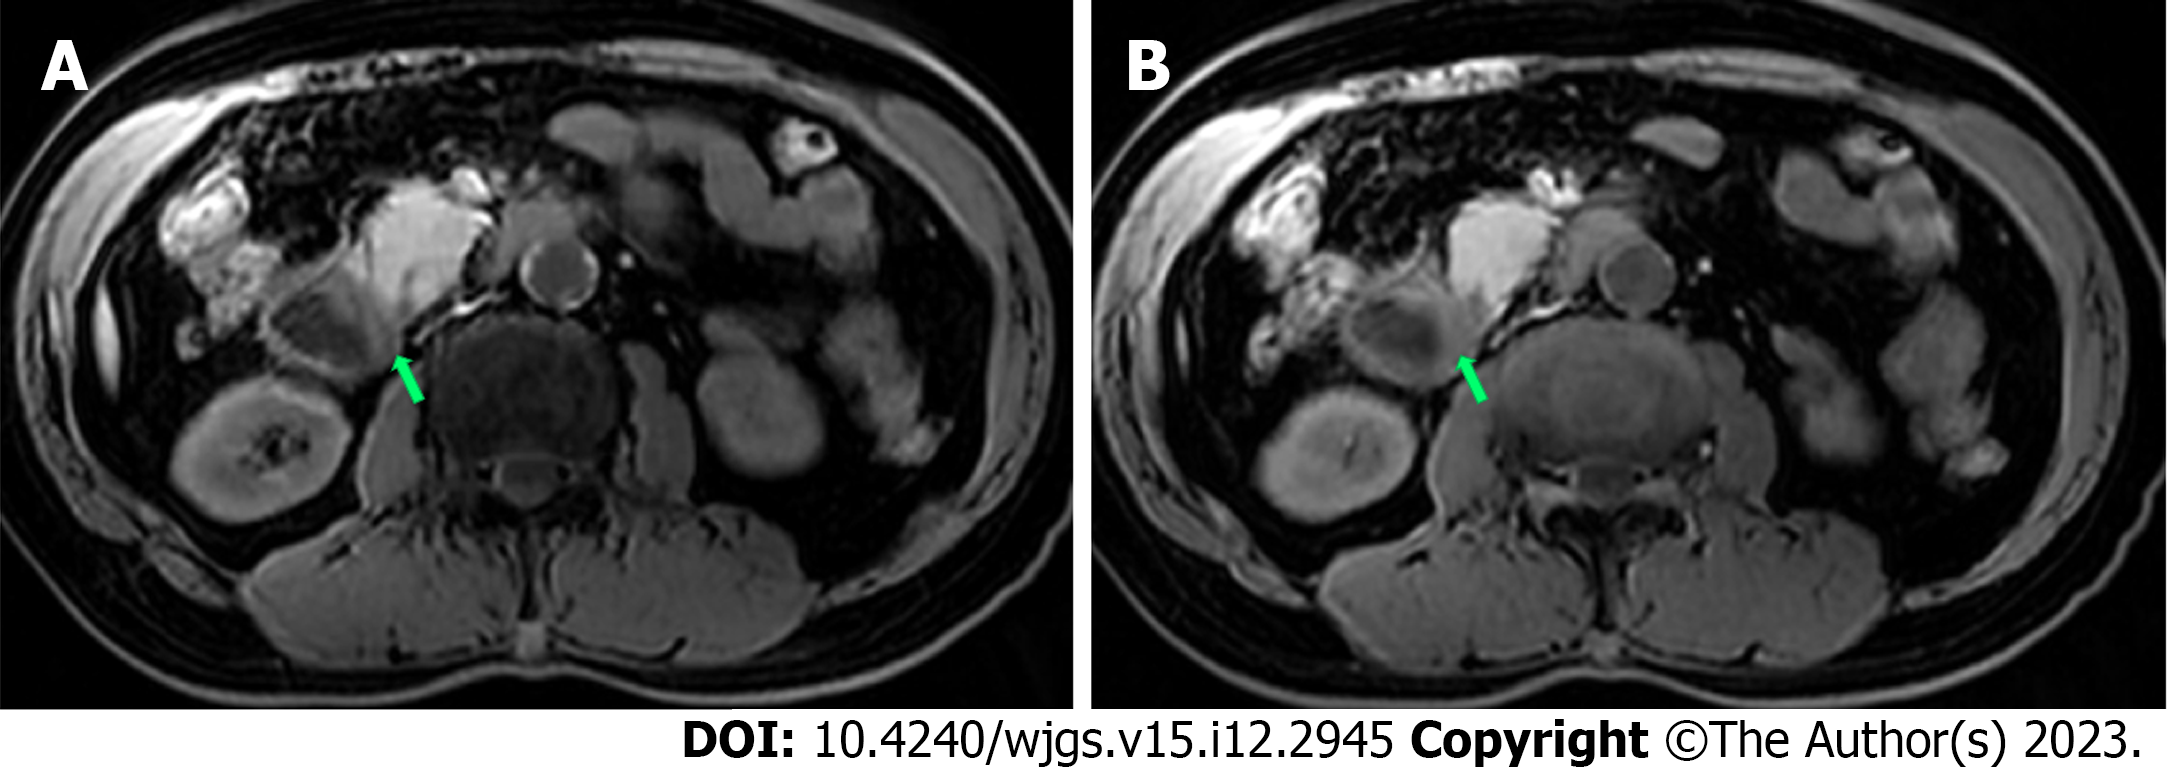
Figure 5 Magnetic resonance cholangiopancreatography.
A and B: Magnetic resonance cholangiopancreatography showed duodenal wall thickening with exudation (green arrows).
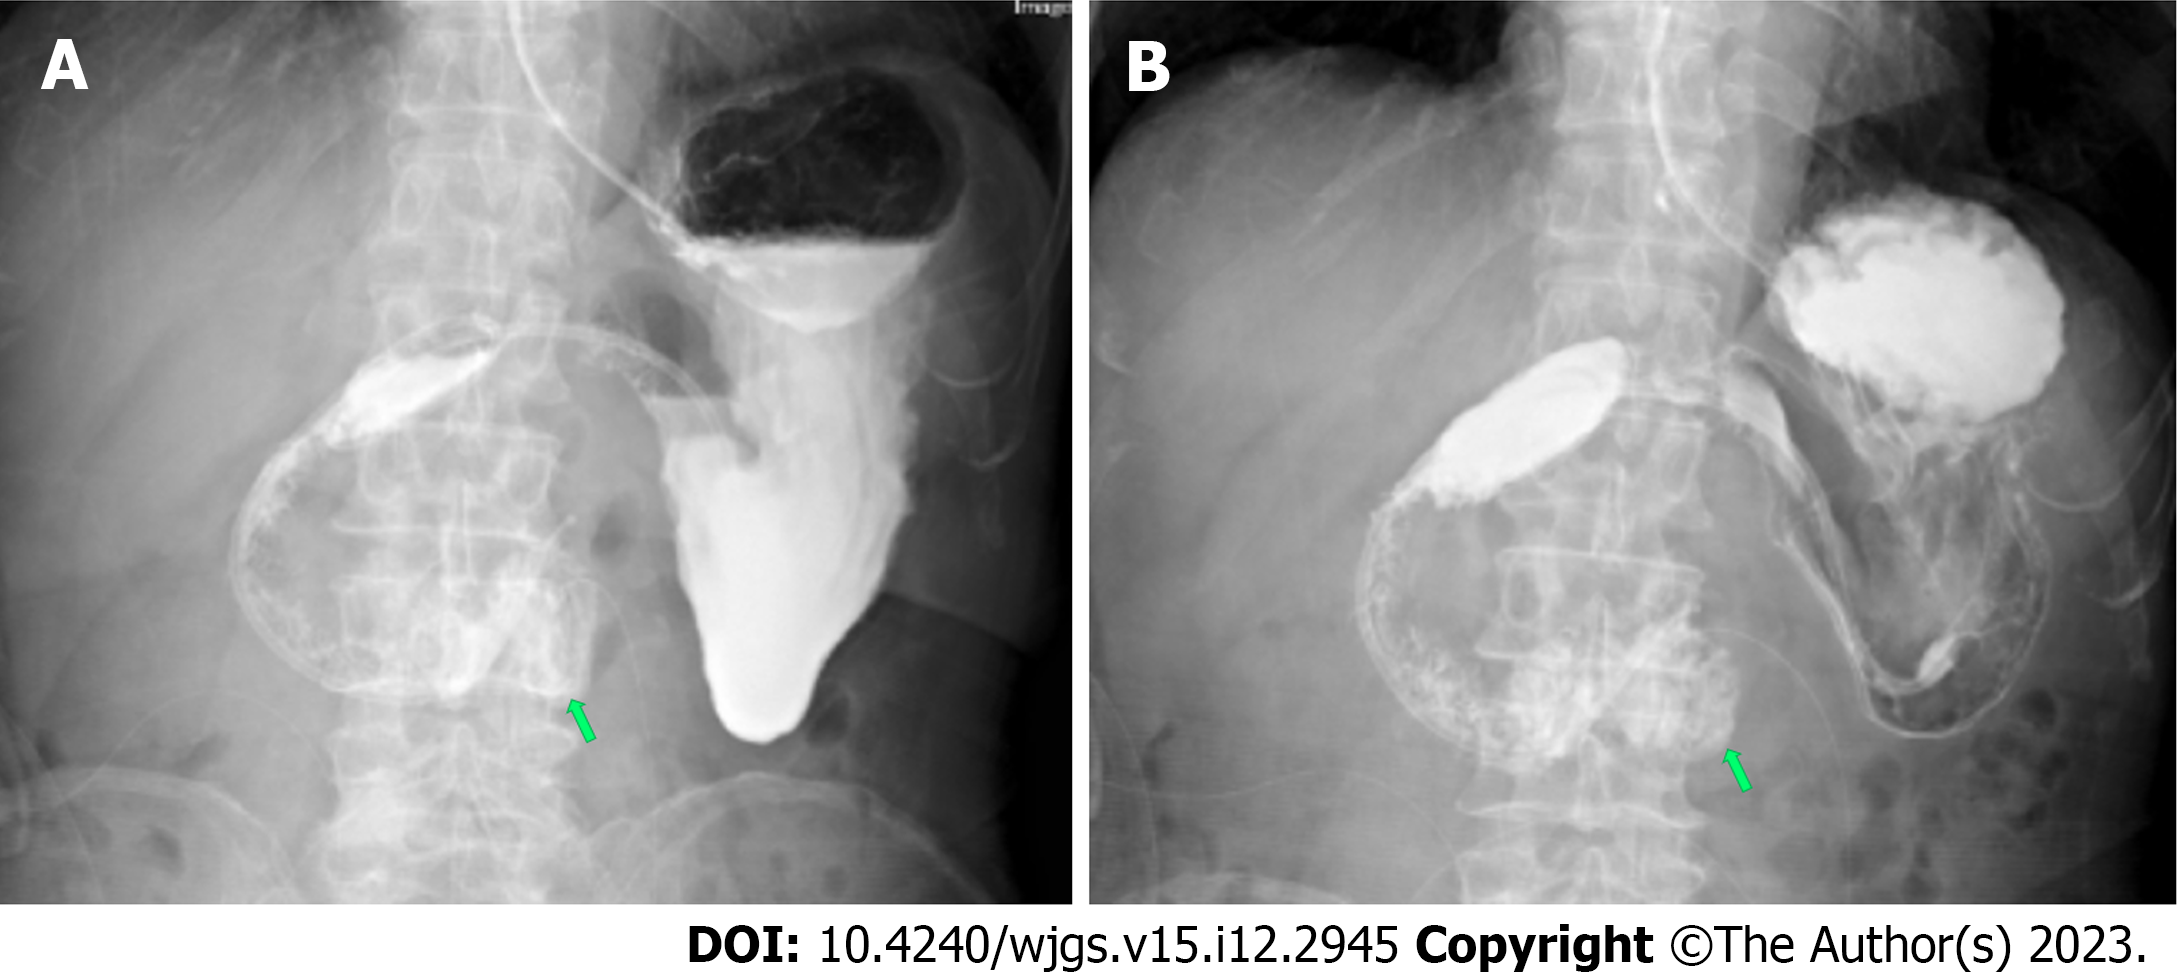
Figure 6 Postoperative iodine hydrography.
A-B: Images showed obstruction of the anastomotic stoma (green arrows) and no visualization of the distal small intestine and colon.
Figure 7 Postoperative upper gastrointestinal endoscopy.
A and B: Images showed congestion of the anastomotic stoma (green arrows); C and D: Images showed stenosis of the efferent loop (yellow arrows).
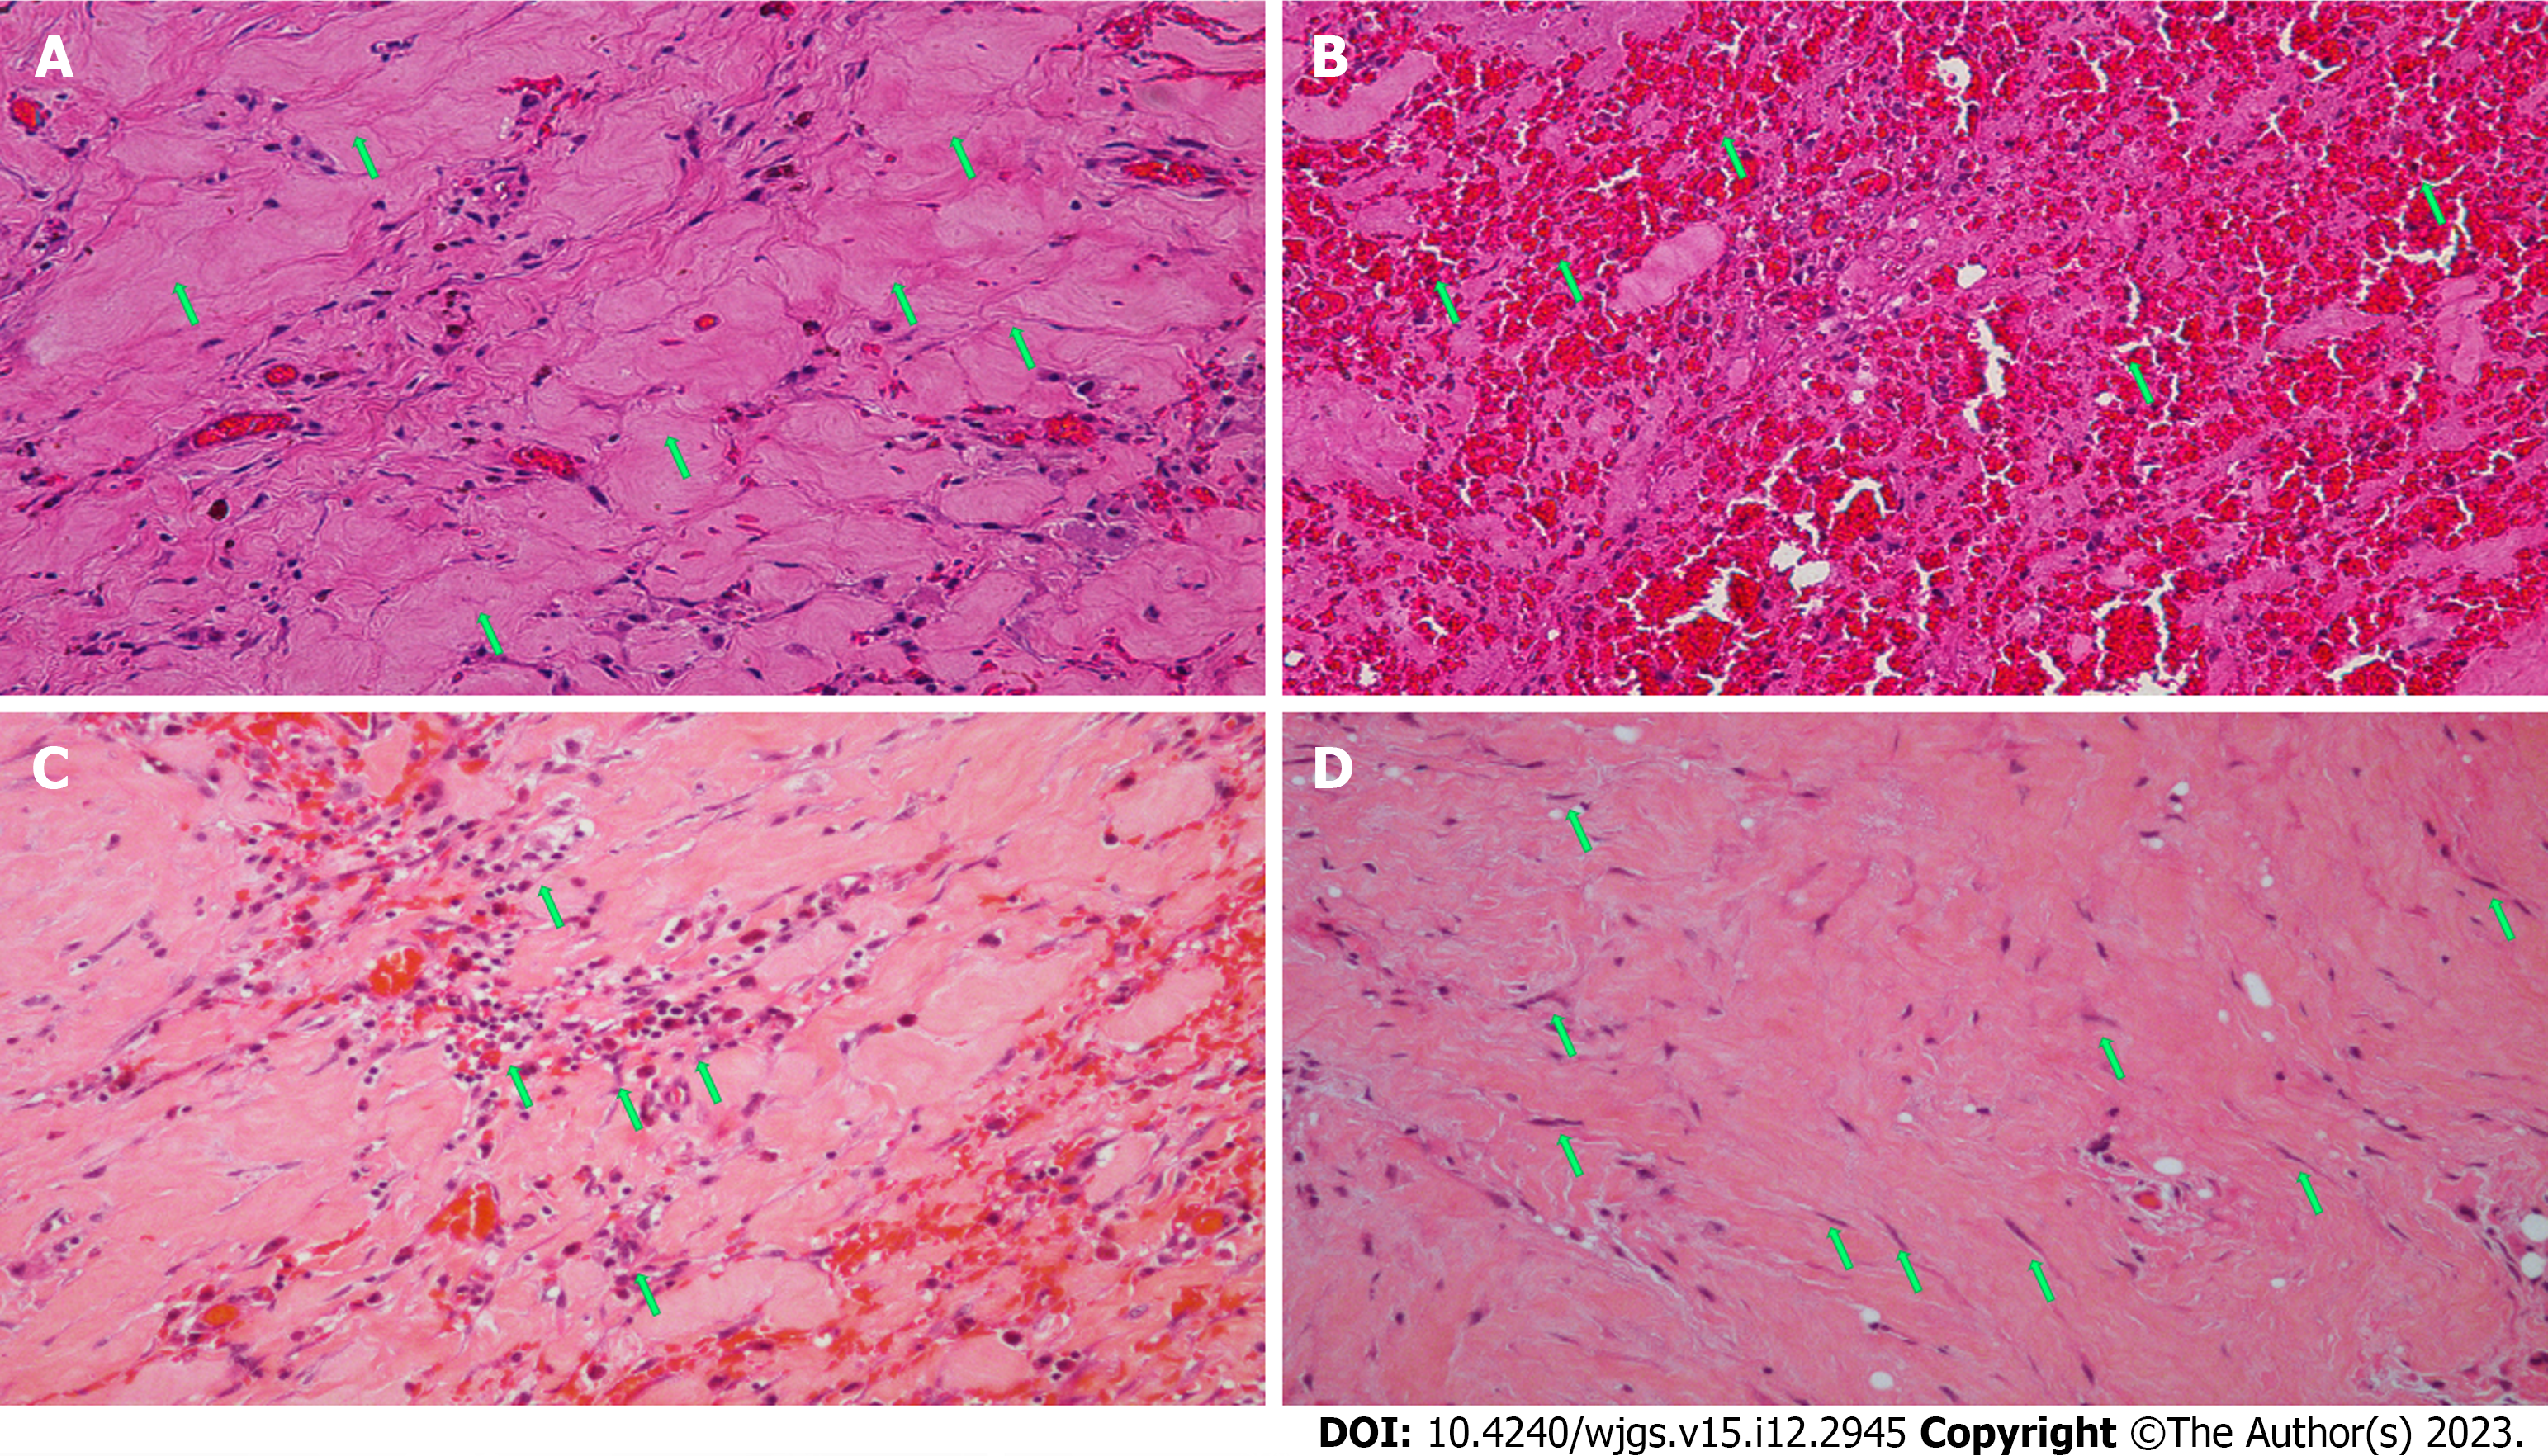
Figure 8 Histopathological findings of the intraoperative biopsy (hematoxylin and eosin; 20 ×).
A: Representative specimens showing massive proliferation of fibrous tissue and hyaline change (green arrows); B: Representative specimens showing interstitial hemorrhage (green arrows); C: Representative specimens showing chronic inflammatory cell infiltration (green arrows); D: Representative specimens showing proliferation of spindle cells (green arrows).
Figure 9 Postoperative iodine hydrography at 3 mo after surgery.
A-B: Images showed that iodine water could enter the jejunum (green arrows) via the horizontal part of the duodenum.
- Citation: Zhang Y, Cheng HH, Fan WJ. Duodenojejunostomy treatment of groove pancreatitis-induced stenosis and obstruction of the horizontal duodenum: A case report. World J Gastrointest Surg 2023; 15(12): 2945-2953
- URL: https://www.wjgnet.com/1948-9366/full/v15/i12/2945.htm
- DOI: https://dx.doi.org/10.4240/wjgs.v15.i12.2945


