Copyright
©The Author(s) 2023.
World J Gastrointest Surg. Dec 27, 2023; 15(12): 2907-2918
Published online Dec 27, 2023. doi: 10.4240/wjgs.v15.i12.2907
Published online Dec 27, 2023. doi: 10.4240/wjgs.v15.i12.2907
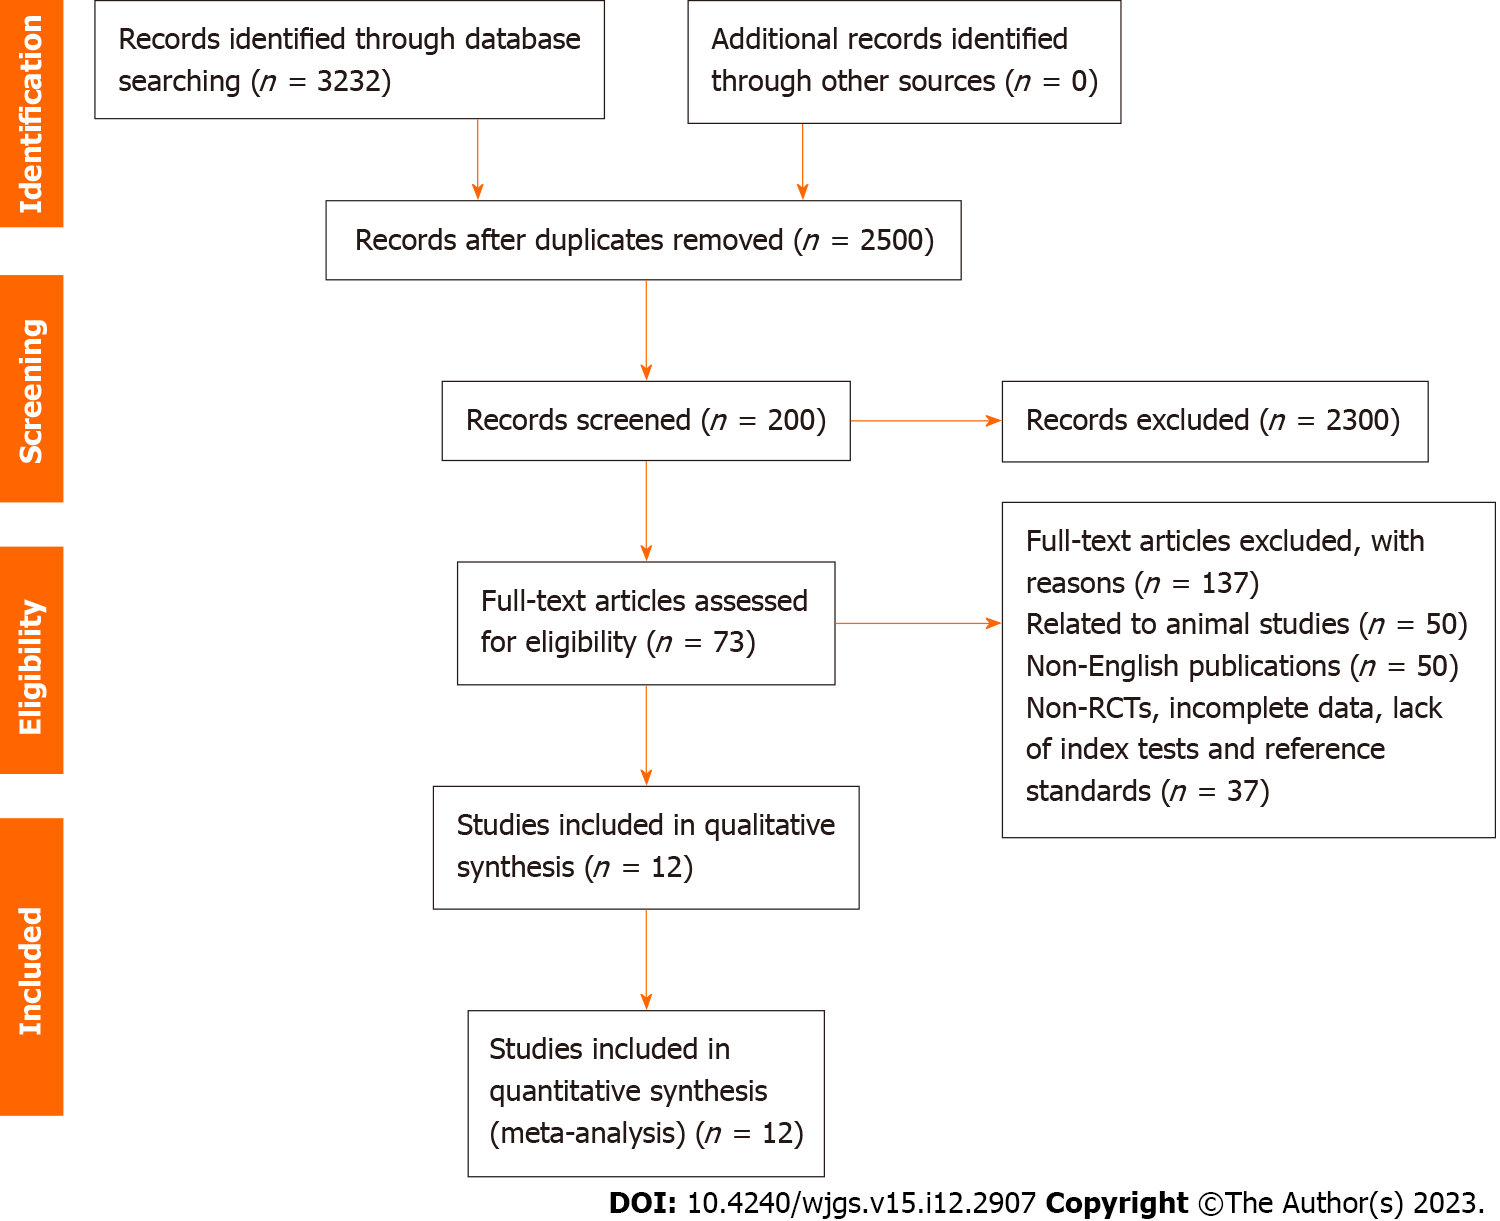
Figure 1 Preferred Reporting Items for Systematic Reviews and Meta-Analyses flow chart.
RCT: Randomized controlled trial.
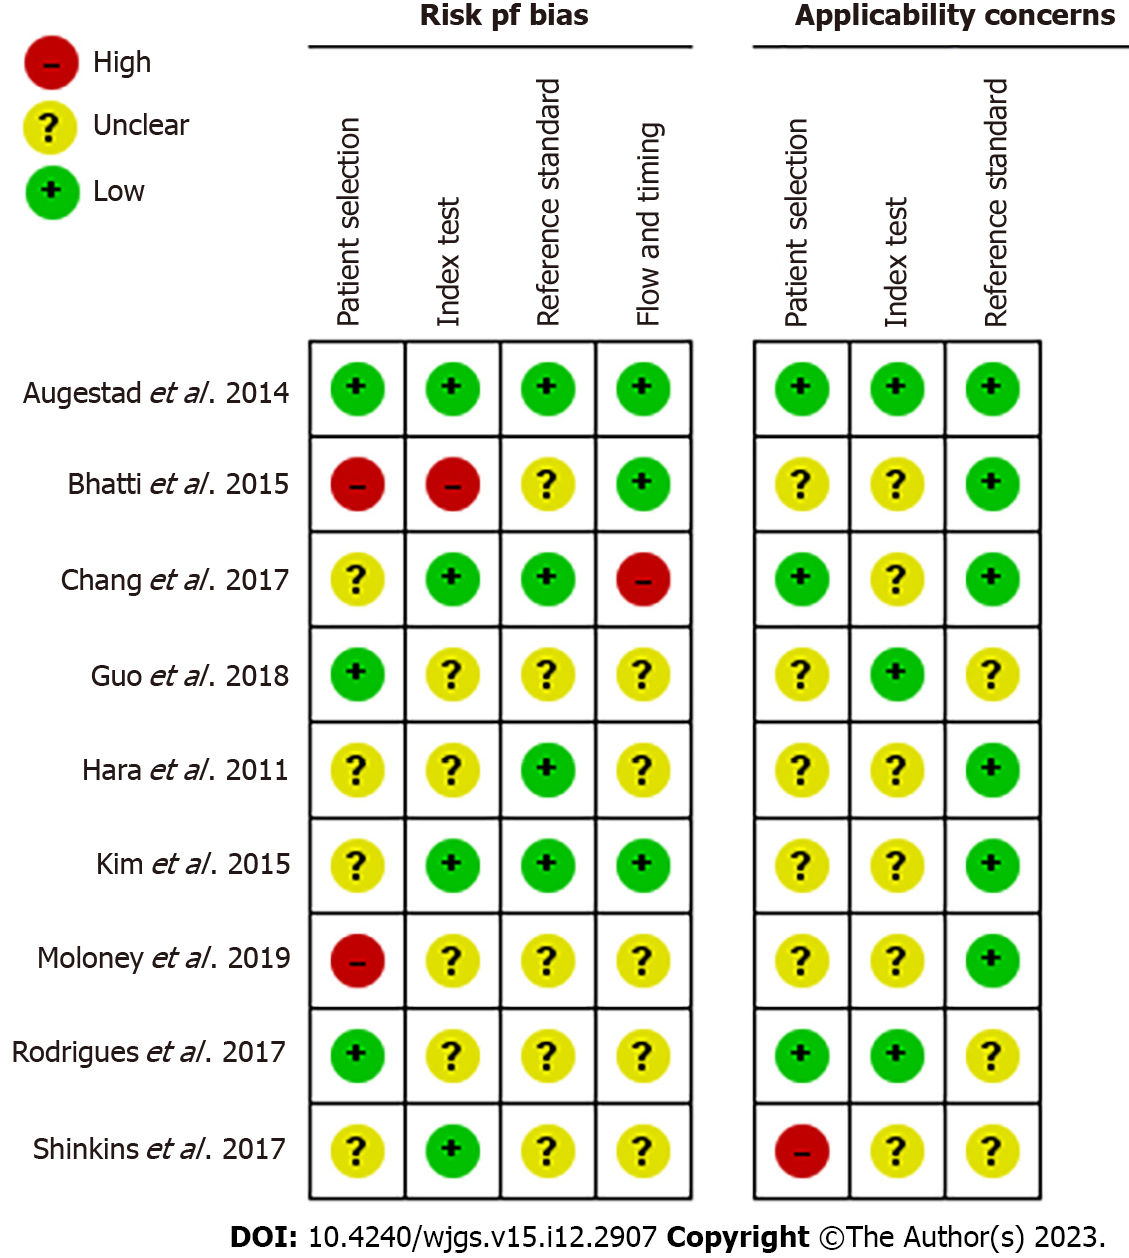
Figure 2 Risk of bias and applicability concerns of all studies.
Figure 3 Risk of bias assessment of every study.
Figure 4 Forest plot of sensitivity of carcinoembryonic antigen.
TP: True positive; FP: False positive; FN: False negative; TN: True negative; 95%CI: 95% confidence interval.
Figure 5 Forest plot of sensitivity and specificity of carcinoembryonic antigen.
TP: True positive; FP: False positive; FN: False negative; TN: True negative; 95%CI: 95% confidence interval.
Figure 6 Forest plot of the sensitivity and specificity of carcinoembryonic antigen in high-quality trials.
TP: True positive; FP: False positive; FN: False negative; TN: True negative; 95%CI: 95% confidence interval.
- Citation: Wang R, Wang Q, Li P. Significance of carcinoembryonic antigen detection in the early diagnosis of colorectal cancer: A systematic review and meta-analysis. World J Gastrointest Surg 2023; 15(12): 2907-2918
- URL: https://www.wjgnet.com/1948-9366/full/v15/i12/2907.htm
- DOI: https://dx.doi.org/10.4240/wjgs.v15.i12.2907


