Copyright
©The Author(s) 2023.
World J Gastrointest Surg. Dec 27, 2023; 15(12): 2844-2854
Published online Dec 27, 2023. doi: 10.4240/wjgs.v15.i12.2844
Published online Dec 27, 2023. doi: 10.4240/wjgs.v15.i12.2844
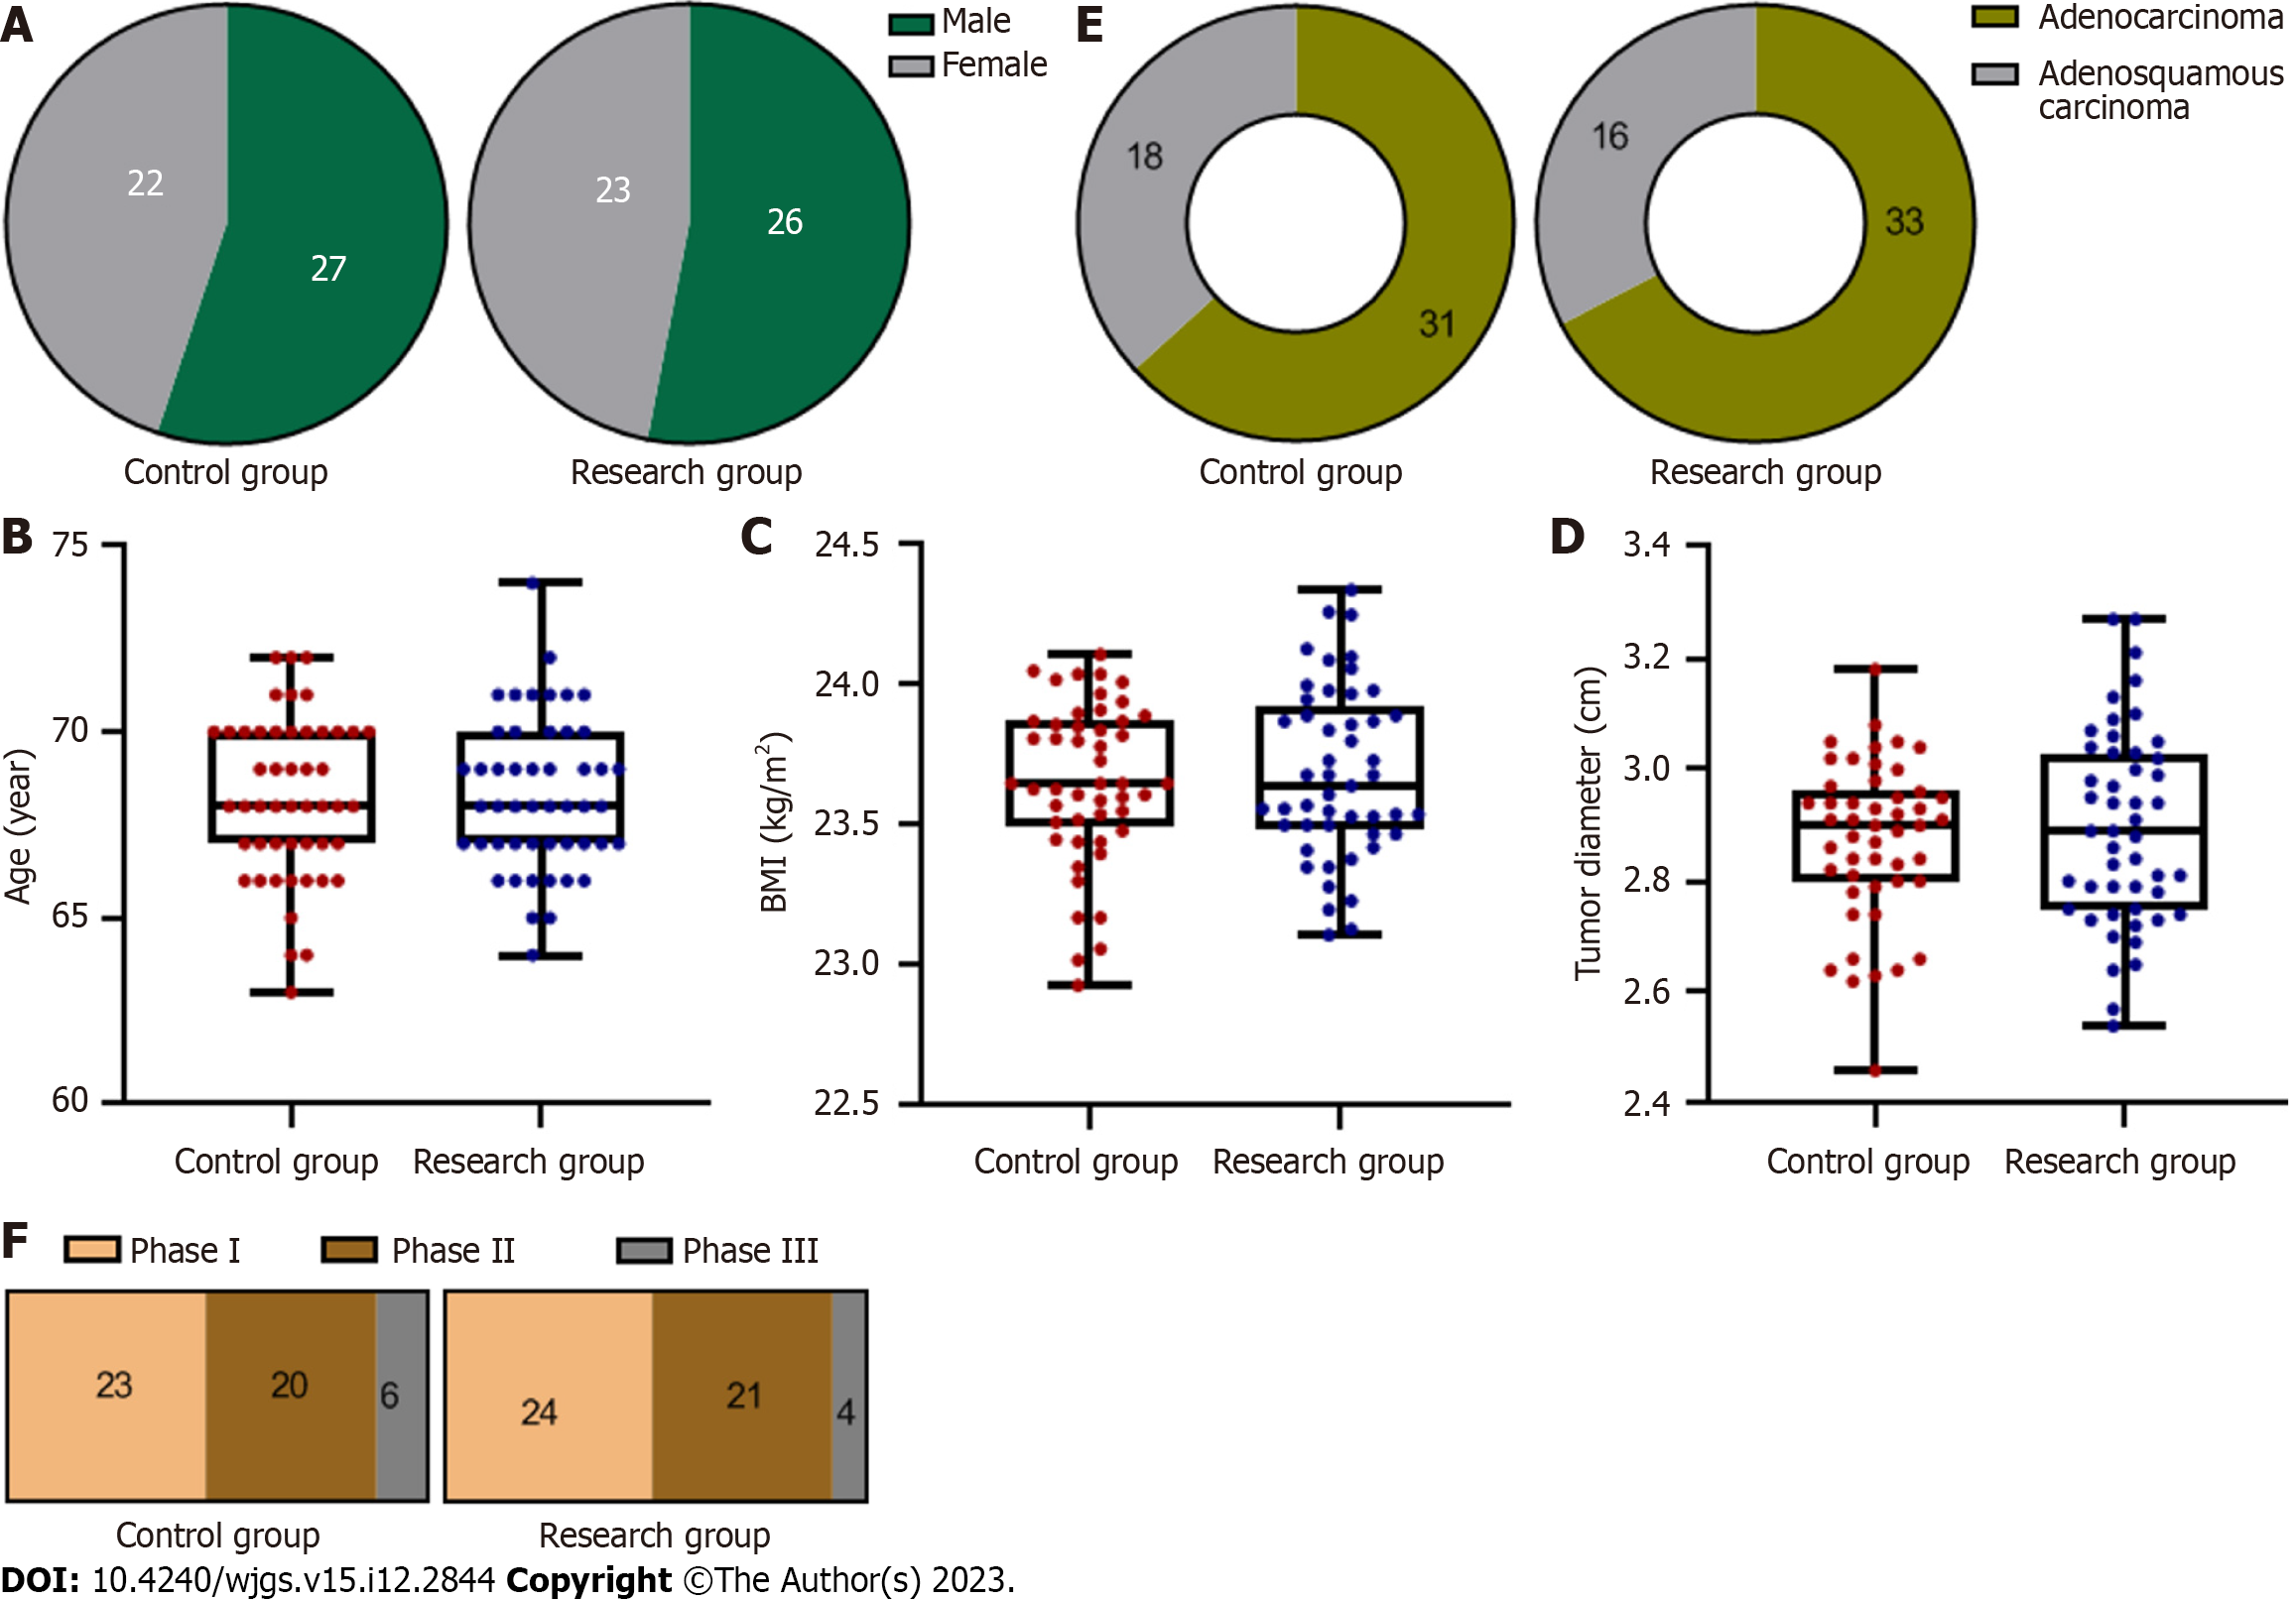
Figure 1 Summary of patients’ general clinical data (n = 49).
A: Comparison of gender between the two groups; B: Comparison of age between the two groups; C: Comparison of body mass index between the two groups; D: Comparison of tumour diameter between the two groups; E: Comparison of pathological type between the two groups; F: Comparison of pathological stage between the two groups. BMI: Body mass index.
Figure 2 Recovery of gastrointestinal function in both groups after nursing intervention (n = 49).
A: Comparison of the recovery time of bowel sounds between the two groups; B: Comparison of the time of anal defecation between the two groups; C: Comparison of the time of defecation between the two groups. aP < 0.05 compared with the control group.
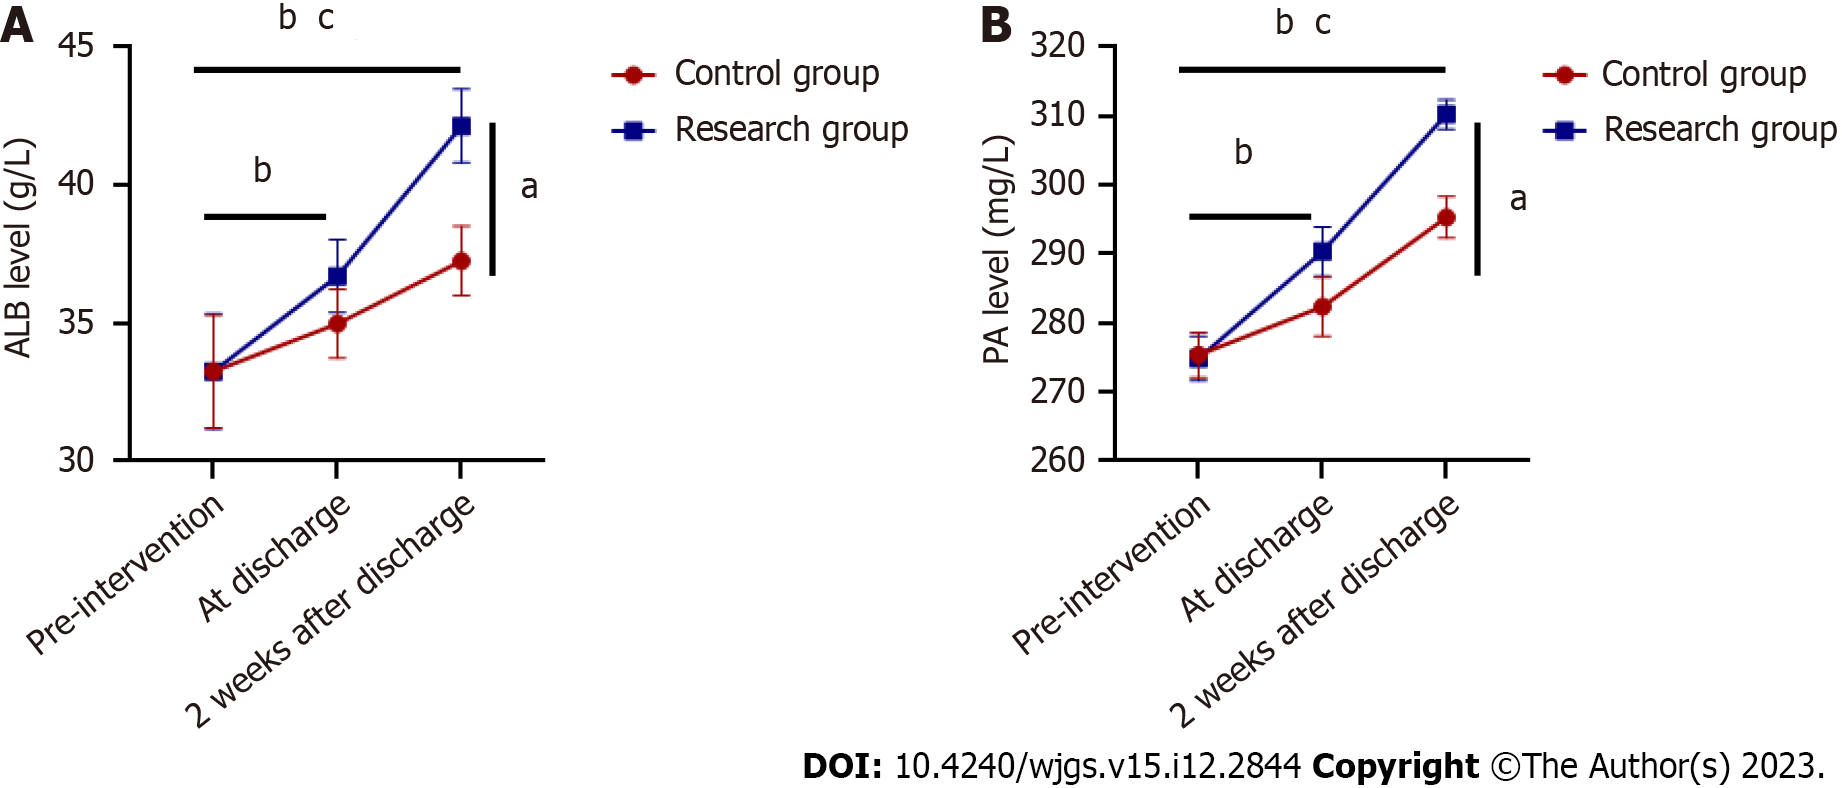
Figure 3 Comparison of biochemical indicators between the two groups of patients (n = 49).
A: Comparison of albumin between the two groups; B: Comparison of prealbumin between the two groups. aP < 0.05 compared with the control group; bP < 0.05 compared with the same group before intervention; cP < 0.05 compared with the same group at discharge. ALB: Albumin; PA: Prealbumin.
Figure 4 Comparison of psychological status of patients in two groups (n = 49).
A: Comparison of Hamilton Anxiety Scale scores between the two groups; B: Comparison of Hamilton Depression Scale scores between the two groups. aP < 0.05 compared with the control group; bP < 0.05 compared with the same group before intervention; cP < 0.05 compared with the same group at discharge. HAMA: Hamilton Anxiety Scale; HAMD: Hamilton Depression Scale.
Figure 5 Comparison of self-management and self-efficacy between the two groups (n = 49).
A: Comparison of Self-Management Scale scores between the two groups; B: Comparison of General Self-Efficacy Scale scores between the two groups. aP < 0.05 compared with the control group; bP < 0.05 compared with the same group before intervention; cP < 0.05 compared with the same group at discharge. PIH: Self-Management Scale; GSES: General Self-Efficacy Scale.
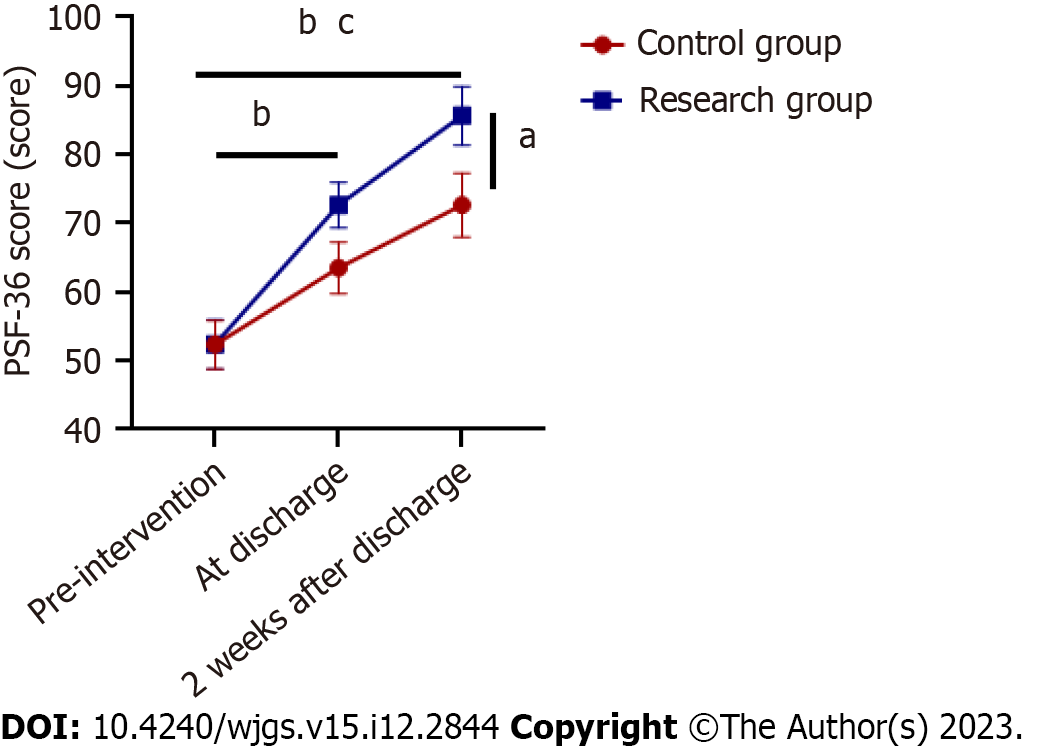
Figure 6 Comparison of quality of life between the two groups (n = 49).
aP < 0.05 compared to control group; bP < 0.05 compared to same group before intervention; cP < 0.05 compared to same group at discharge. SF-36: Quality of life The Brief Health Measurement Scale.
Figure 7 Comparison of complications between the two groups (n = 49).
A: Distribution of complications in the two groups; B: Comparison of complications in the two groups. aP < 0.05 compared with the control group.
Figure 8 Correlation between psychological state, self-management, self-efficacy and quality of life.
A: Correlation between psychological state and quality of life 2 wk after discharge in the study group; B: Correlation between self-management skills and quality of life 2 wk after discharge in the study group; C: Correlation between self-efficacy and quality of life 2 wk after discharge in the study group. HAMA: Hamilton Anxiety Scale; HAMD: Hamilton Depression Scale; PIH: Self-Management Scale; GSES: General Self-Efficacy Scale; SF-36: Quality of life The Brief Health Measurement Scale.
- Citation: Wang J, Qiao JH. Holistic conditions after colon cancer: A randomized controlled trial of systematic holistic care vs primary care. World J Gastrointest Surg 2023; 15(12): 2844-2854
- URL: https://www.wjgnet.com/1948-9366/full/v15/i12/2844.htm
- DOI: https://dx.doi.org/10.4240/wjgs.v15.i12.2844


