Copyright
©The Author(s) 2023.
World J Gastrointest Surg. Dec 27, 2023; 15(12): 2747-2756
Published online Dec 27, 2023. doi: 10.4240/wjgs.v15.i12.2747
Published online Dec 27, 2023. doi: 10.4240/wjgs.v15.i12.2747
Figure 1
The study flow diagram.
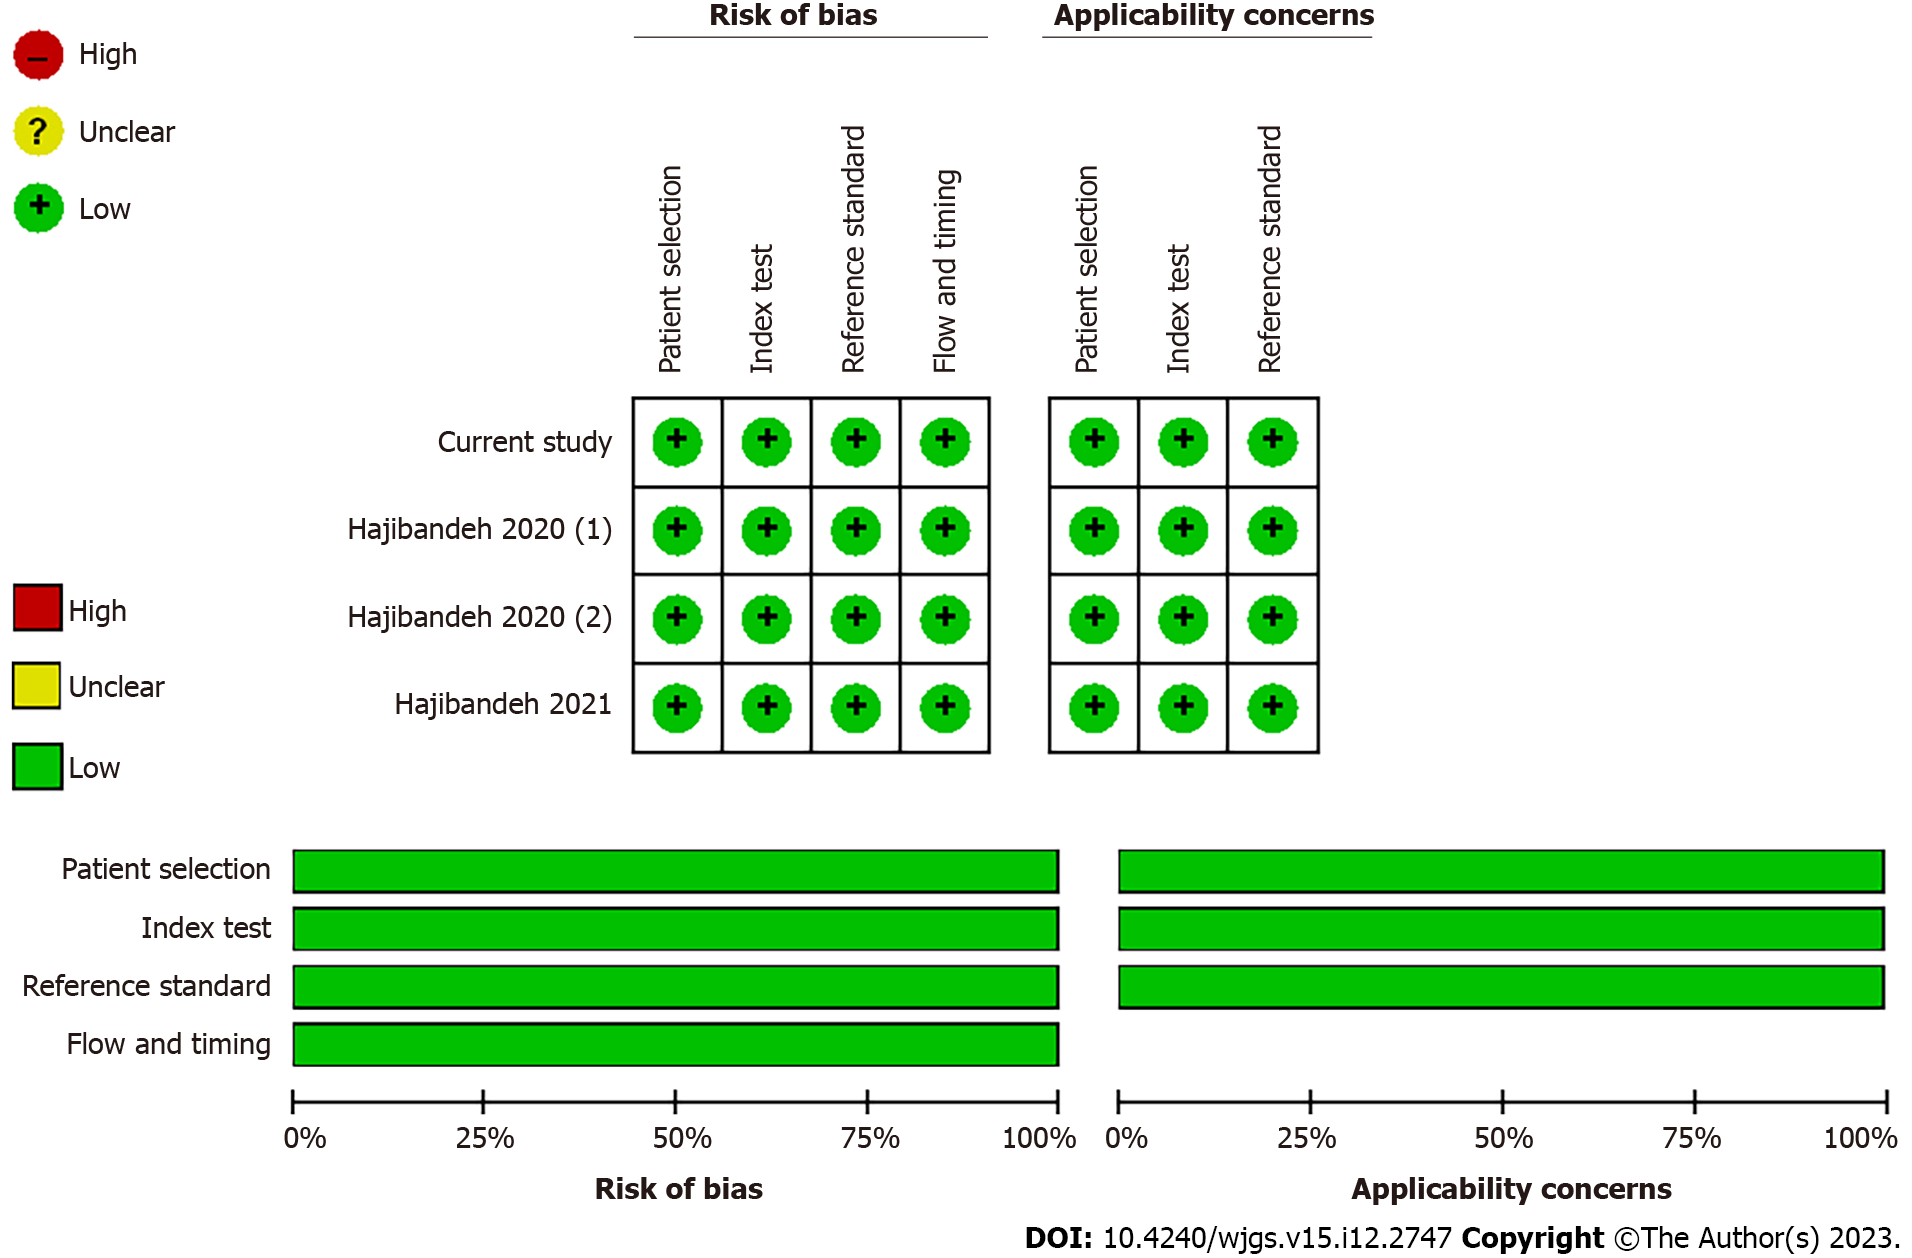
Figure 2
The outcomes of methodological quality assessment of the included studies using the Quality Assessment of Diagnostic Accuracy Studies 2 criteria.
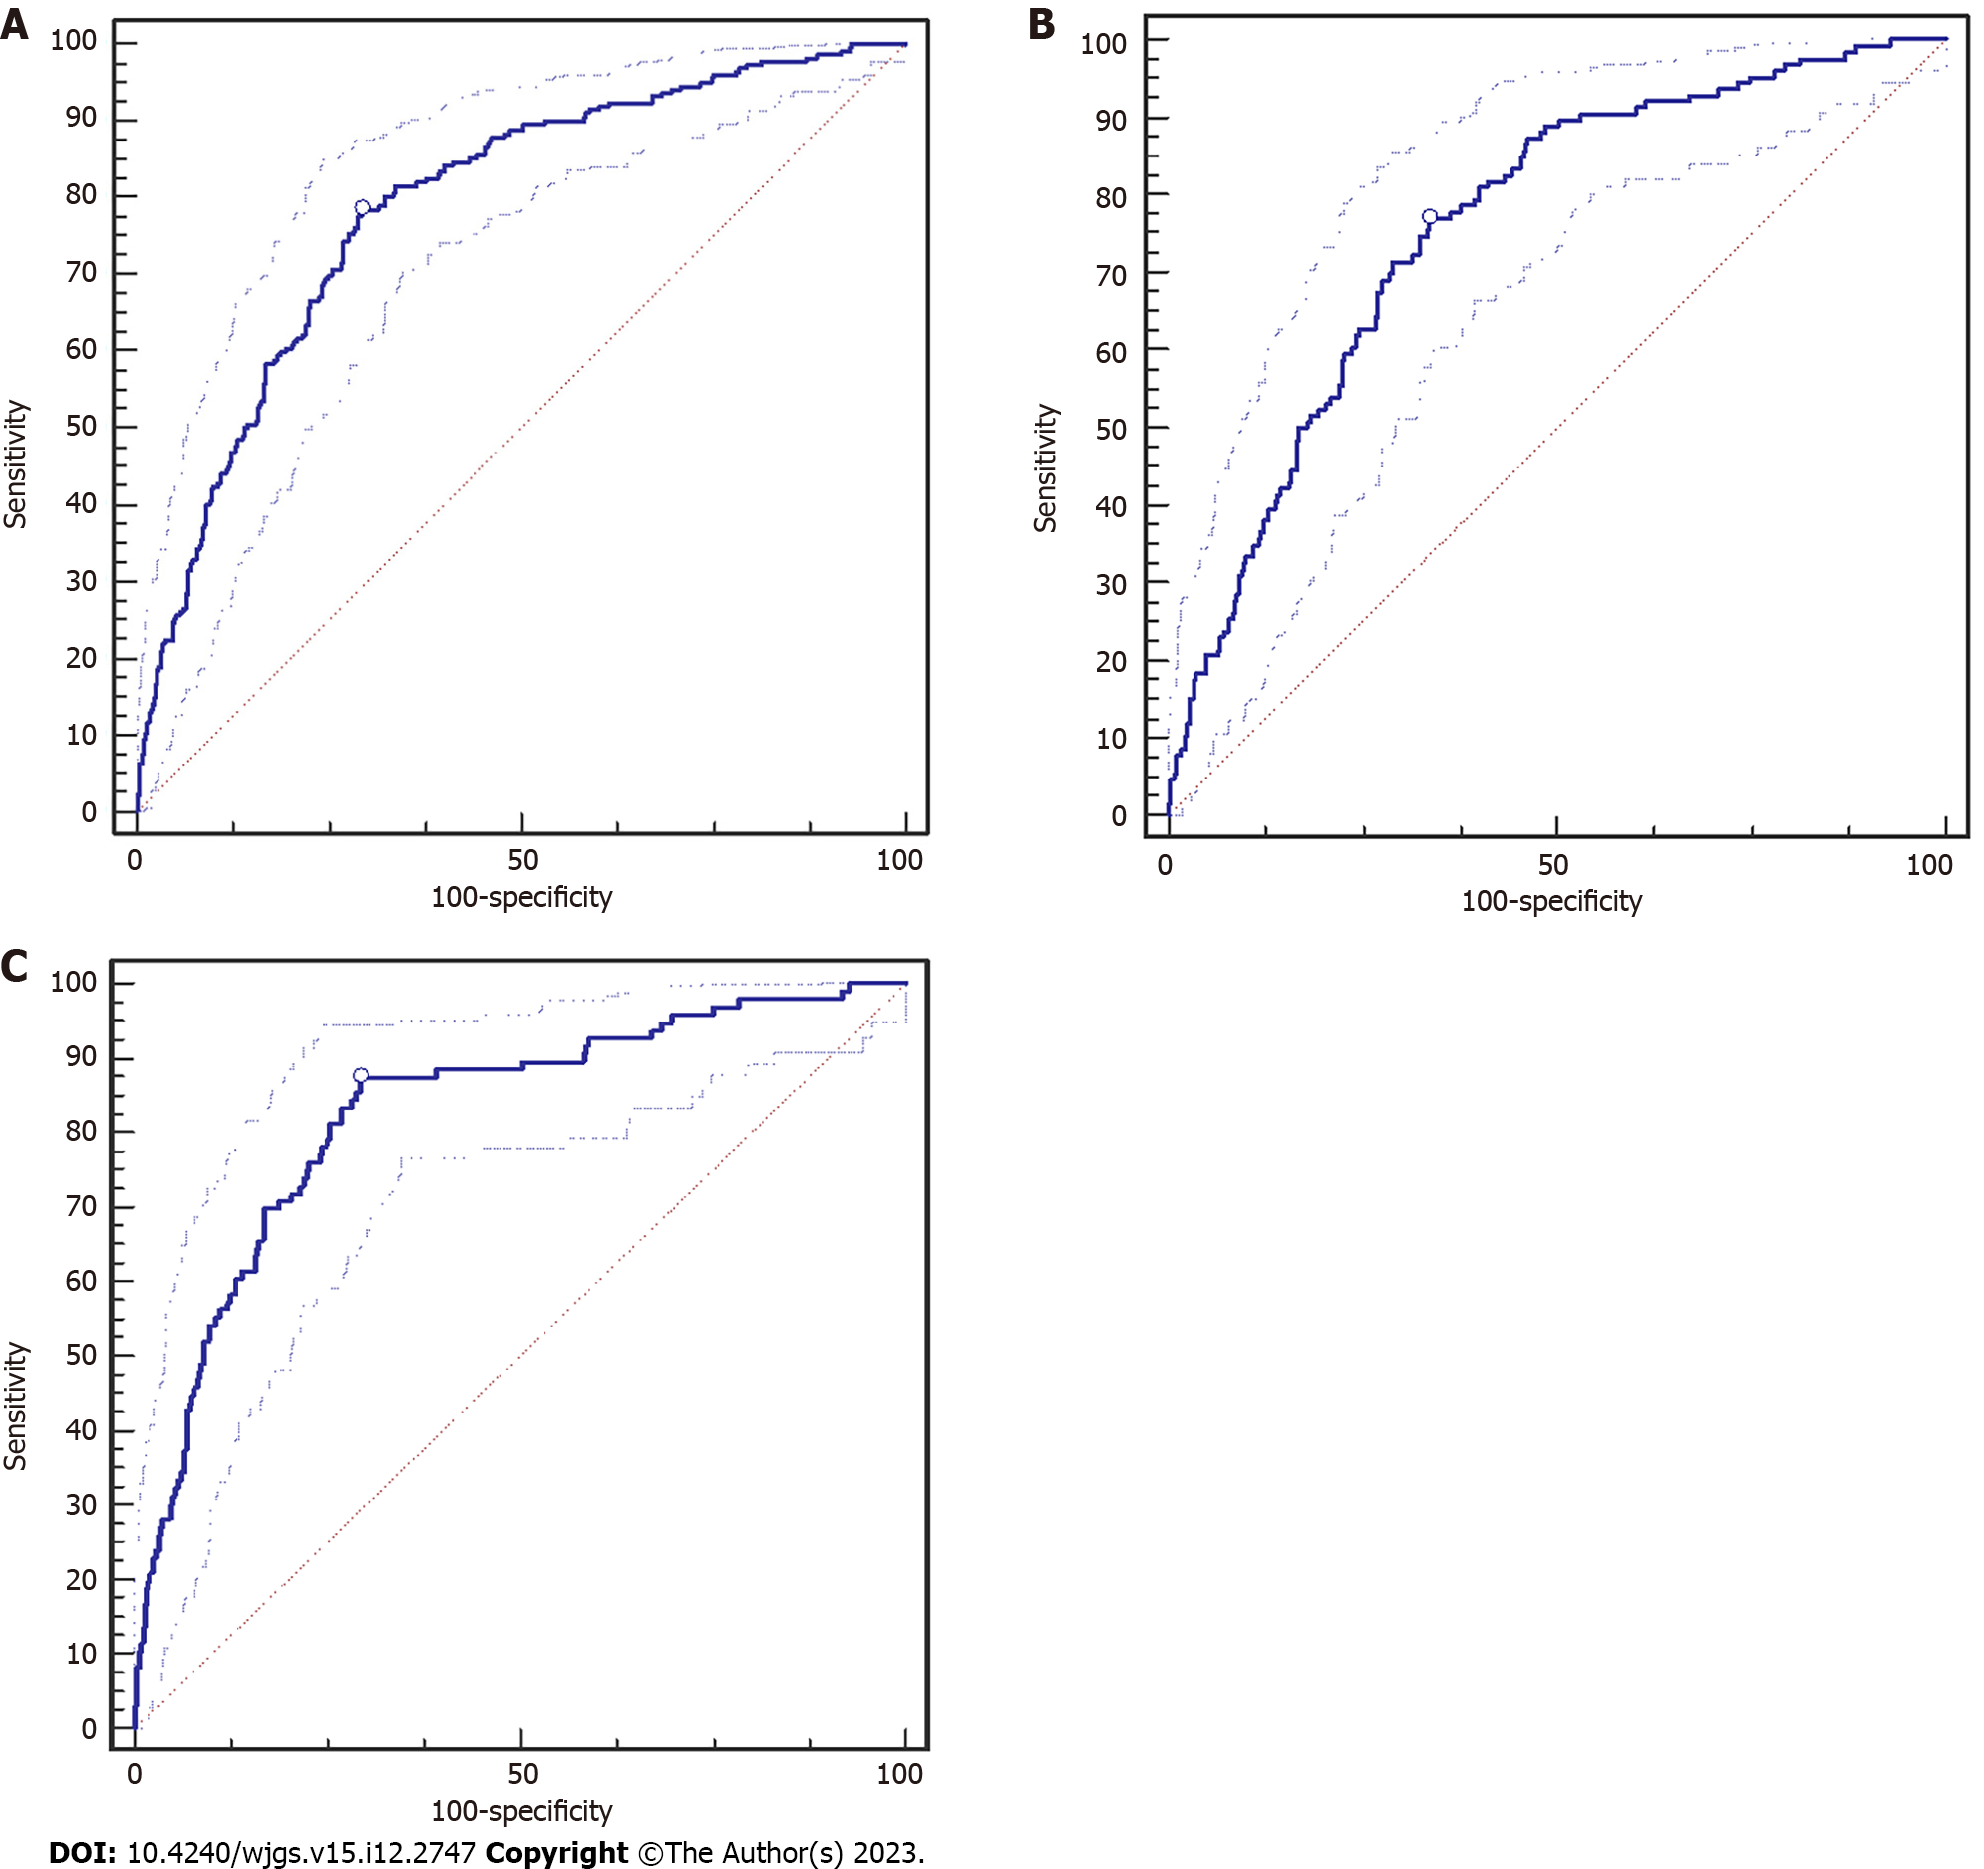
Figure 3 Results of receiver operating characteristic curve analyses of Hajibandeh index.
A: Presence of contamination; B: Purulent contamination; C: Feculent contamination.
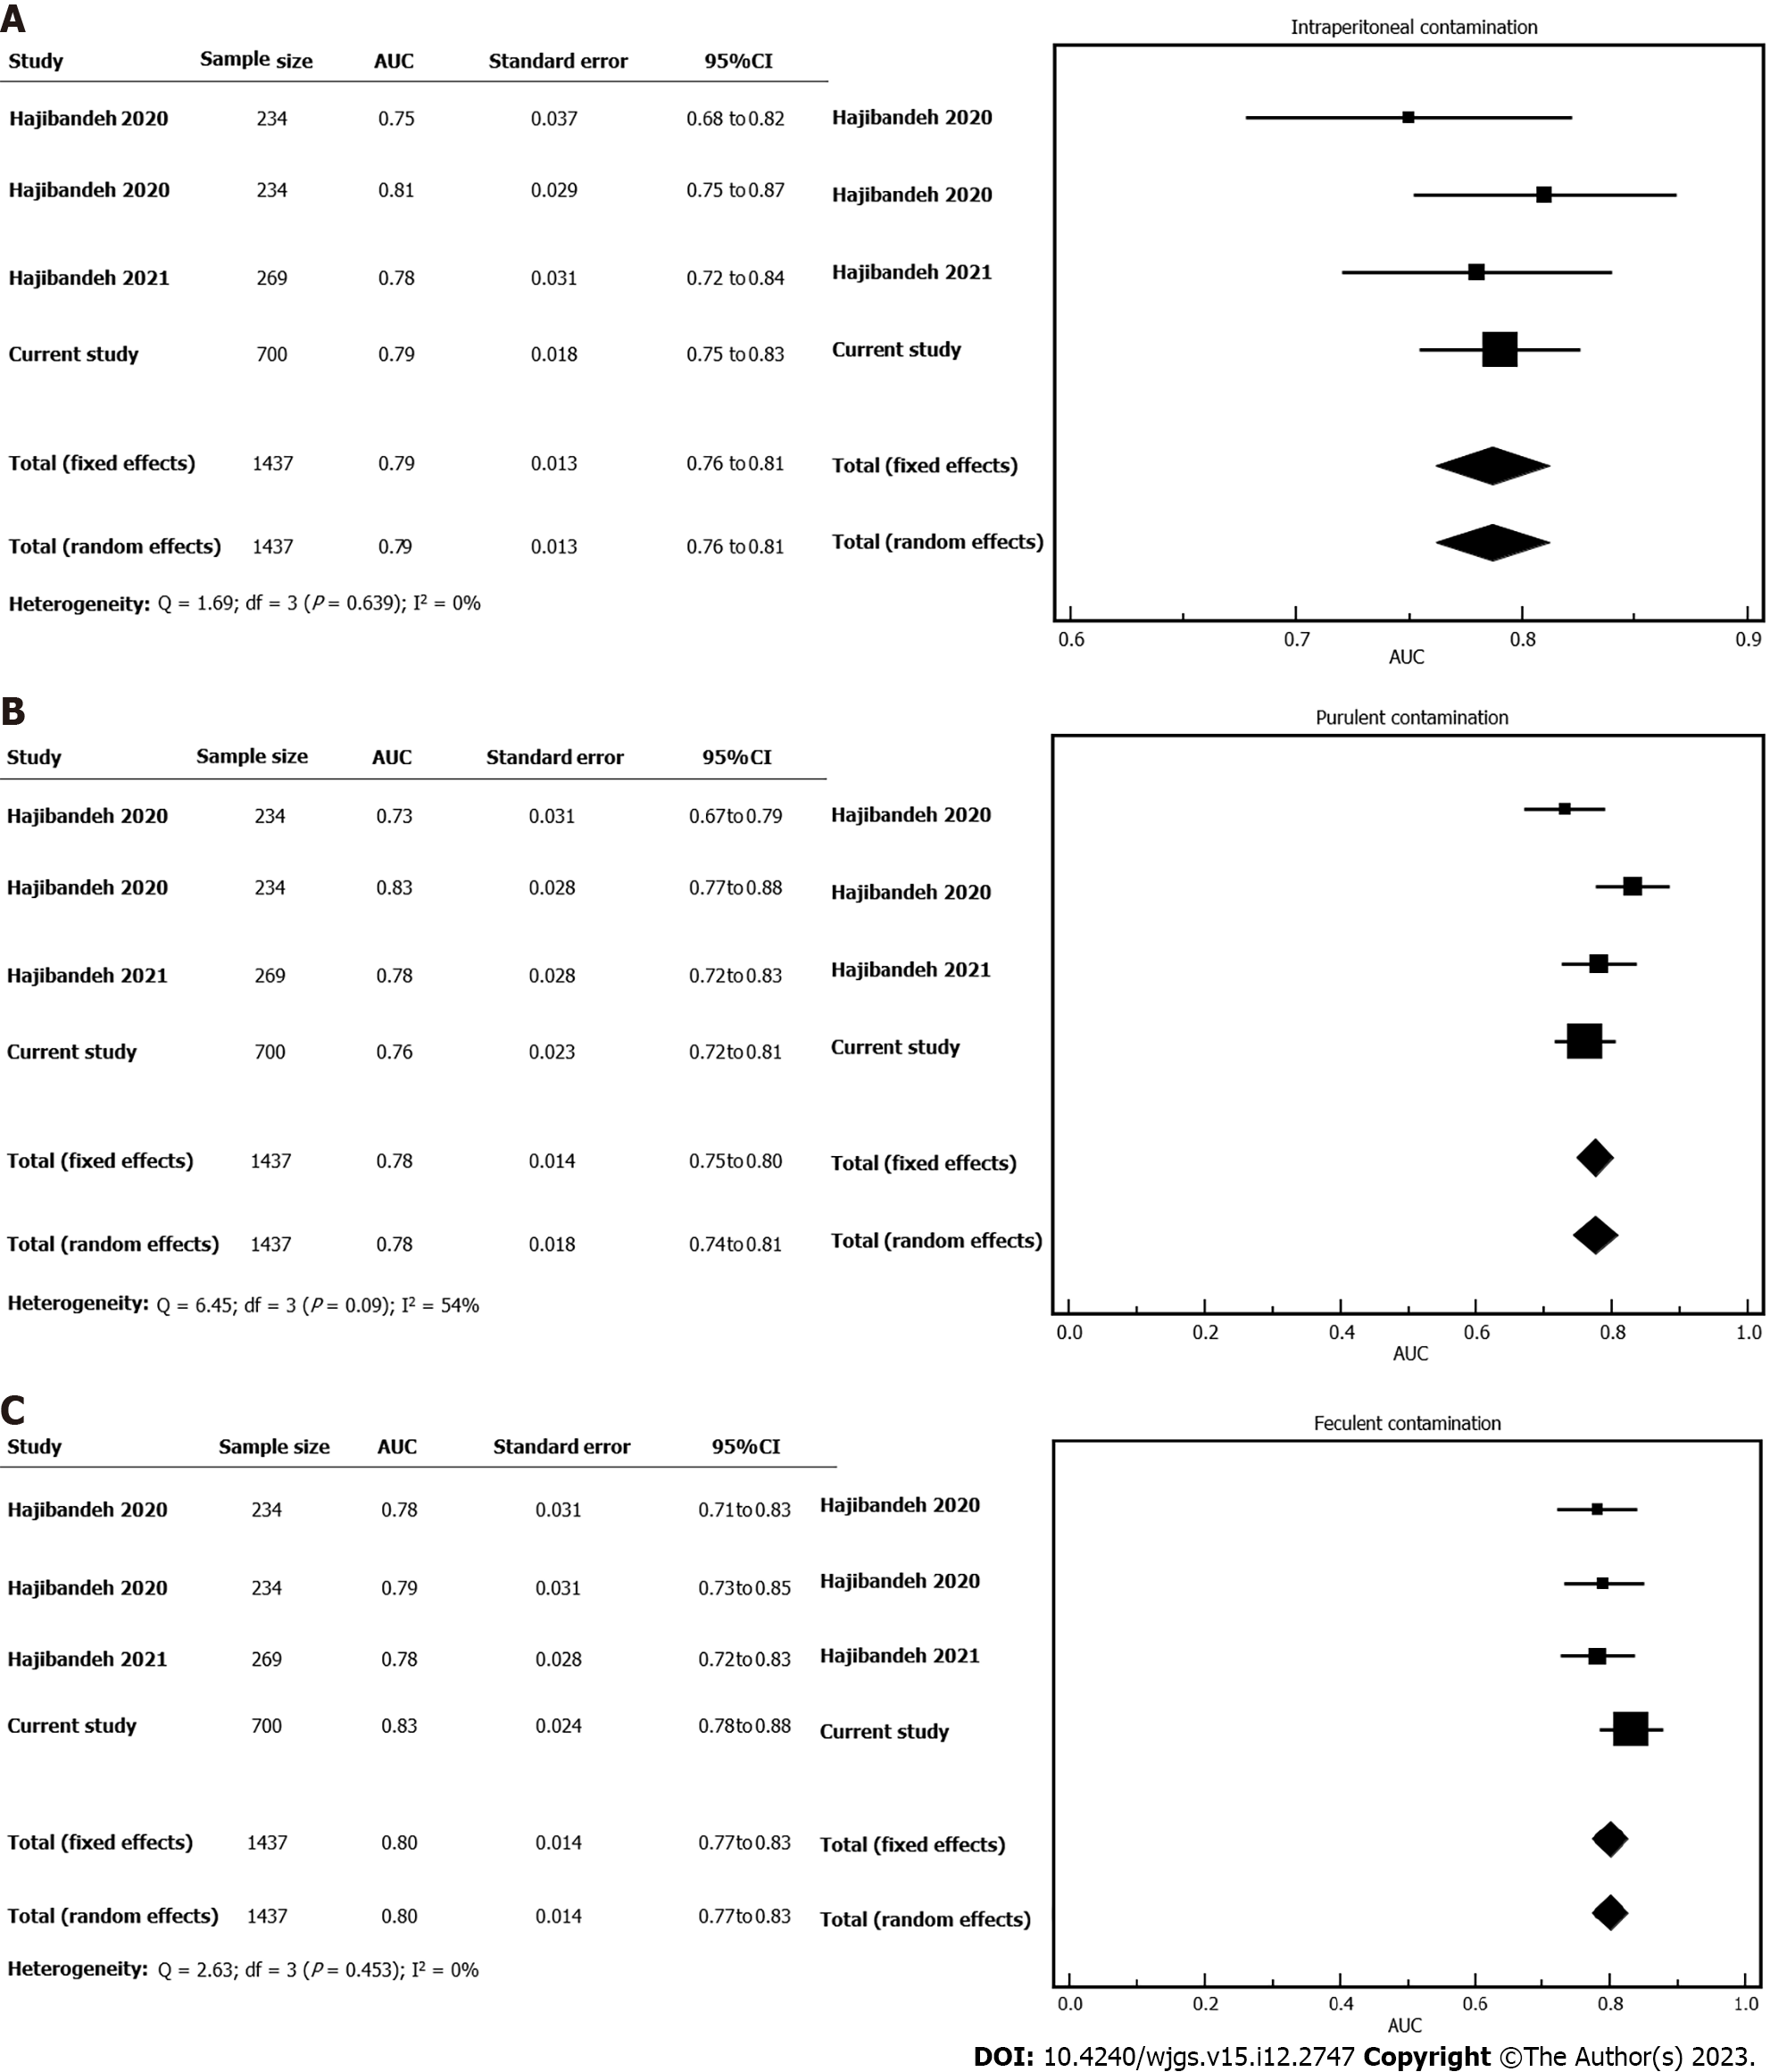
Figure 4 Forest plot of the area under the curve of Hajibandeh index.
A: Presence of intraperitoneal contamination; B: Purulent contamination; C: Feculent contamination. AUC: Area under the curve; CI: Confidence interval.
- Citation: Hajibandeh S, Hajibandeh S, Evans L, Miller B, Waterman J, Ahmad SJ, Hale J, Higgi A, Johnson B, Pearce D, Helmy AH, Naguib N, Maw A. Predictive value of Hajibandeh index in determining peritoneal contamination in acute abdomen: A cohort study and meta-analysis. World J Gastrointest Surg 2023; 15(12): 2747-2756
- URL: https://www.wjgnet.com/1948-9366/full/v15/i12/2747.htm
- DOI: https://dx.doi.org/10.4240/wjgs.v15.i12.2747


