Copyright
©The Author(s) 2023.
World J Gastrointest Surg. Dec 27, 2023; 15(12): 2727-2738
Published online Dec 27, 2023. doi: 10.4240/wjgs.v15.i12.2727
Published online Dec 27, 2023. doi: 10.4240/wjgs.v15.i12.2727
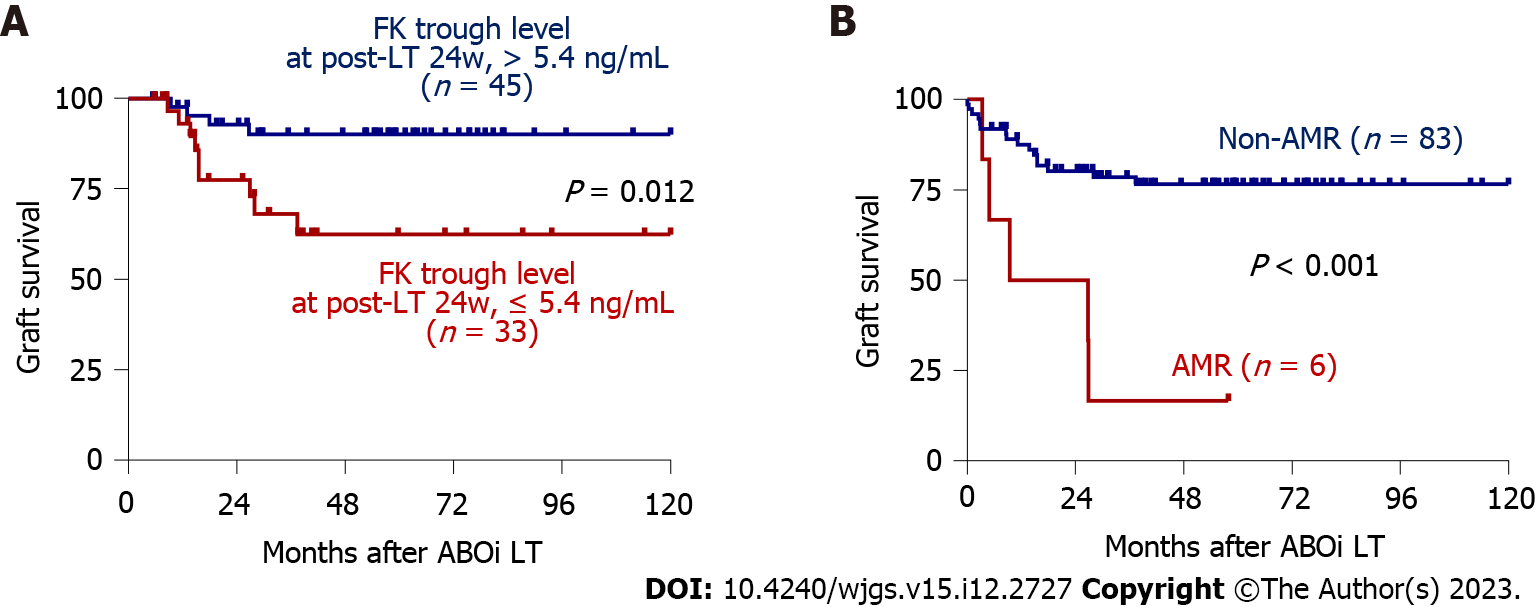
Figure 1 Long-term graft outcomes according to risk factors.
A: Survival curves according to tacrolimus trough concentration at 24 wk post-liver transplantation (> 5.4 ng/mL, n = 45 vs ≤ 5.4 ng/mL n = 33). Patients for whom tacrolimus concentrations at 24 wk were not reported were excluded from the analyses; B: Survival curves for the antibody-mediated rejection (AMR, n = 6) and non-AMR (n = 83) groups. ABOi: ABO-incompatible; FK: Tacrolimus; LT: Liver transplantation; AMR: Antibody-mediated rejection.
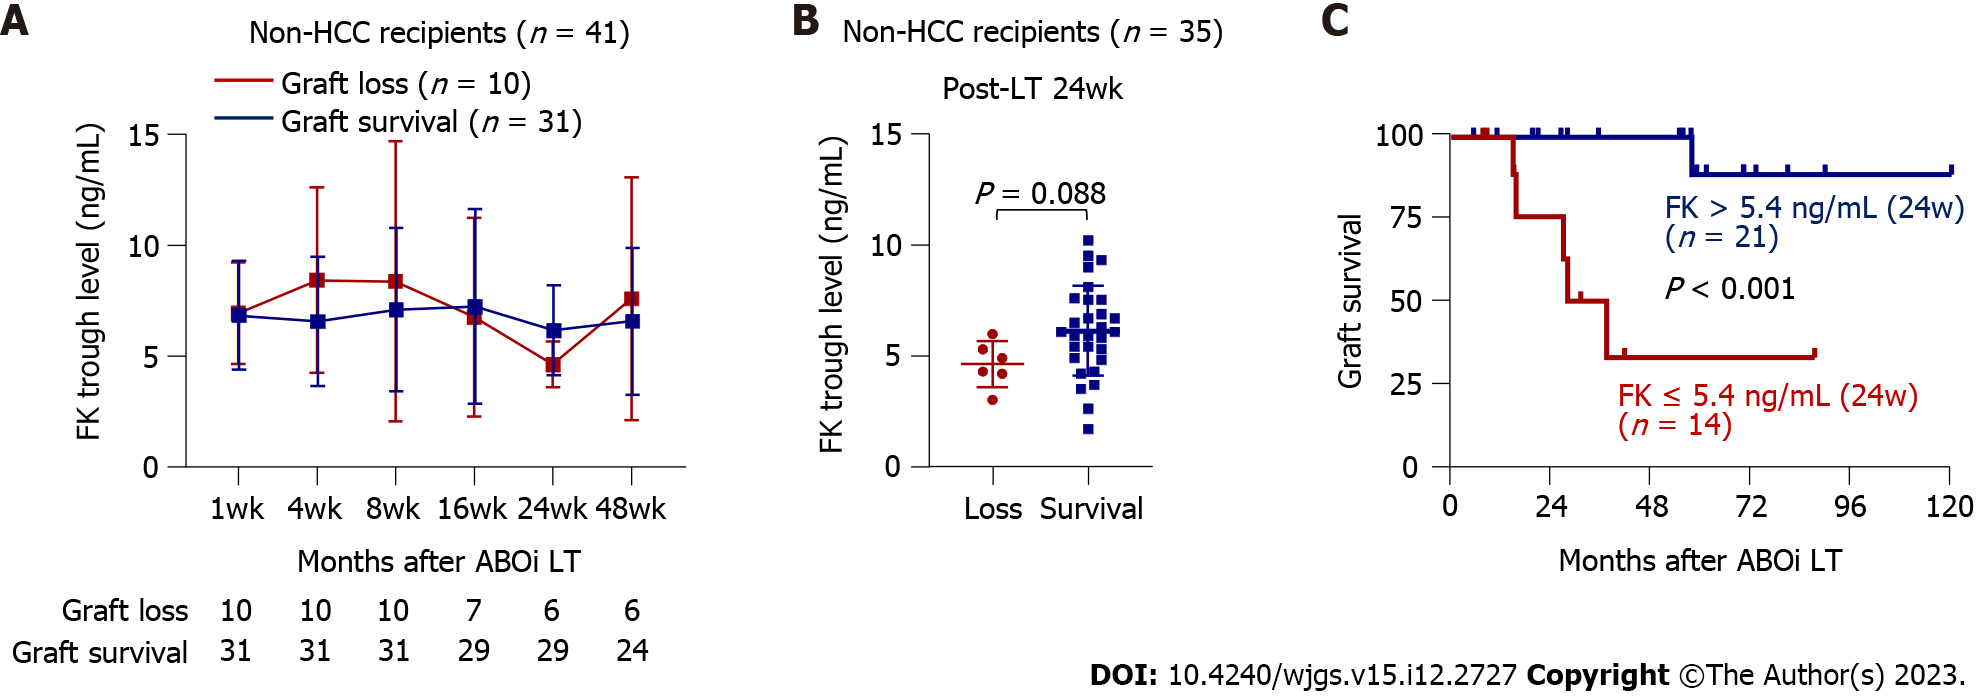
Figure 2 Long-term graft outcomes of the non-hepatocellular carcinoma subgroup (n = 41) and their associations with tacrolimus trough concentration.
A: Comparison of tacrolimus concentrations in the graft failure (n = 10) and graft survival (n = 31) groups at each time point; B: A graph comparing tacrolimus concentrations at 24 wk post- liver transplantation (LT) in the graft loss (n = 10) and graft survival (n = 31) groups; C: Survival curves according to tacrolimus trough concentration at 24 wk post-LT (> 5.4 ng/mL, n = 21 vs ≤ 5.4 ng/mL, n = 14). Patients for whom tacrolimus concentration was not reported at 24 weeks were excluded from the analyses. ABOi: ABO-incompatible; FK: Tacrolimus; HCC: Hepatocellular carcinoma; LT: Liver transplantation.
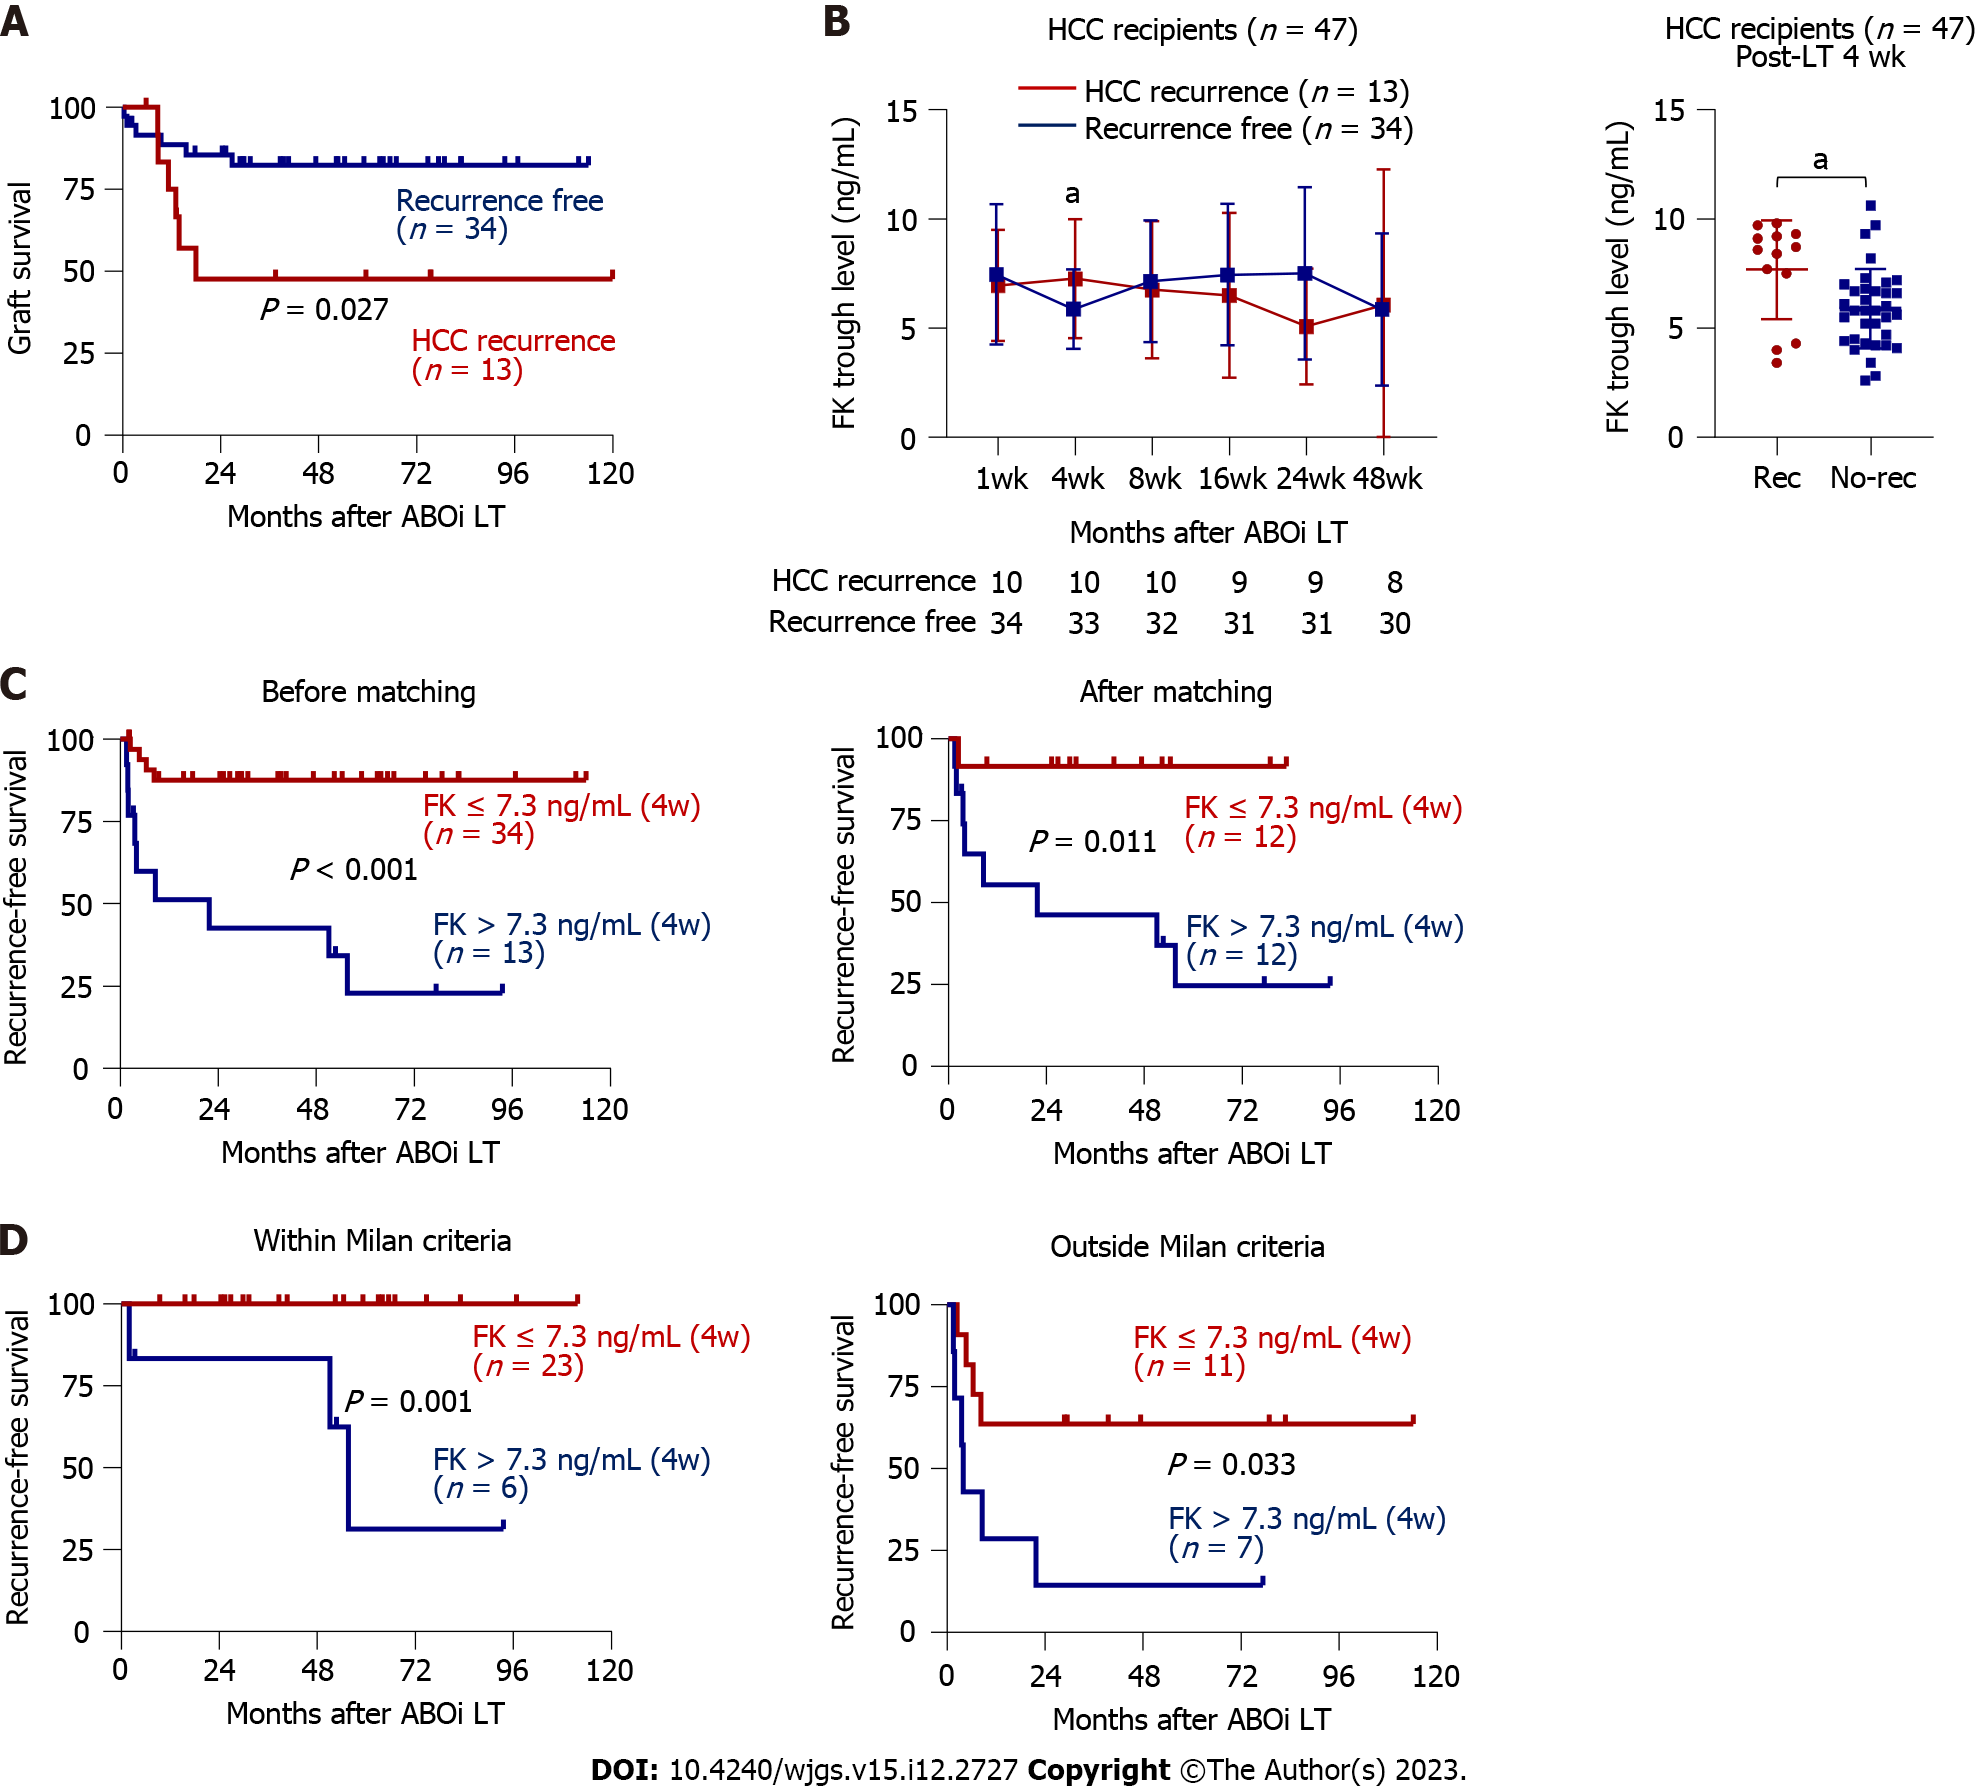
Figure 3 Hepatocellular carcinoma recurrence and its association with tacrolimus trough concentration.
A: Survival curve presenting difference in the graft survival between hepatocellular carcinoma (HCC) recurrence (n = 13) and non-recurrence (n = 34); B: Comparison of tacrolimus concentrations in the HCC recurrence (n = 13) and non-recurrence (n = 34) groups at each time point (left) and at 4 wk (right); C and D: Two patients who died during the perioperative period from postoperative complication or sepsis were excluded; C: Survival curves presenting recurrence-free survival (RFS) according to tacrolimus trough concentration at 4 wk post-liver transplantation (LT) before propensity-score matching (> 7.3 ng/mL, n = 13 vs ≤ 7.3 ng/mL, n = 34) and after matching (> 7.3 ng/mL, n = 12 vs ≤ 7.3 ng/mL, n = 12); Patients for whom tacrolimus concentrations 4 wk post-LT were not reported were excluded from the analyses; D: Prior to transplantation, patients were assigned to subgroups according to the Milan criteria in the pre-LT radiologic evaluation. RFS curves for each subgroup according to trough tacrolimus concentration at 4 wk post-LT are presented. ABOi: ABO-incompatible; FK: Tacrolimus; HCC: Hepatocellular carcinoma; LT: Liver transplantation. aP < 0.05.
- Citation: Han JW, Choi JY, Jung ES, Kim JH, Cho HS, Yoo JS, Sung PS, Jang JW, Yoon SK, Choi HJ, You YK. Association between the early high level of serum tacrolimus and recurrence of hepatocellular carcinoma in ABO-incompatible liver transplantation. World J Gastrointest Surg 2023; 15(12): 2727-2738
- URL: https://www.wjgnet.com/1948-9366/full/v15/i12/2727.htm
- DOI: https://dx.doi.org/10.4240/wjgs.v15.i12.2727


