Copyright
©The Author(s) 2023.
World J Gastrointest Surg. Nov 27, 2023; 15(11): 2663-2673
Published online Nov 27, 2023. doi: 10.4240/wjgs.v15.i11.2663
Published online Nov 27, 2023. doi: 10.4240/wjgs.v15.i11.2663
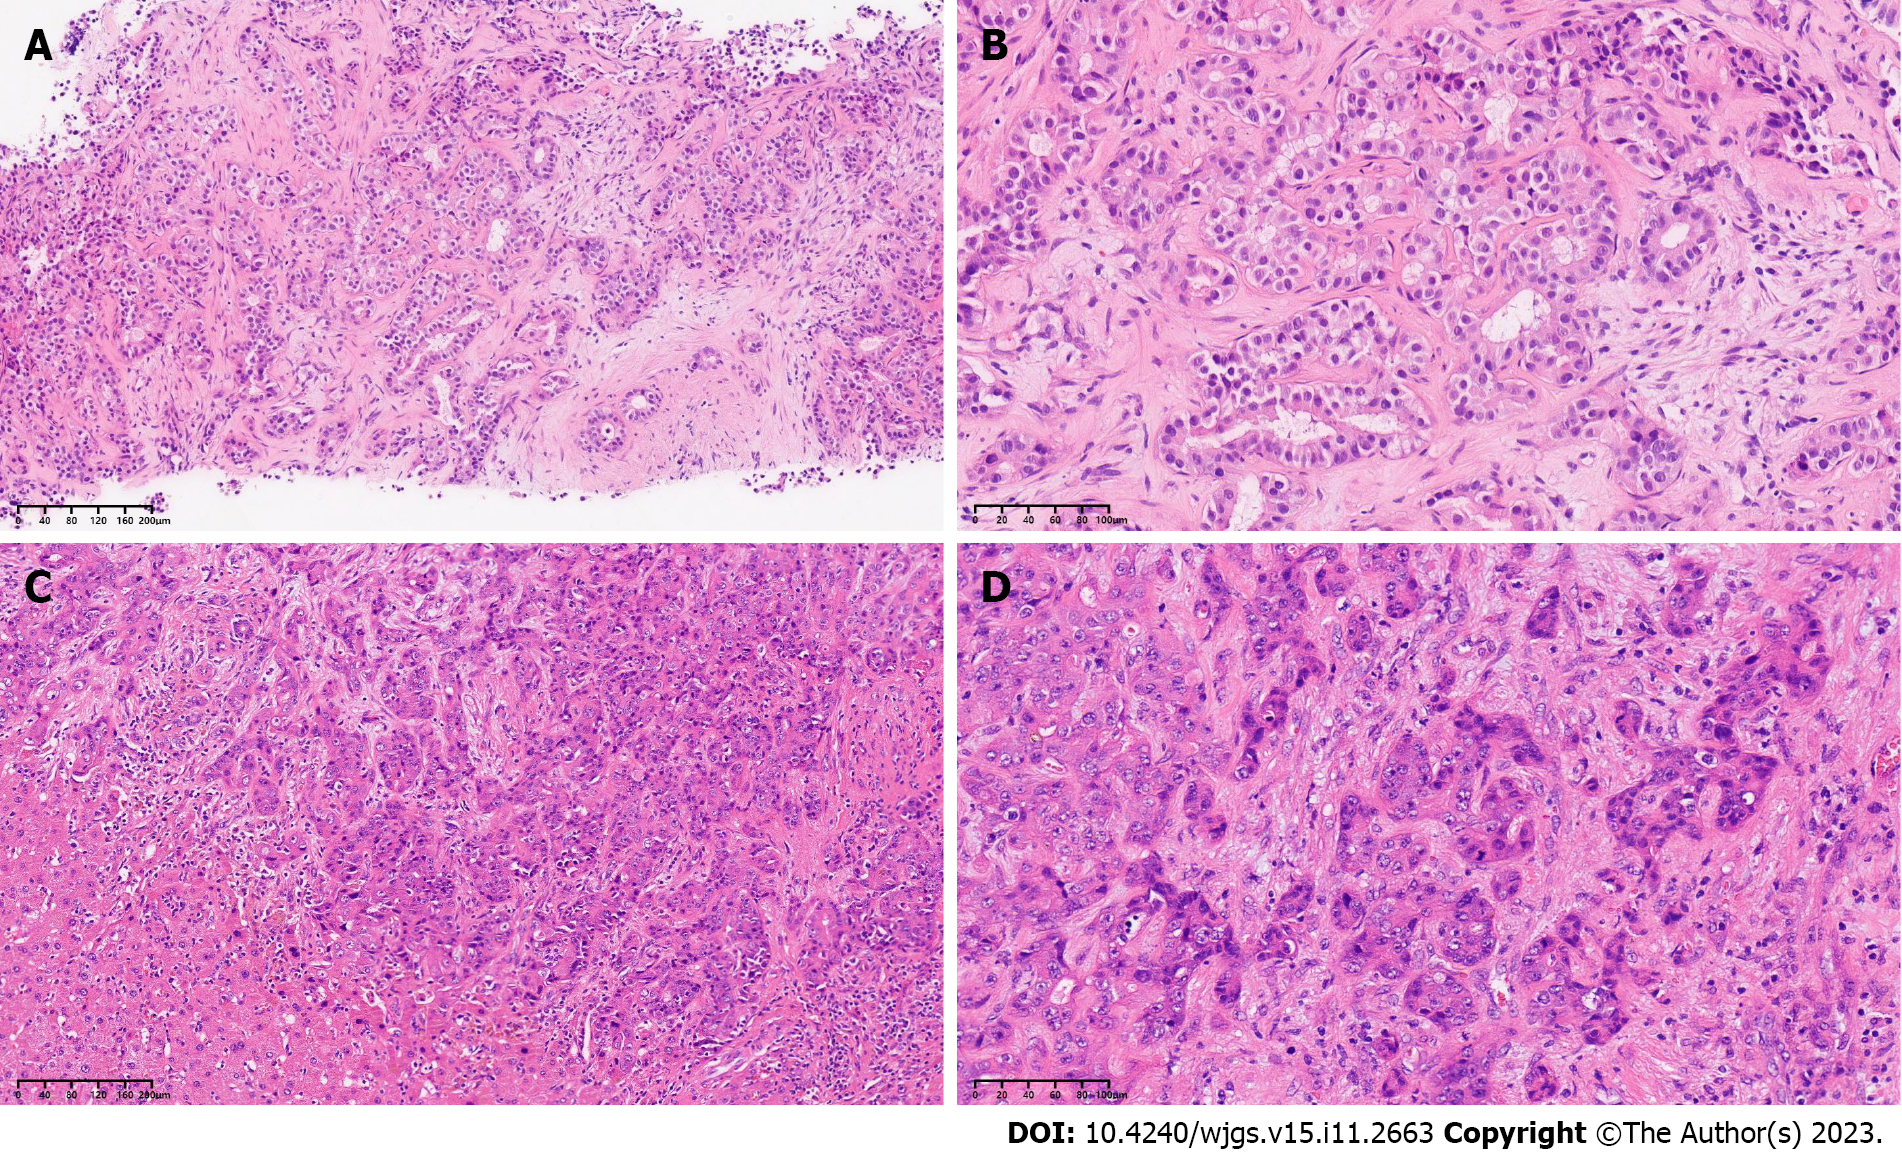
Figure 1 Pathological examination of the tumor before and after systematic sequential therapy.
A and C: Hematoxylin and eosin (H&E), original magnification × 100; B and D: H&E, original magnification × 200.
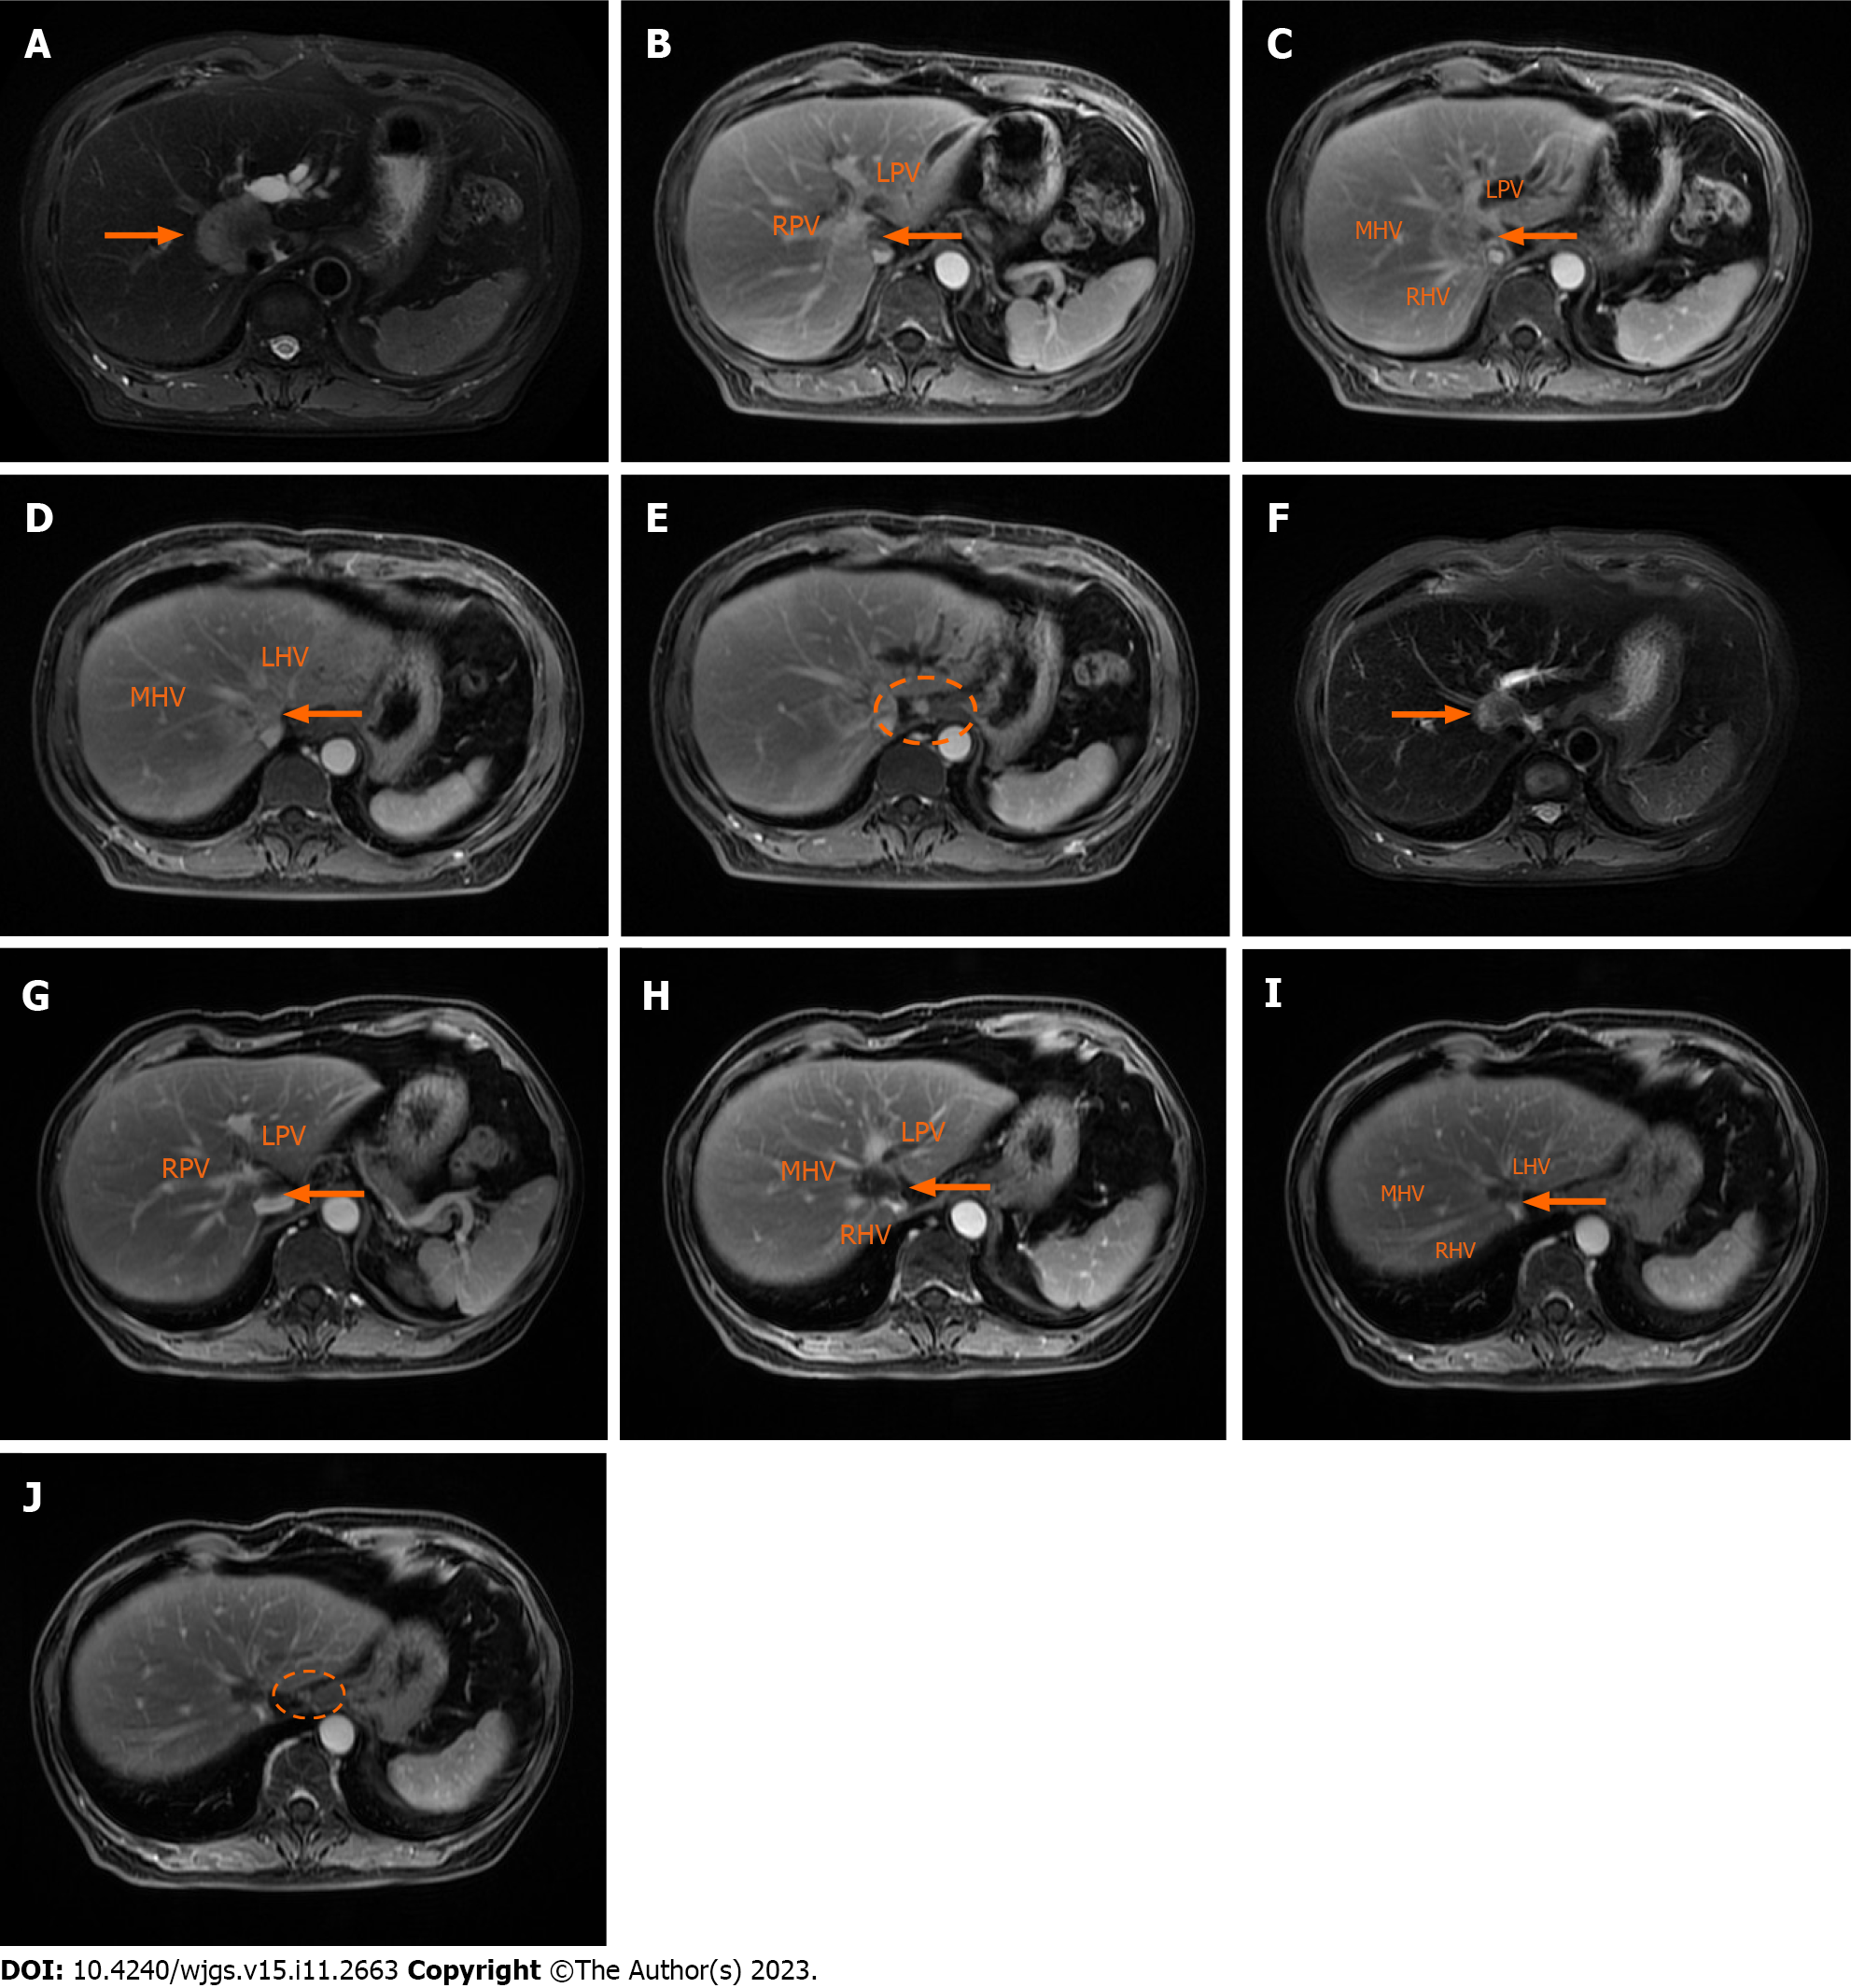
Figure 2 Contrast-enhanced magnetic resonance images of the irregular tumor or enlarged hilar lymph node before and after systematic sequential therapy.
The white arrow indicates the tumor, and the white circle contains an enlarged lymph node. A: T2 phase image before therapy showing a hilar mass with a maximum diameter of 41 mm; B-D: Portal venous phase image before therapy showing that the tumor invaded the main portal vein with left and right branches, as well as the middle, left and right hepatic veins; E: Portal venous phase image before therapy showing the enlarged hilar lymph node; F: T2 phase image after therapy showing that a hilar mass shrunk to a maximum diameter of 21 mm; G-I: Portal venous phase image after therapy; J: Portal venous phase image after therapy showing that the enlarged hilar lymph nodes were smaller. RPV: Right portal vein; LPV: Left portal vein; MHV: Middle hepatic vein; RHV: Right hepatic vein; LHV: Left hepatic vein.
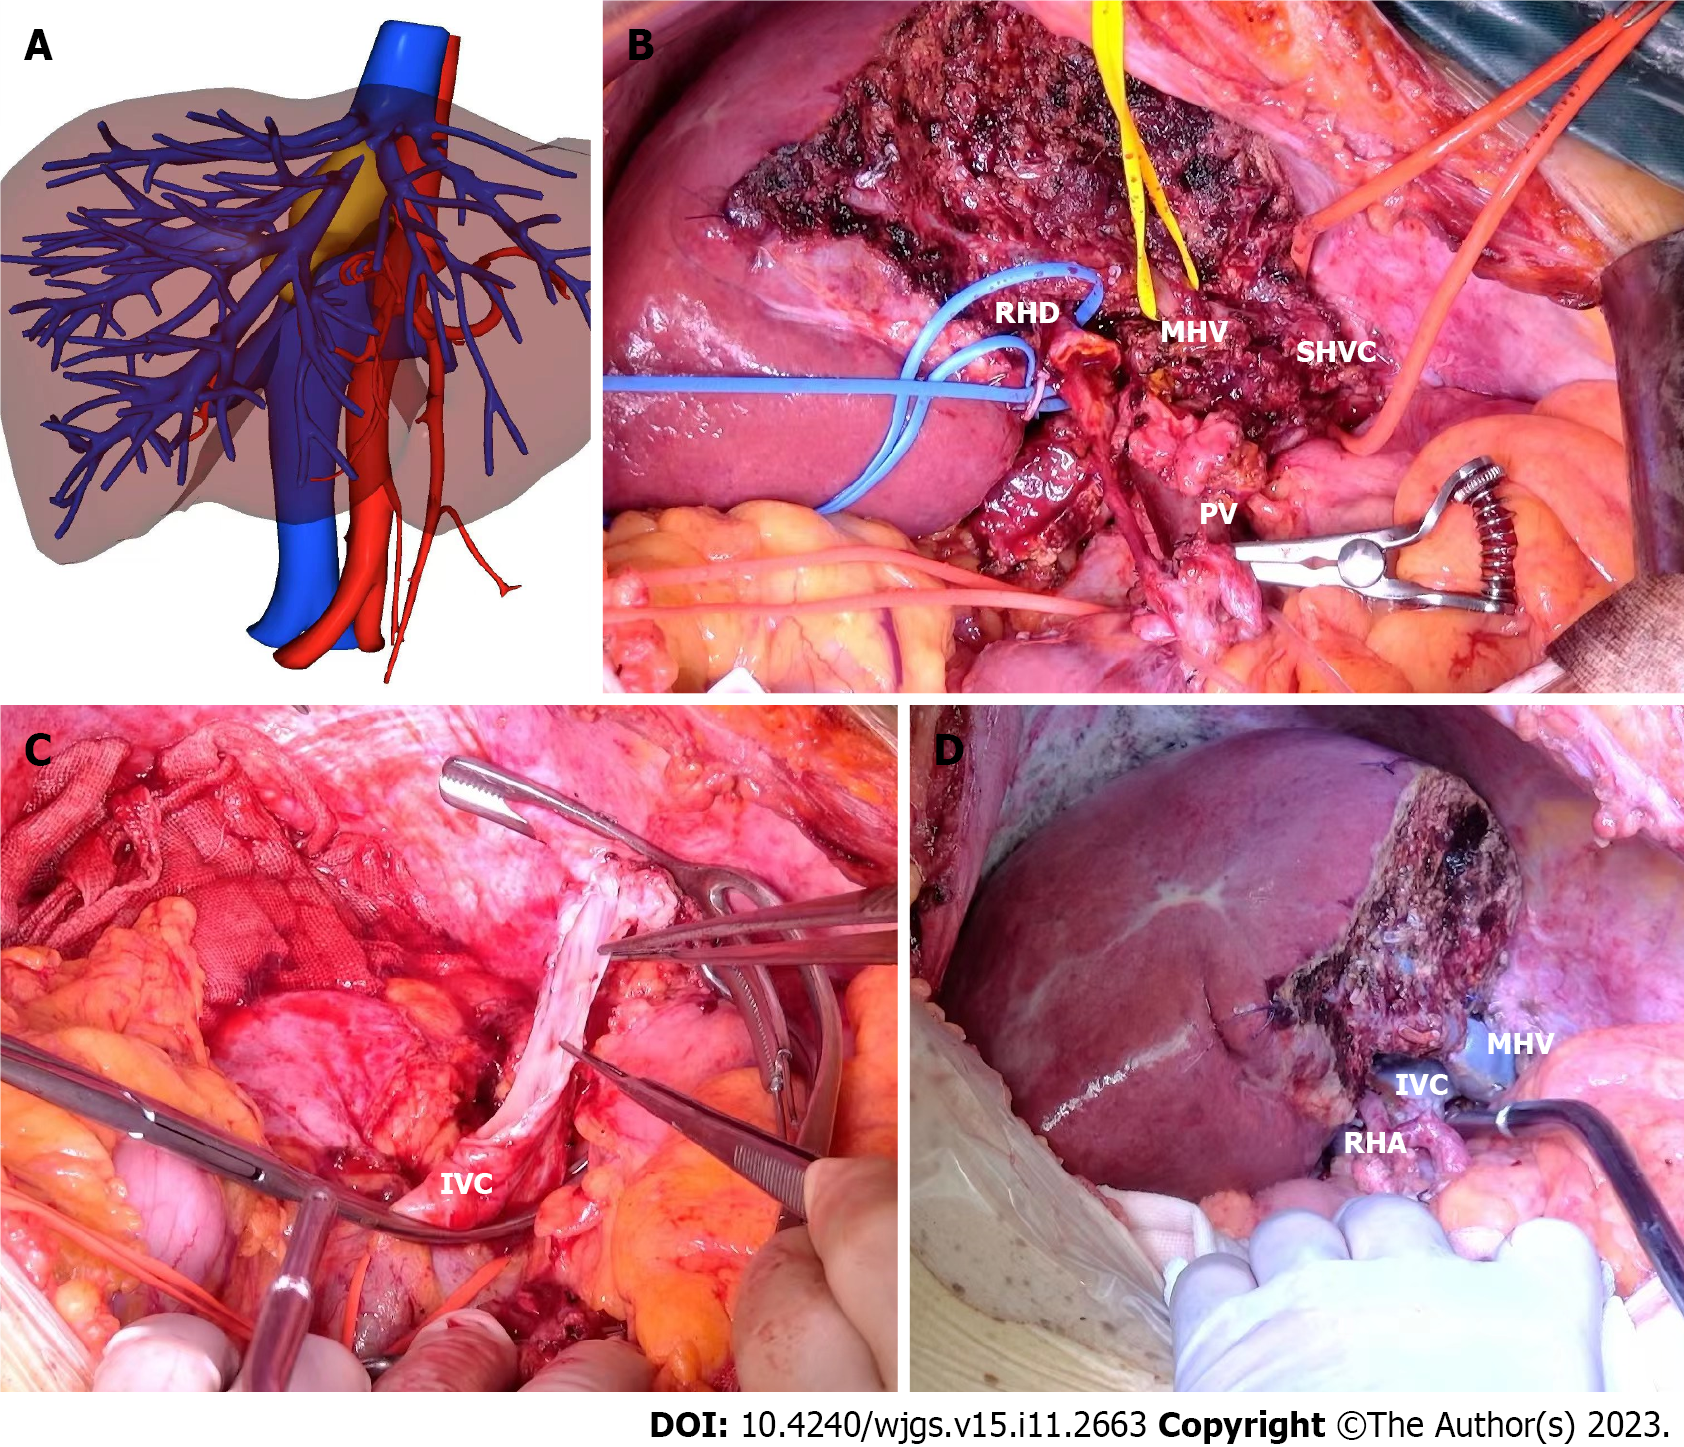
Figure 3 The key intraoperative process.
A: Three-dimensional reconstruction of the relationship between the hepatic vein and tumor after systematic sequential therapy; B: The right hemiliver retaining the middle hepatic vein; C: Removal of the right hemiliver and resection of the tumor invading the inferior vena cava; D: Reconstruction of the middle hepatic vein, inferior vena cava and right hepatic artery. IVC: Inferior vena cava; MHV: Middle hepatic vein; PV: Portal vein; RHA: Right hepatic artery; RHD: Right hepatic duct; SHVC: Superior hepatic vena cava.
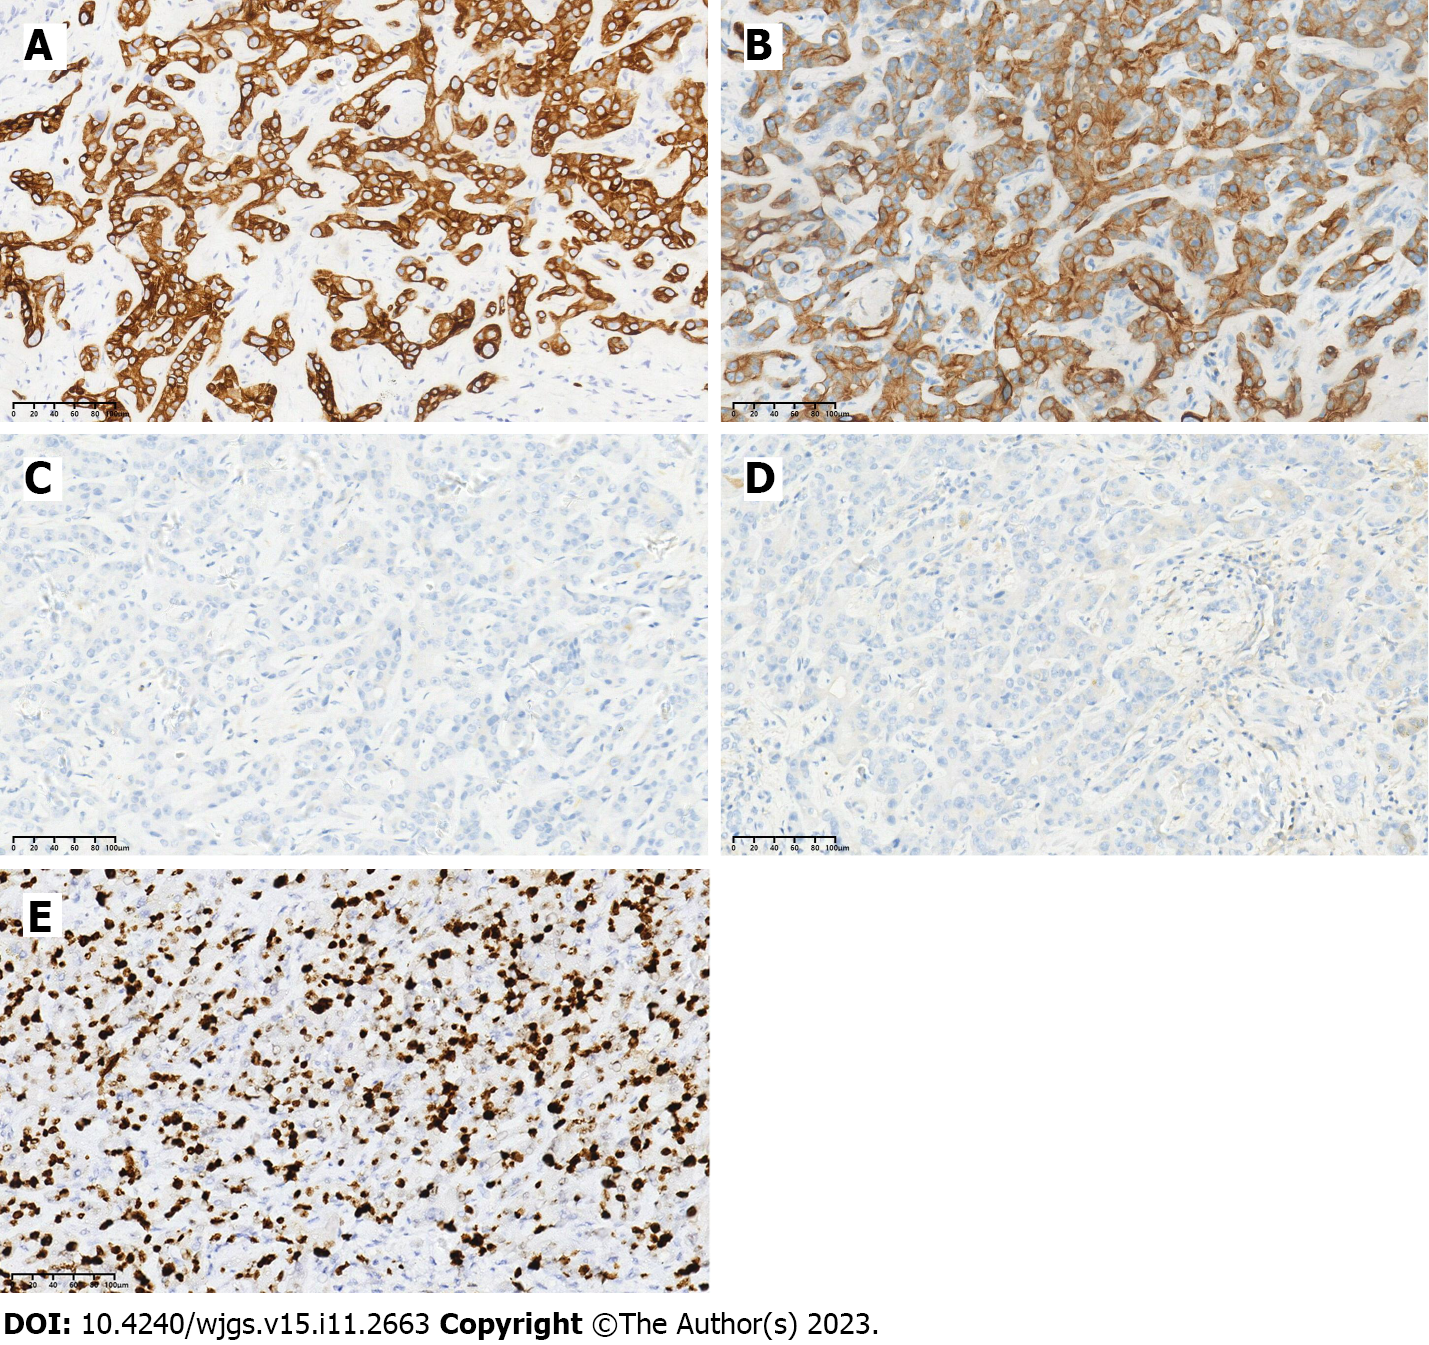
Figure 4 Immunohistochemical staining results for the tumor.
A: CK7 (+); B: CK19 (+); C: HepPar-1 (-); D: Arginase-1 (-); E: Ki-67.
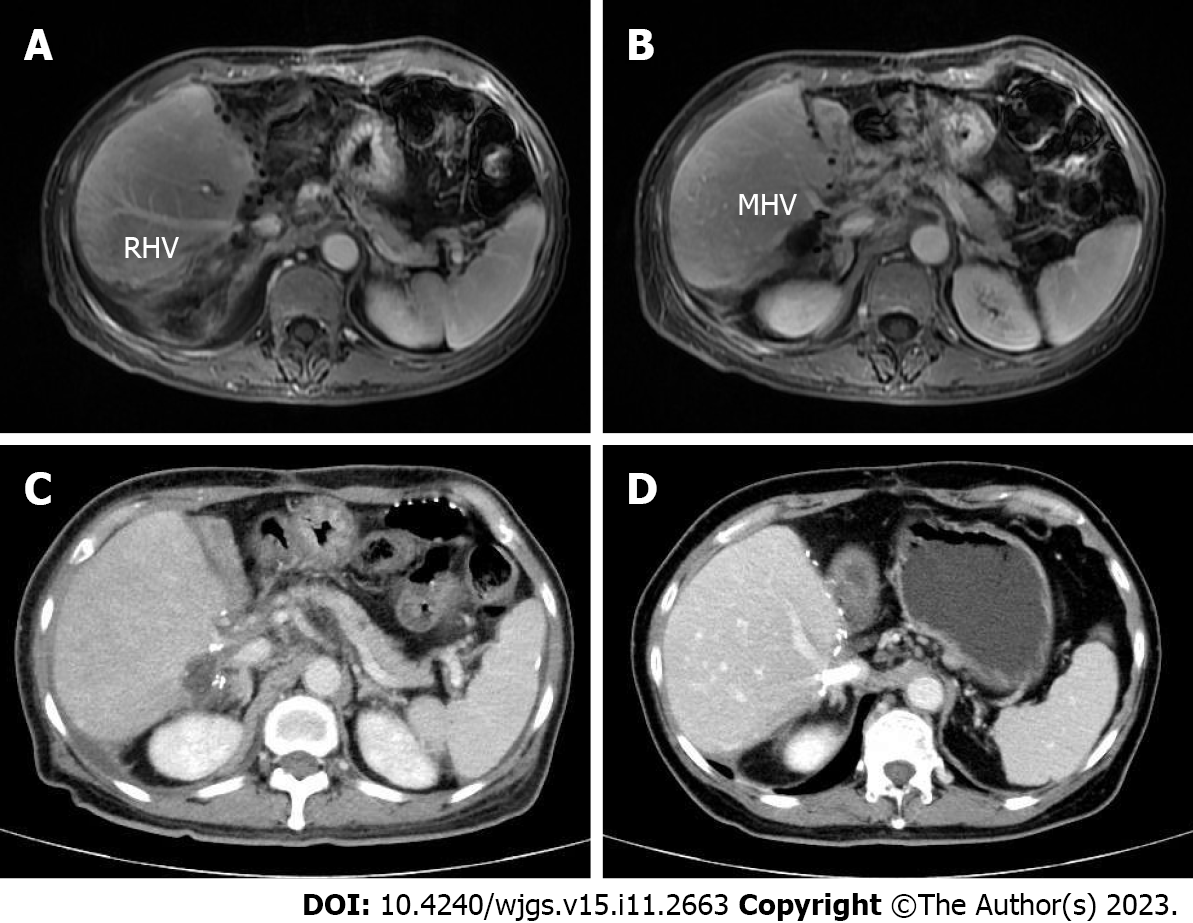
Figure 5 Contrast-enhanced magnetic resonance images and computed tomography images after surgery.
A and B: Portal venous phase image after surgery clearly showing the middle hepatic vein and right portal vein, respectively; C: Portal venous phase image showing the existence of hepatic congestion and hepatomegaly; D: Portal venous phase image showing the hepatic vein stent. MHV: Middle hepatic vein; RHV: Right hepatic vein.
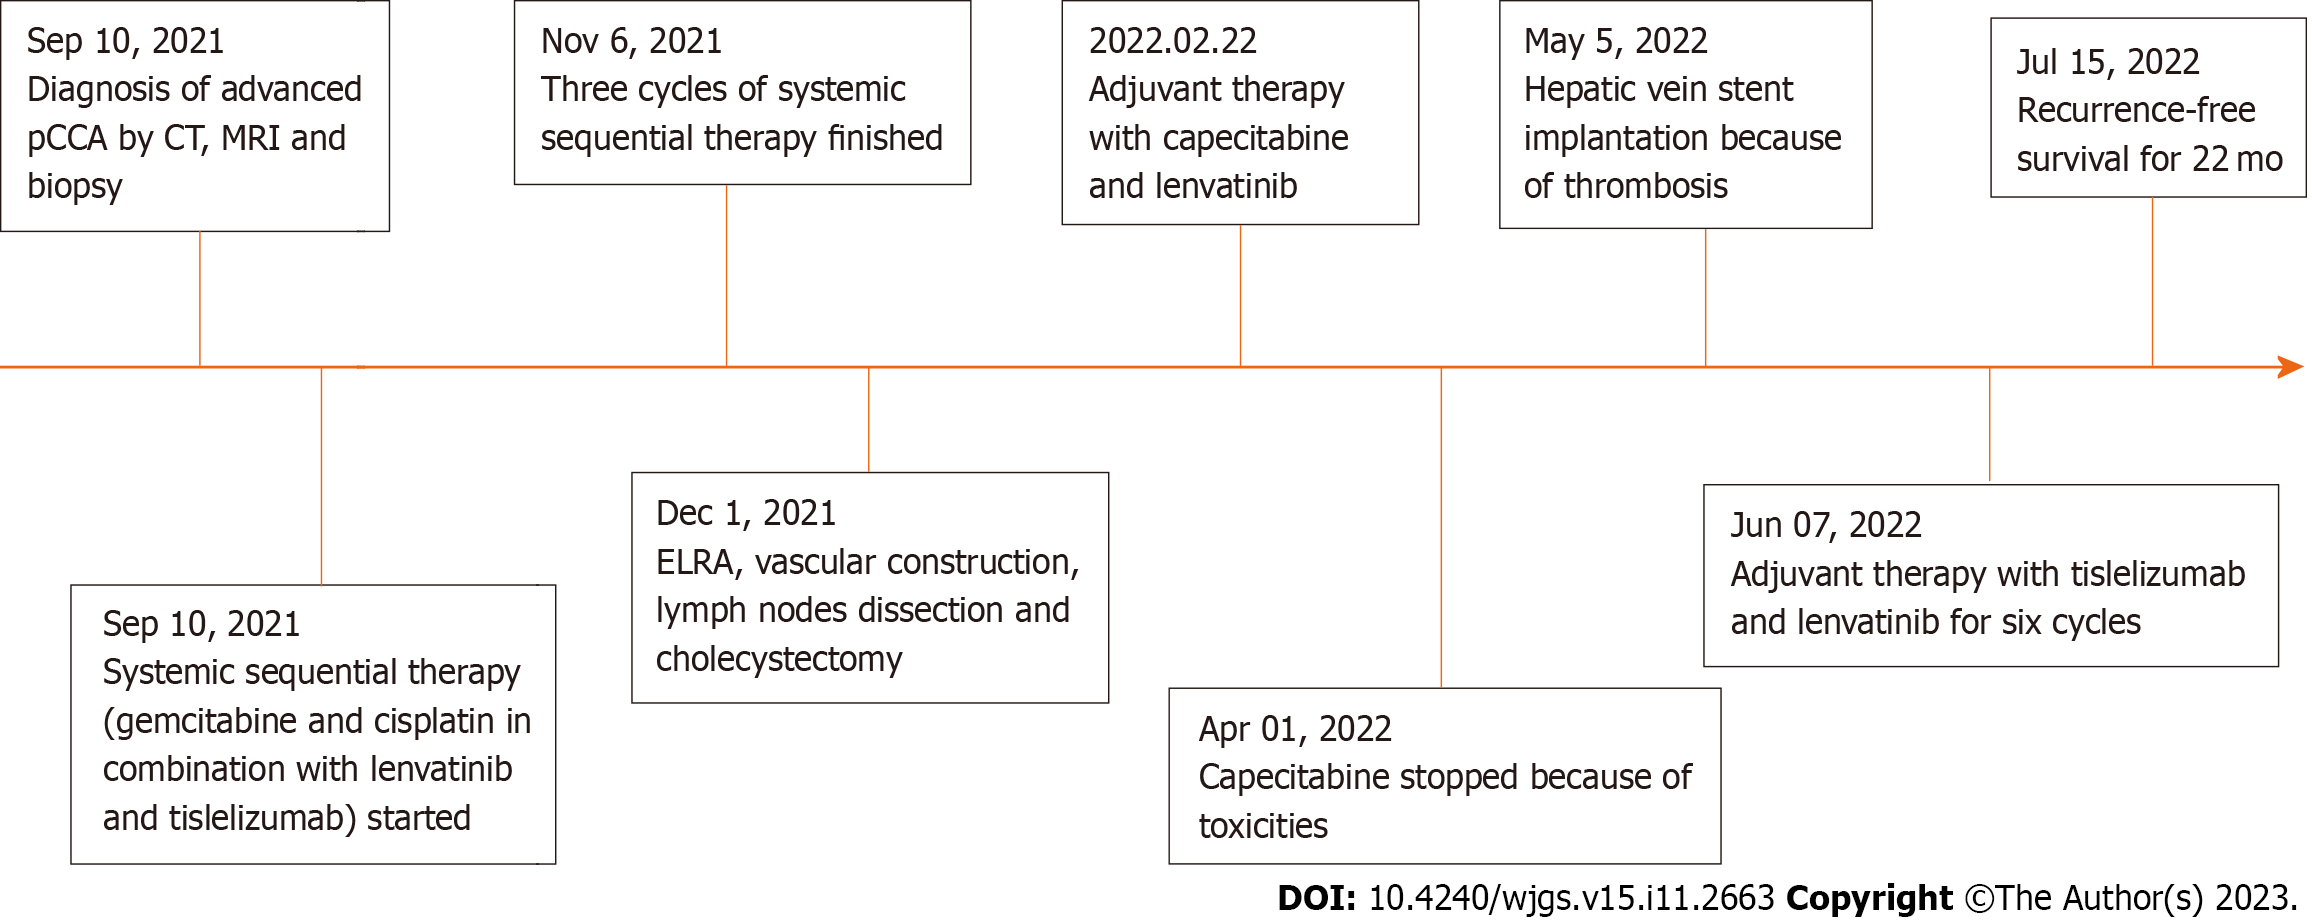
Figure 6 Timeline of the initial diagnosis, systemic therapy, surgery, adjuvant therapy and follow-up.
ELRA: Ex vivo liver resection and autotransplantation; Pcca: Perihilar cholangiocarcinoma; CT: Computed tomography; MRI: Magnetic resonance imaging.
- Citation: Hu CL, Han X, Gao ZZ, Zhou B, Tang JL, Pei XR, Lu JN, Xu Q, Shen XP, Yan S, Ding Y. Systematic sequential therapy for ex vivo liver resection and autotransplantation: A case report and review of literature. World J Gastrointest Surg 2023; 15(11): 2663-2673
- URL: https://www.wjgnet.com/1948-9366/full/v15/i11/2663.htm
- DOI: https://dx.doi.org/10.4240/wjgs.v15.i11.2663


