Copyright
©The Author(s) 2023.
World J Gastrointest Surg. Nov 27, 2023; 15(11): 2490-2499
Published online Nov 27, 2023. doi: 10.4240/wjgs.v15.i11.2490
Published online Nov 27, 2023. doi: 10.4240/wjgs.v15.i11.2490
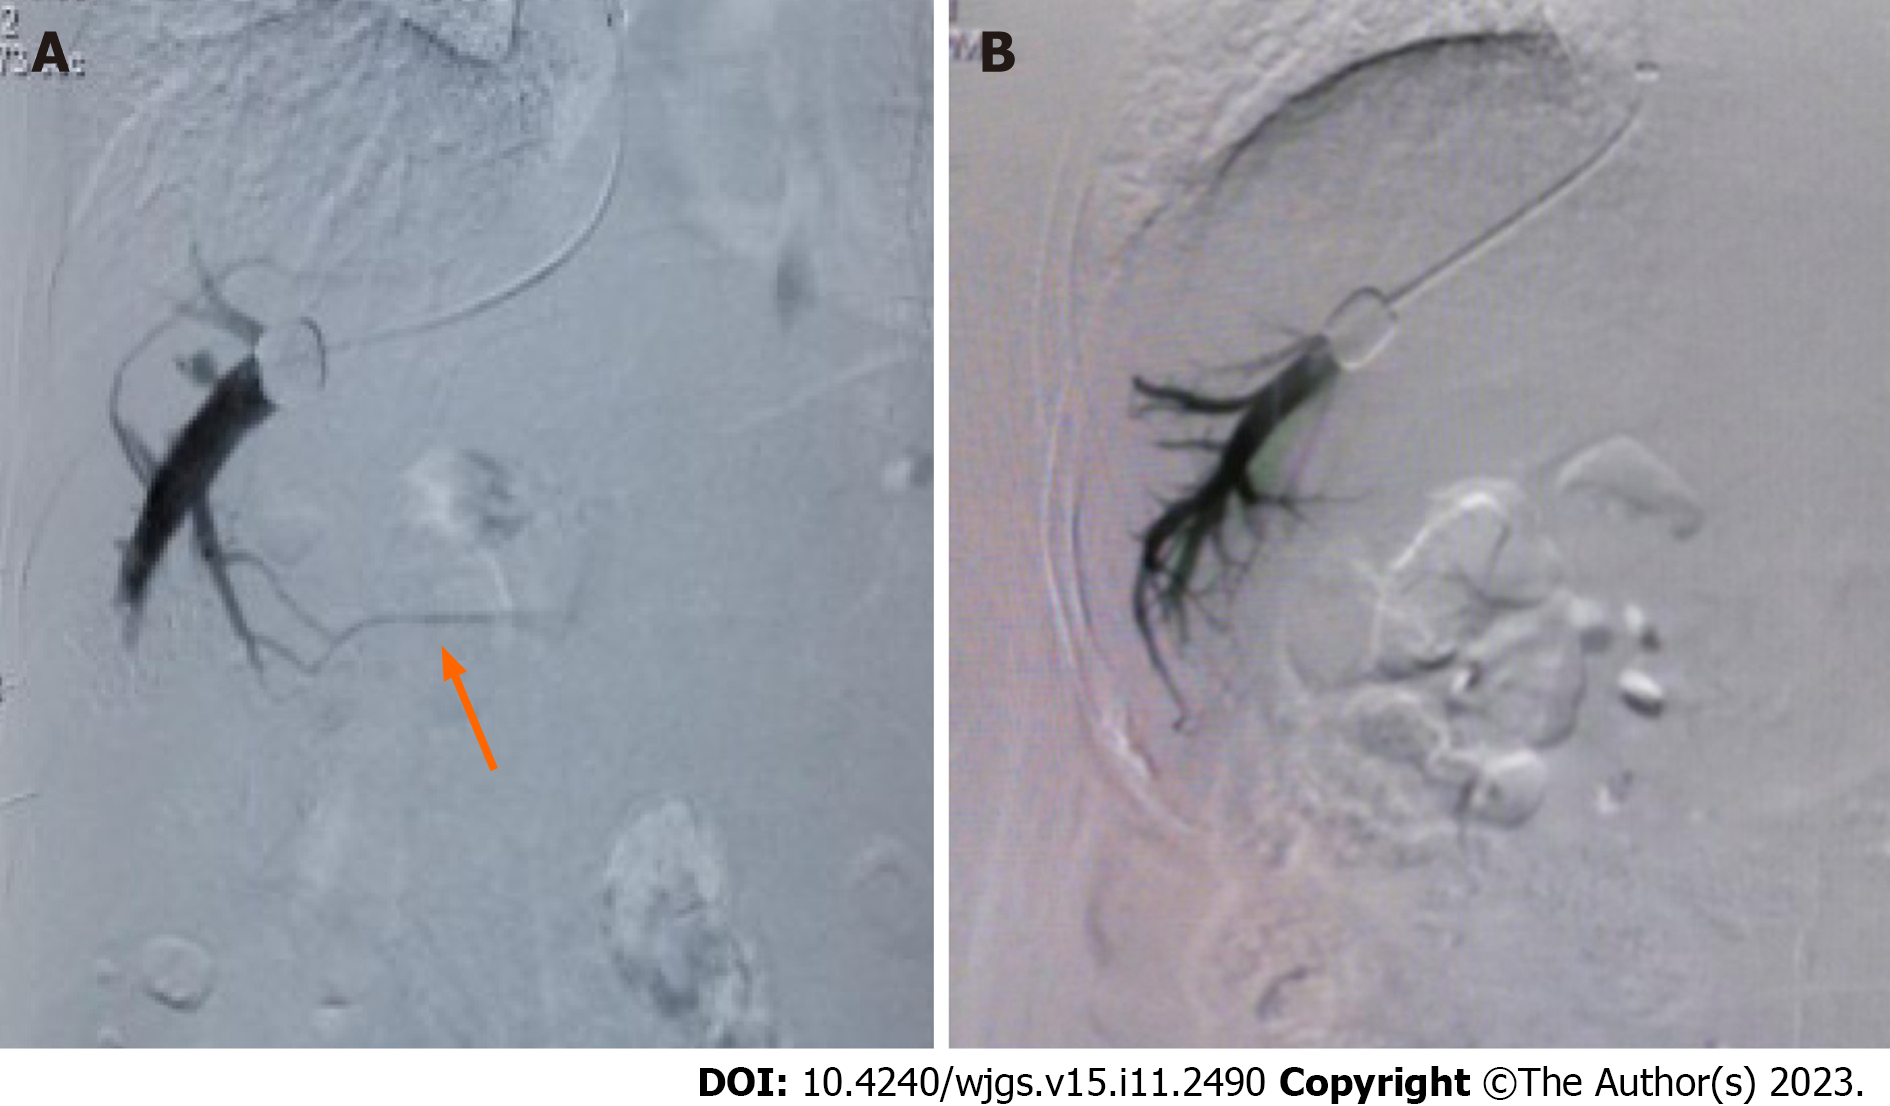
Figure 1 Hepatic venography during transjugular intrahepatic portosystemic shunt.
A: Hepatic vein collateral branches (orange arrow) as shown on venography imagery; B: Venography image demonstrating the absence of hepatic vein collateral branch.
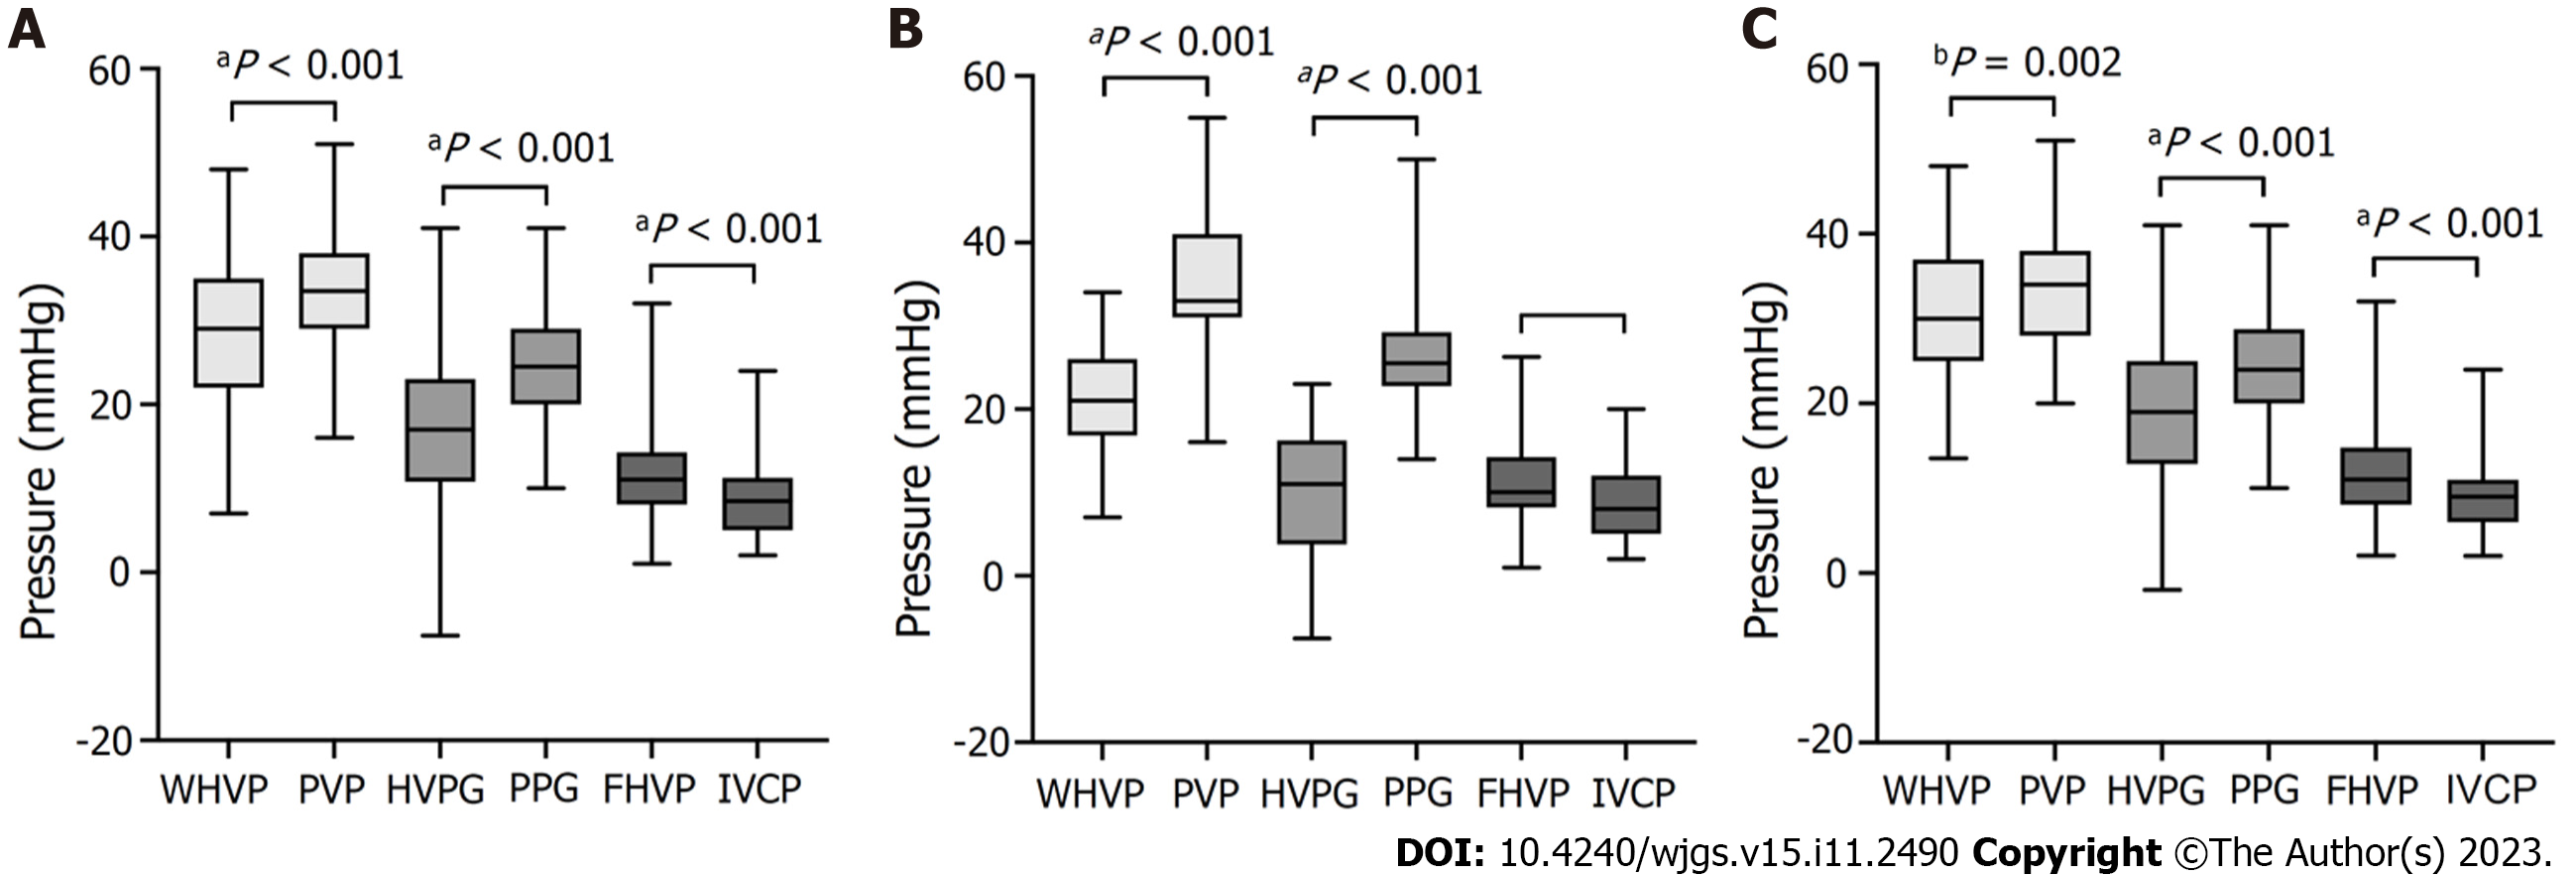
Figure 2 Box plots of pressure differences during transjugular intrahepatic portosystemic shunt.
A: All patients (n = 134); B: With hepatic vein collateral branches (n = 26); C: With no hepatic vein collateral branch (n = 108). P values were calculated by the paired t-test. WHVP: Wedged hepatic venous pressure; PVP: Portal venous pressure; HVPG: Hepatic venous pressure gradient; PPG: Portal venous pressure gradient; FHVP: Free hepatic venous pressure; IVCP: Inferior vena cava pressure.
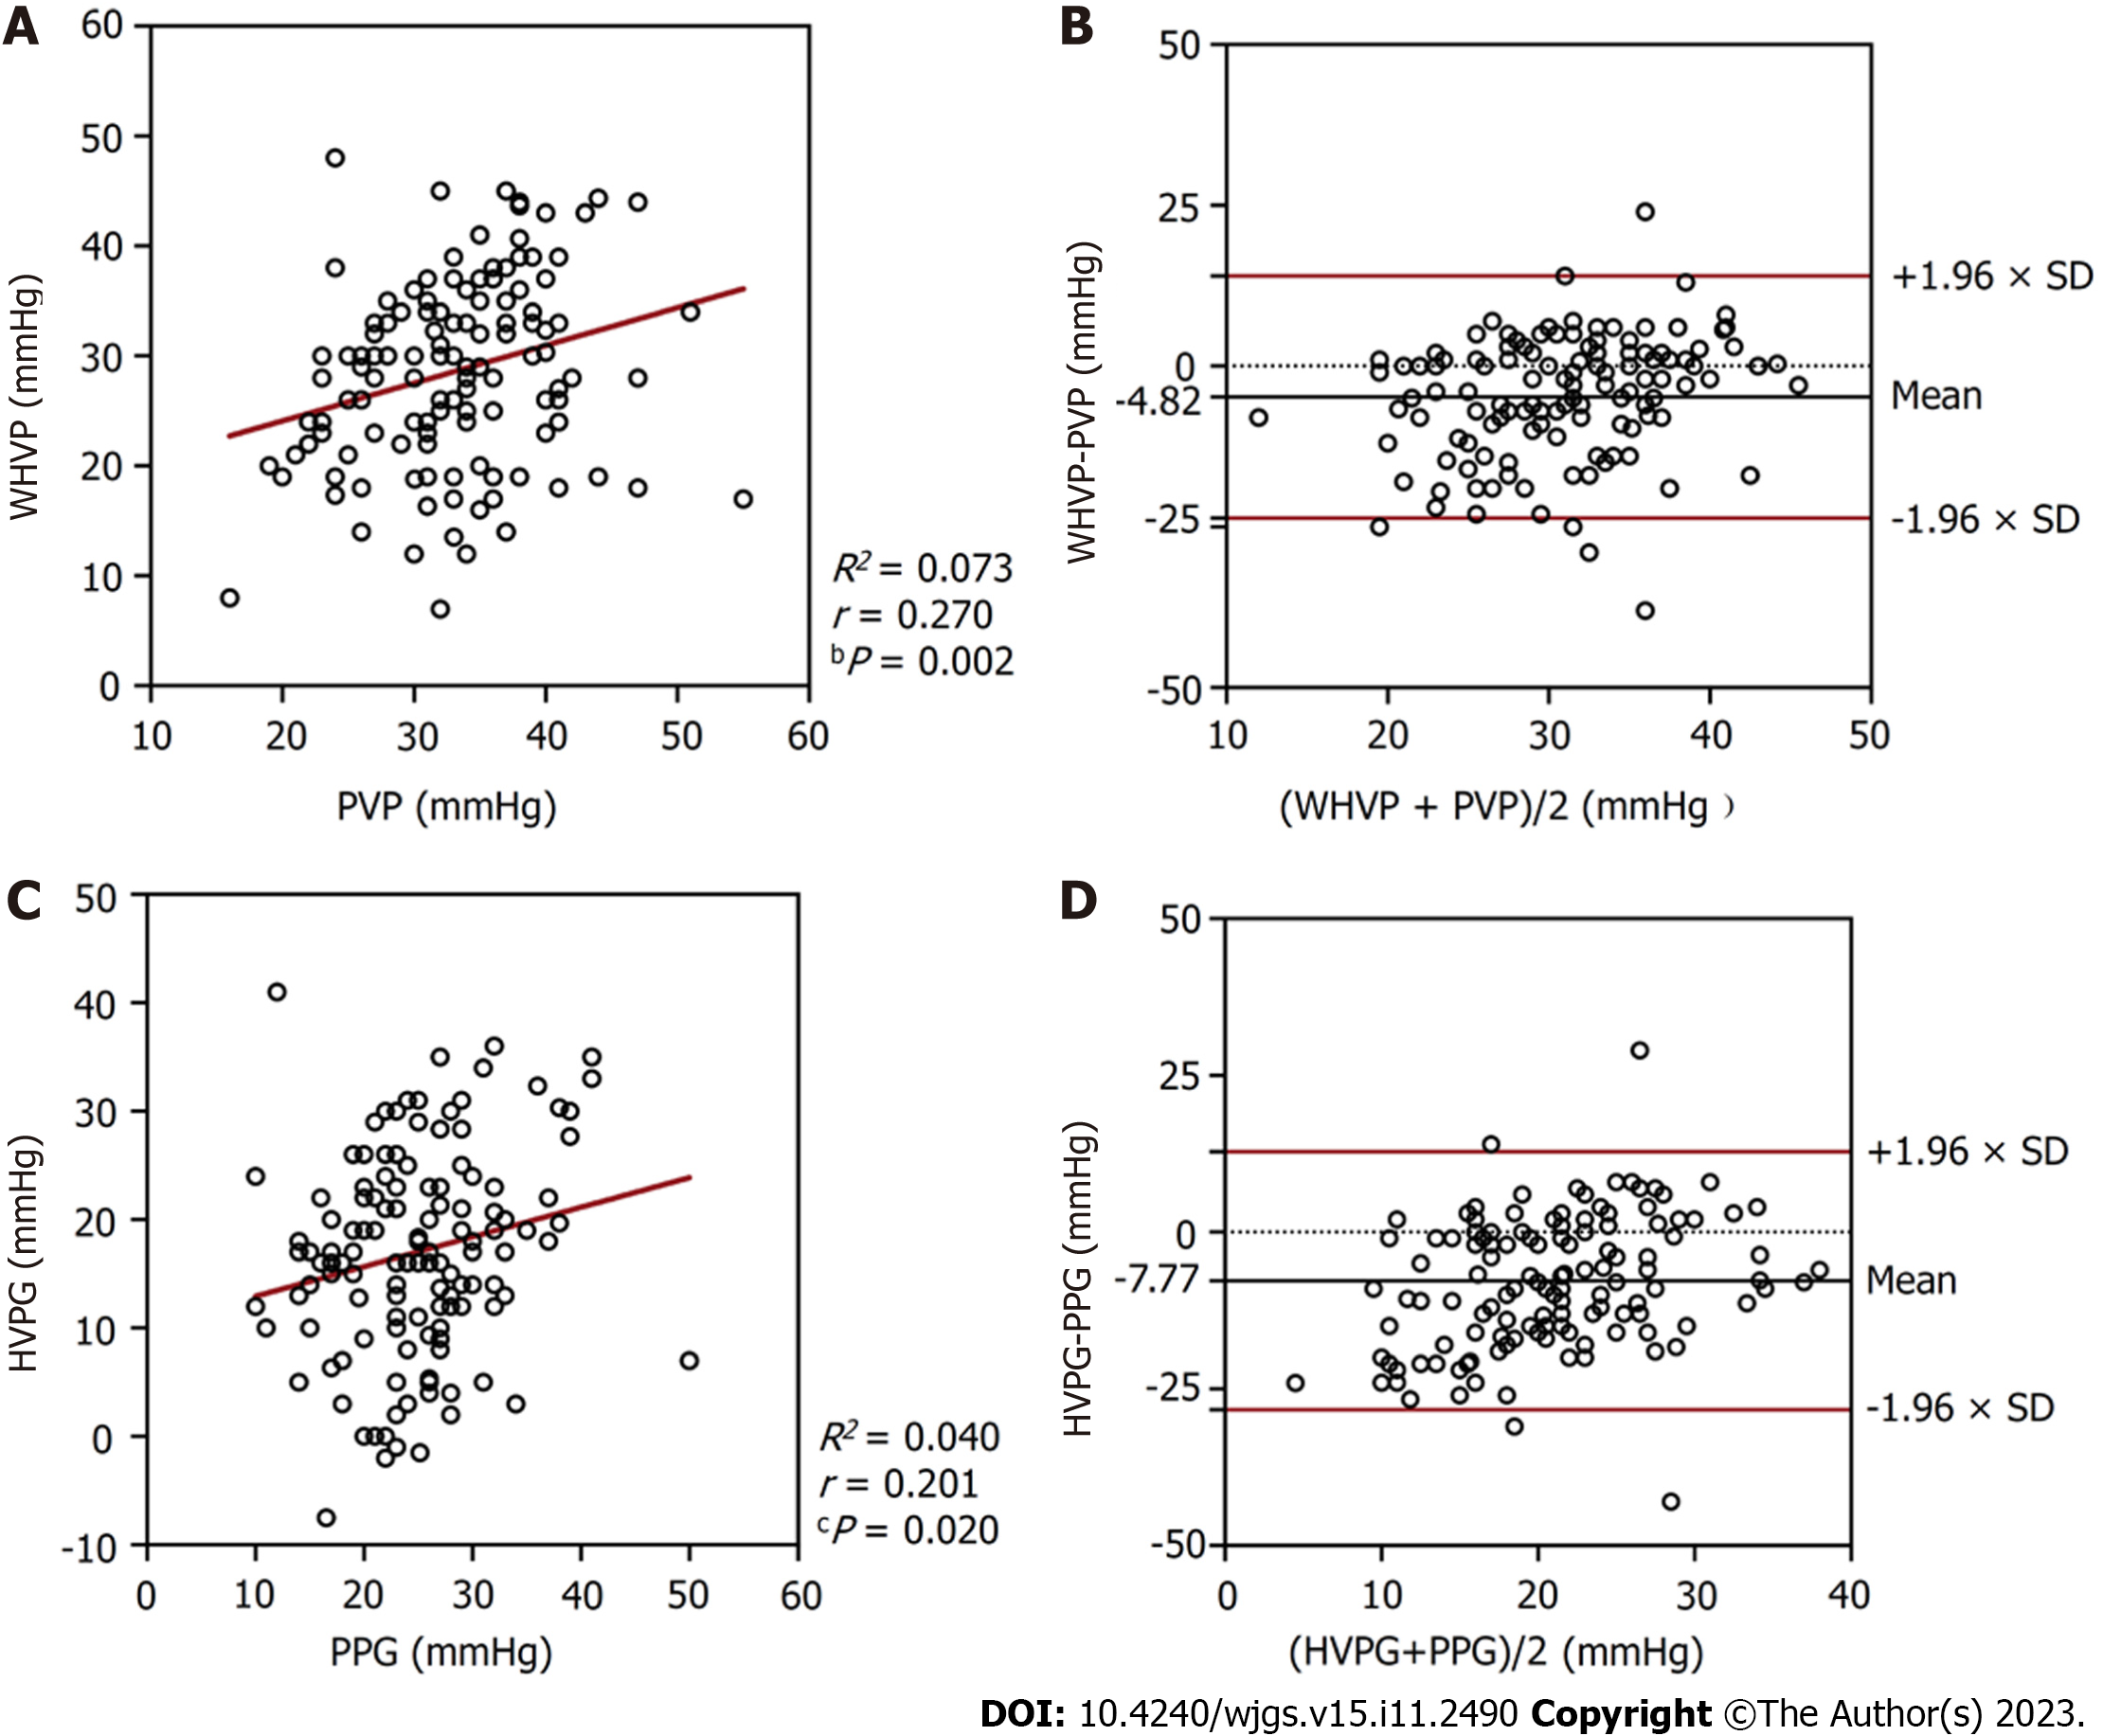
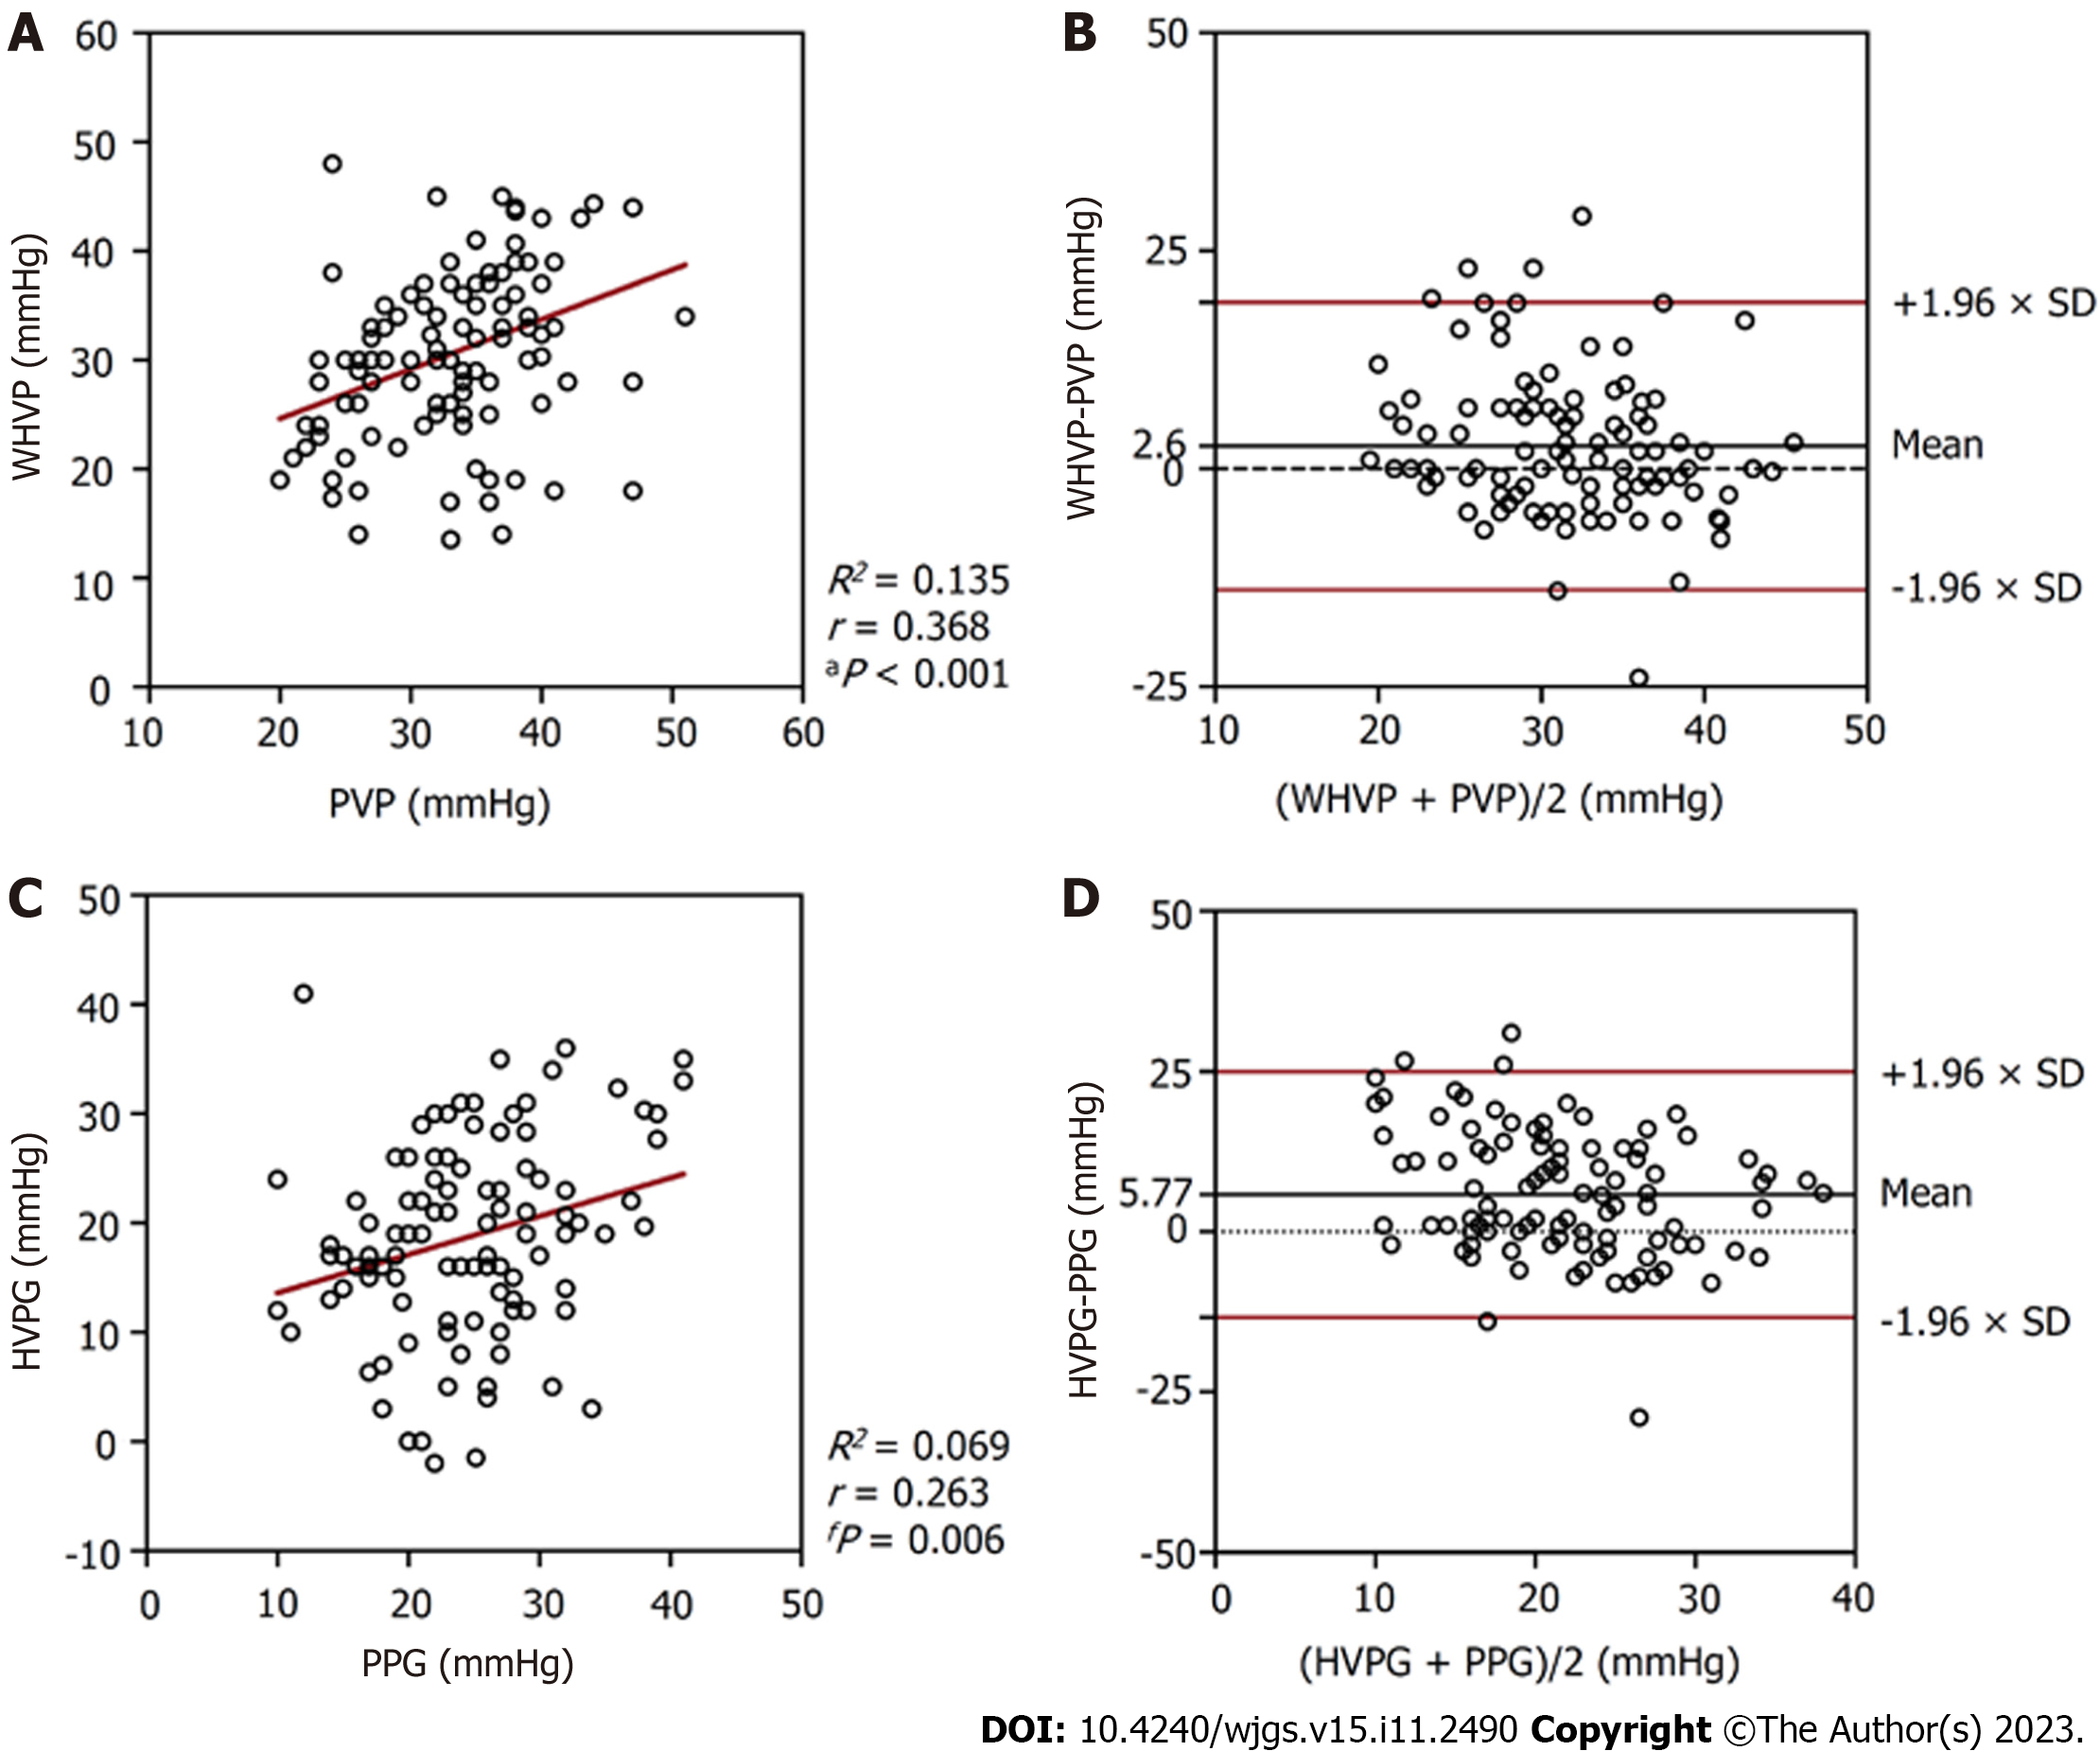
Figure 3 Relationships between the pressures measured in all patients (n = 134).
A: A scatterplot of wedged hepatic venous pressure (WHVP) against portal venous pressure (PVP); B: A Bland-Altman plot to assess agreement between WHVP and PVP; C: A scatterplot of hepatic venous pressure gradient (HVPG) against portal venous pressure gradient (PPG); D: A Bland-Altman plot to assess agreement between HVPG and PPG. WHVP: Wedged hepatic venous pressure; PVP: Portal venous pressure; HVPG: Hepatic venous pressure gradient; PPG: Portal venous pressure gradient.
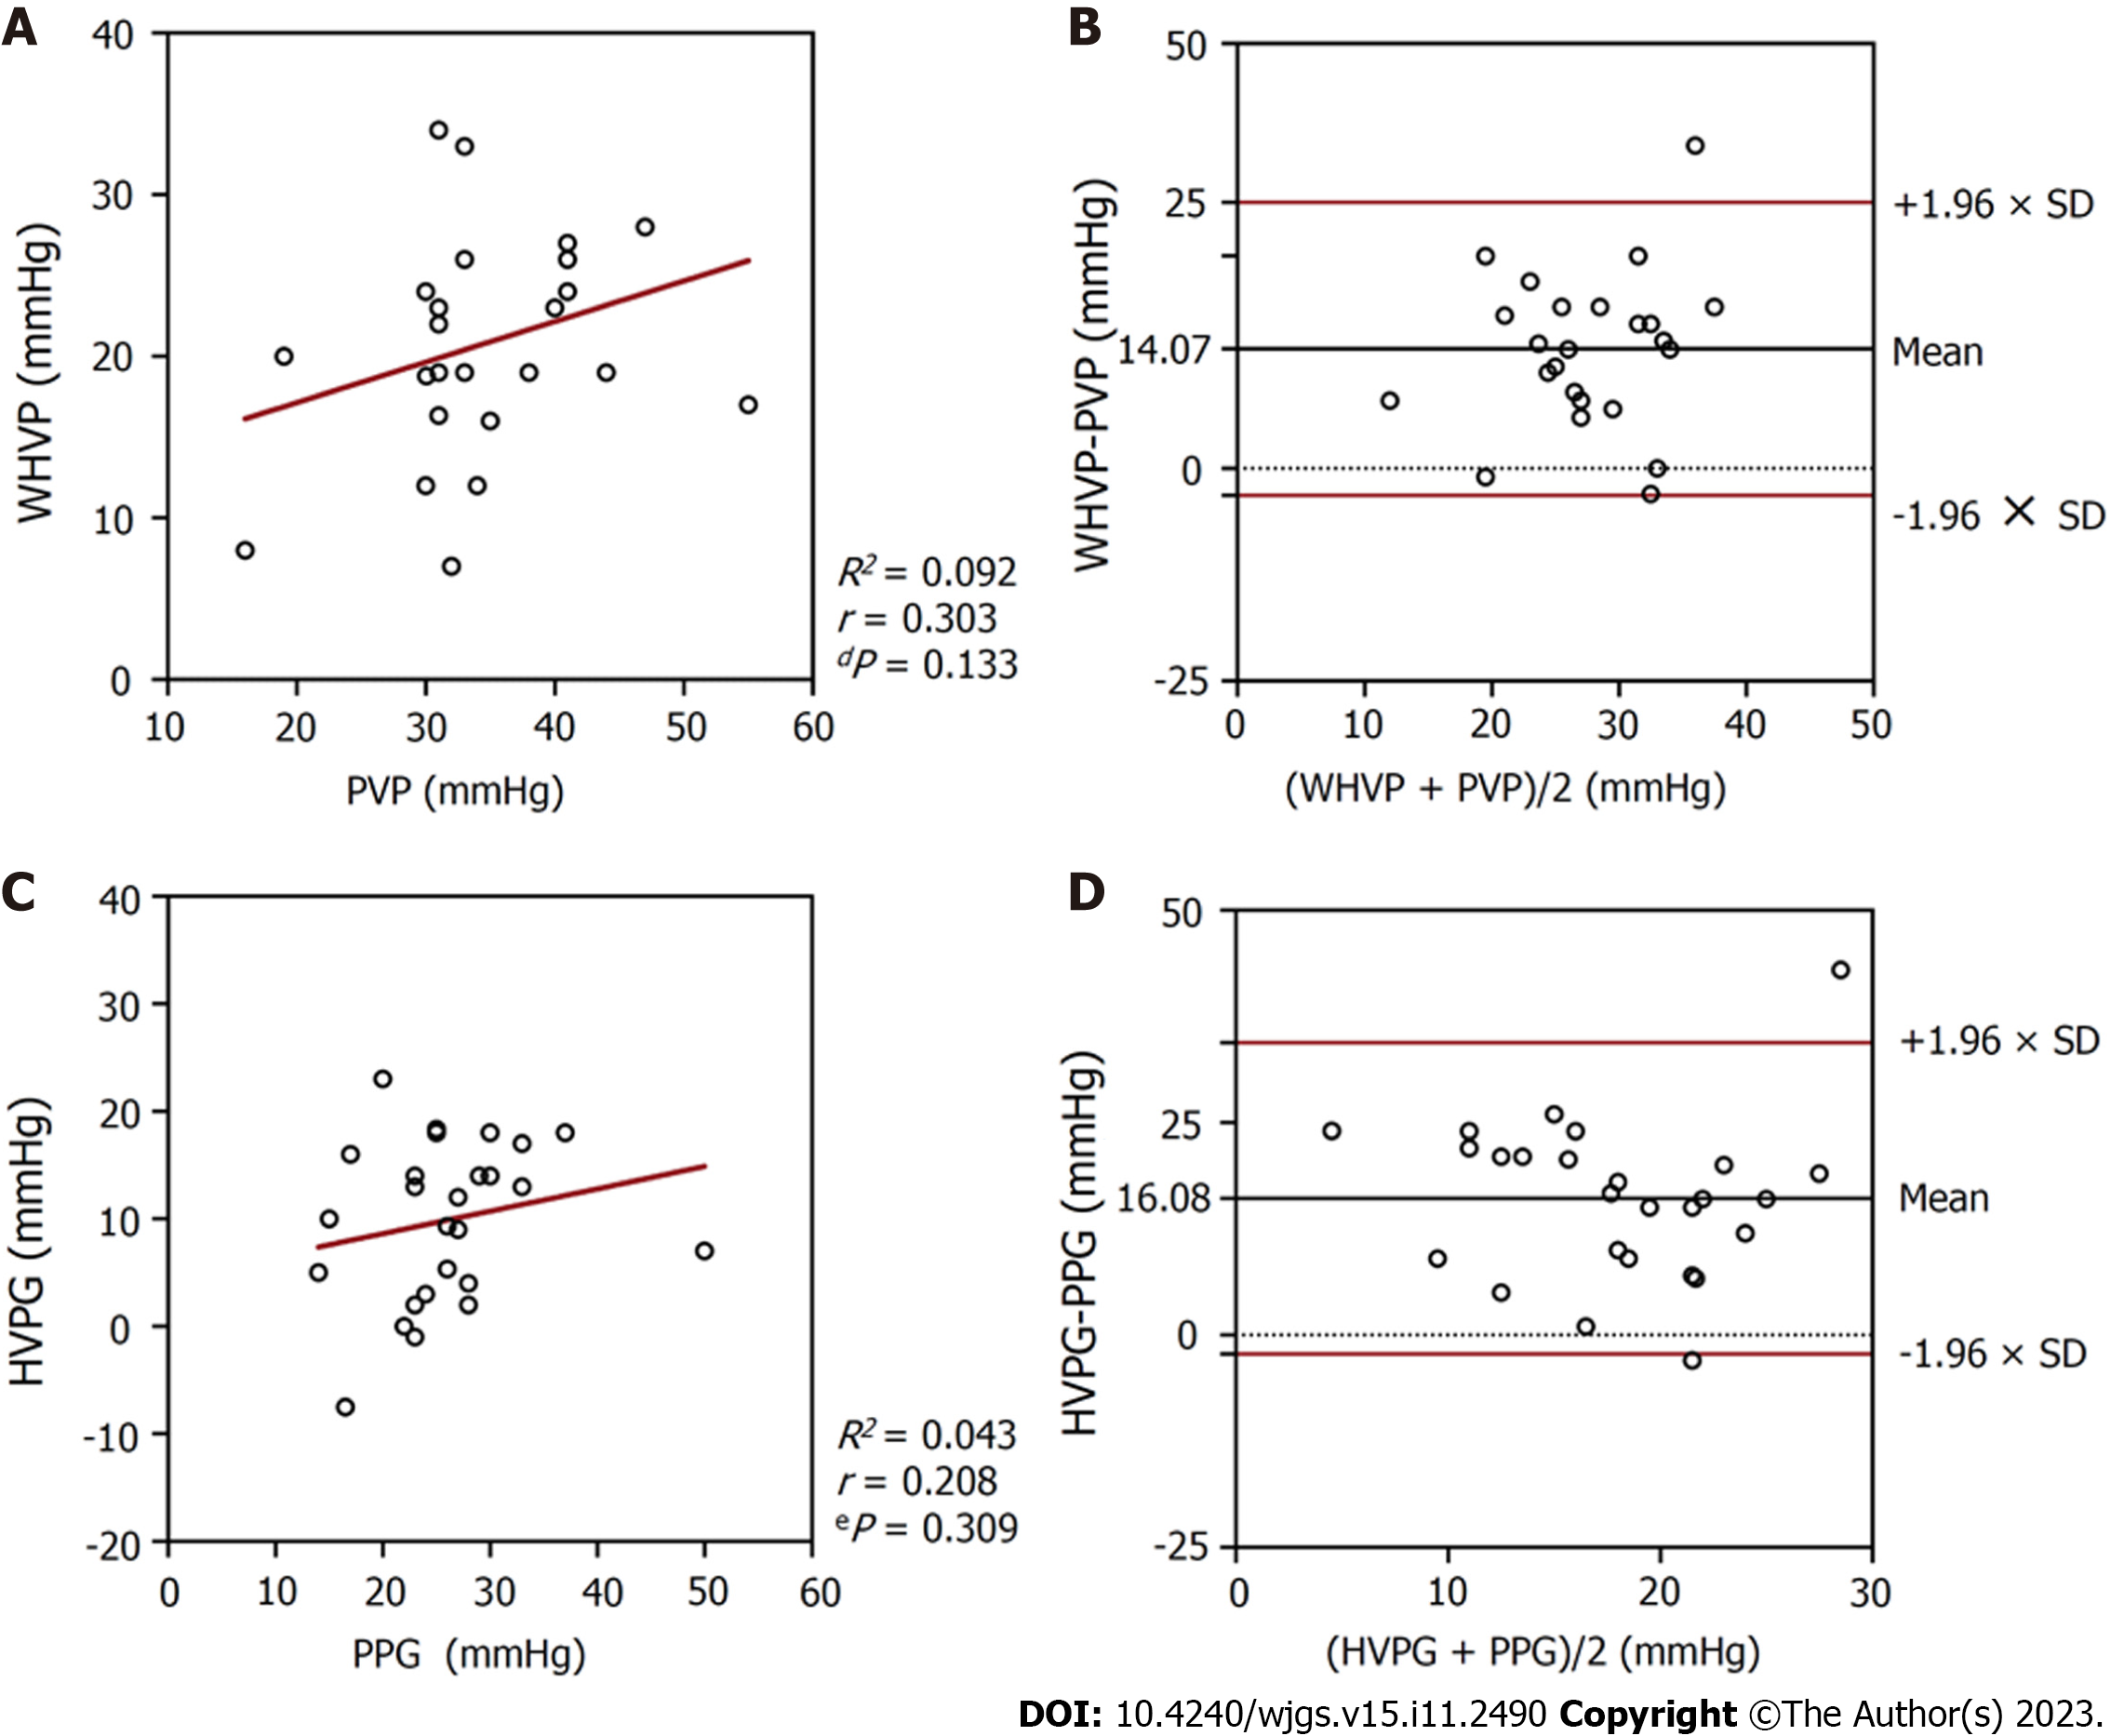
Figure 4 Relationships between the pressures measured in patients with hepatic vein collateral branches (n = 26).
A: A scatterplot of wedged hepatic venous pressure (WHVP) against portal venous pressure (PVP); B: A Bland-Altman plot to assess agreement between WHVP and PVP; C: A scatterplot of hepatic venous pressure gradient (HVPG) against portal venous pressure gradient (PPG); D: A Bland-Altman plot to assess agreement between HVPG and PPG. WHVP: Wedged hepatic venous pressure; PVP: Portal venous pressure; HVPG: Hepatic venous pressure gradient; PPG: Portal venous pressure gradient.
Figure 5 Relationships between the pressures measured in patients with no hepatic vein collateral branch (n = 108).
A: A scatterplot of wedged hepatic venous pressure (WHVP) against portal venous pressure (PVP); B: A Bland-Altman plot to assess agreement between WHVP and PVP; C: A scatterplot of hepatic venous pressure gradient (HVPG) against portal venous pressure gradient (PPG); D: A Bland-Altman plot to assess agreement between HVPG and PPG. WHVP: Wedged hepatic venous pressure; PVP: Portal venous pressure; HVPG: Hepatic venous pressure gradient; PPG: Portal venous pressure gradient.
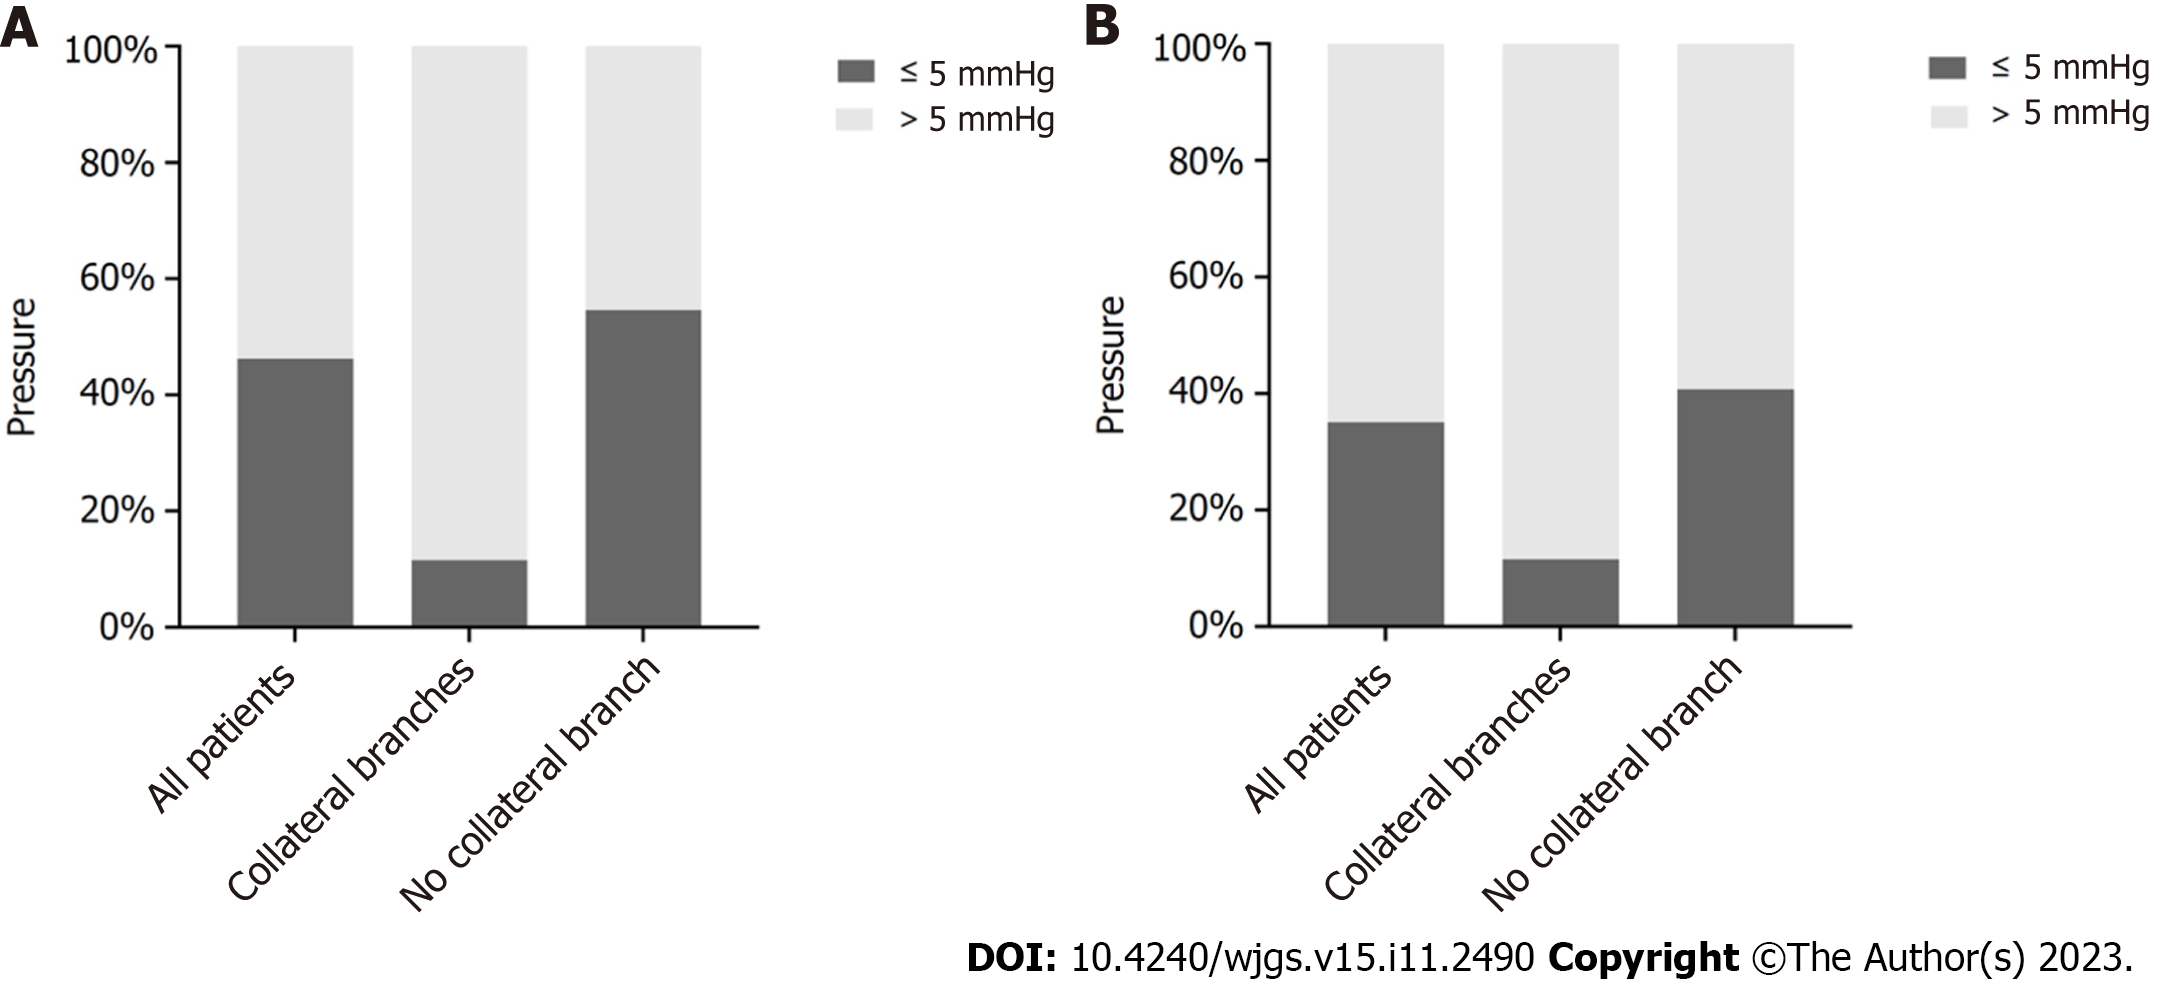
Figure 6 Difference between the pressures measured in patients with alcoholic cirrhosis and portal hypertension.
A: The difference between wedged hepatic venous pressure and portal venous pressure. B: The difference between hepatic venous pressure gradient and portal venous pressure gradient.
- Citation: Zhang D, Wang T, Yue ZD, Wang L, Fan ZH, Wu YF, Liu FQ. Hepatic venous pressure gradient: Inaccurately estimates portal venous pressure gradient in alcoholic cirrhosis and portal hypertension. World J Gastrointest Surg 2023; 15(11): 2490-2499
- URL: https://www.wjgnet.com/1948-9366/full/v15/i11/2490.htm
- DOI: https://dx.doi.org/10.4240/wjgs.v15.i11.2490


