Copyright
©The Author(s) 2023.
World J Gastrointest Surg. Oct 27, 2023; 15(10): 2154-2170
Published online Oct 27, 2023. doi: 10.4240/wjgs.v15.i10.2154
Published online Oct 27, 2023. doi: 10.4240/wjgs.v15.i10.2154
Figure 1 Genotypes of telomerase-associated protein 1 (TEP1) (rs1713449), TEP1 (rs938886), and recQ like helicase 5 (RECQL5) (rs820196) identified by two-dimensional polymerase chain reaction in a single tube.
Subtype color indicates the type of reporter dye: Blue-fluorescein amidite; green-hexachloro-fluorescein. A: All three mutations identified were heterozygous; B: TEP1 (rs1713449) and TEP1 (rs938886) were homozygous for the TT and CC genotypes, respectively, and RECQL5 (rs820196) was heterozygous for the TC genotype. TEP1: Telomerase-associated protein 1; RECQL5: RecQ like helicase 5.
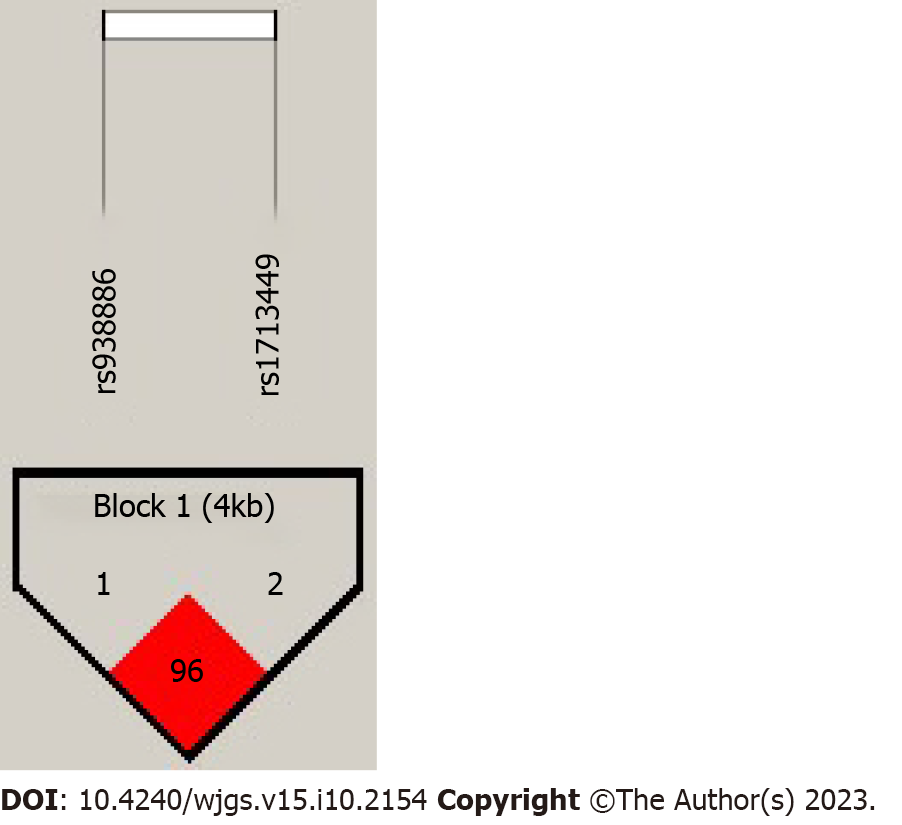
Figure 2 Haplotype block map for candidate single nucleotide polymorphisms in the telomerase-associated protein 1 gene.
Two single nucleotide polymorphisms in the haplotype map (rs938886 and rs1713449) were in significant linkage disequilibrium (LD). A standard color frame was used to illustrate the LD pattern.
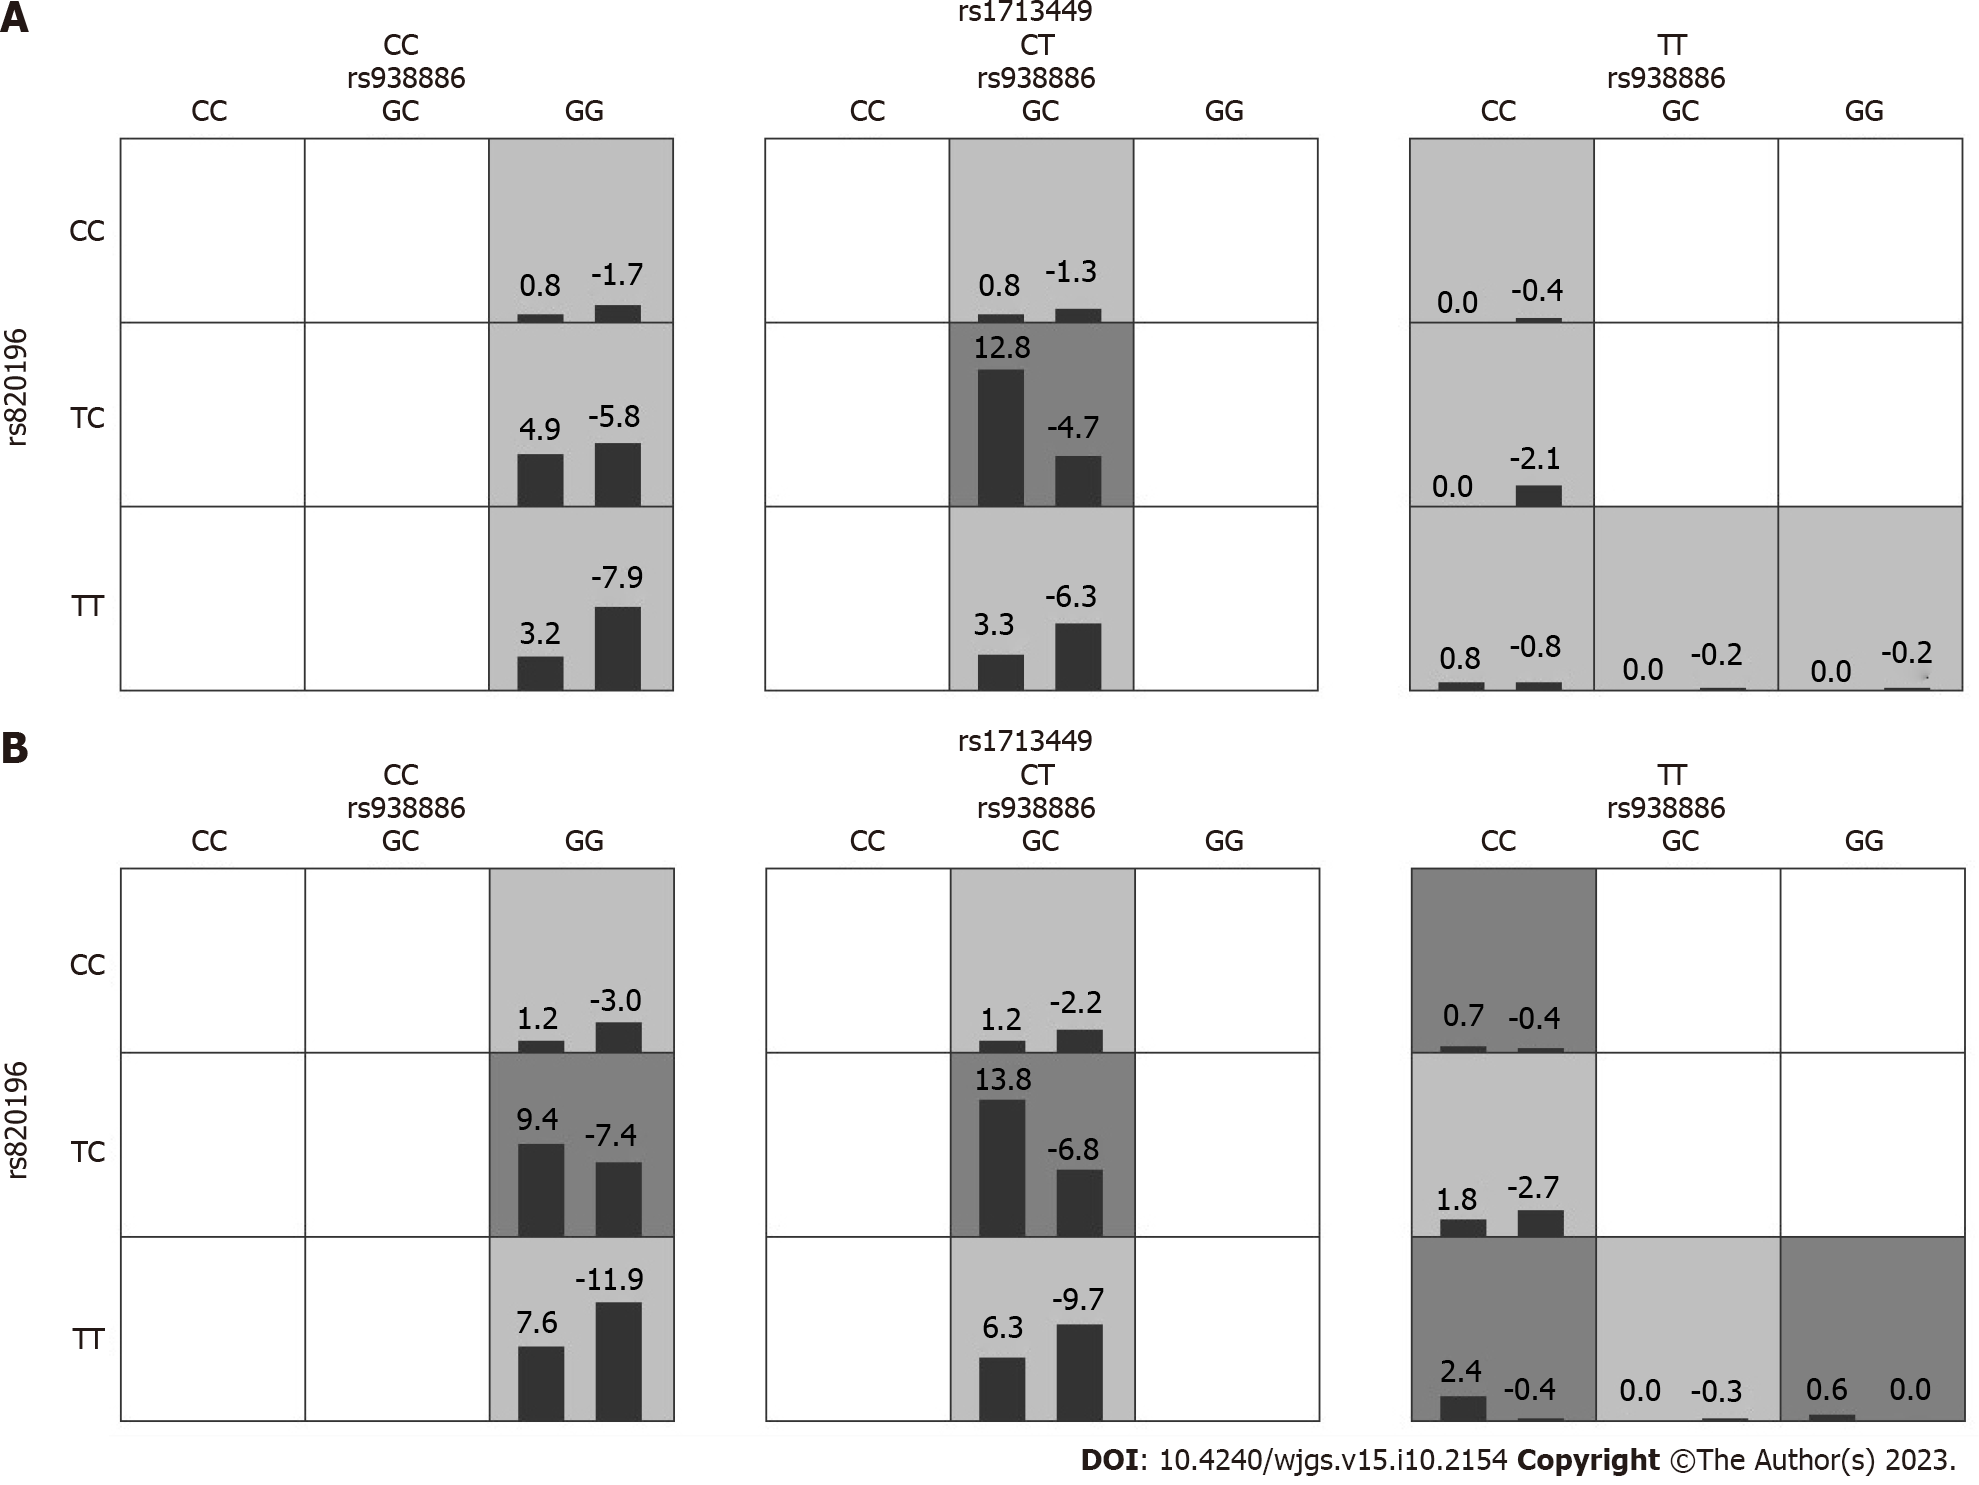
Figure 3 Single nucleotide polymorphism-single nucleotide polymorphism interaction of three loci.
A: heart rate variability (HRV) cutoff value = 30%; B: HRV cutoff value = 15%. For each multifactor cell, the score of patients with HRV ≥ 30% or 15% is displayed on the left bar and the score of patients with HRV < 30% or 15% is displayed on the right bar. The high-risk interaction genotype was assigned as 1 and the low-risk interaction genotype was assigned as 0 in the multivariable logistic regression analyses. Dark gray cells indicate high-risk combinations, and light gray cells indicate low-risk combinations.
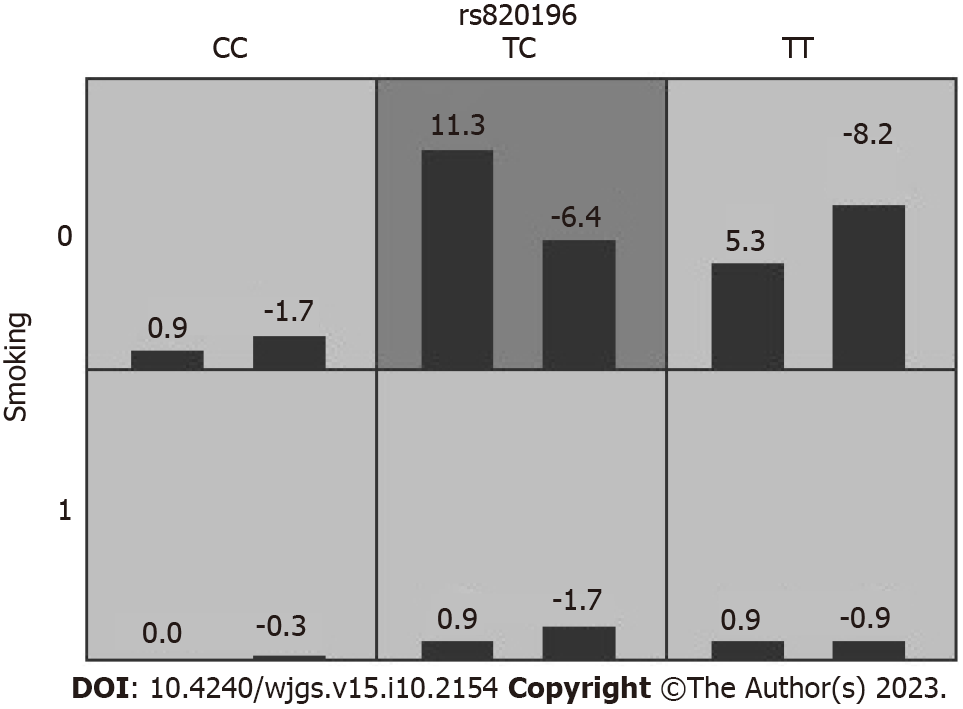
Figure 4 Interaction between rs820196 and smoking in patients grouped by the 30% heart rate variability cutoff.
For each multifactor cell, the score of patients with heart rate variability (HRV) ≥ 30% is displayed on the left bar and the score of patients with HRV < 30% is displayed on the right bar. The high-risk interaction genotype was assigned as one and the low-risk interaction genotype was assigned as zero in the multivariable logistic regression analyses. Dark gray cells indicate high-risk combinations and light gray cells indicate low-risk combinations. No smoking = 0; smoking = 1.
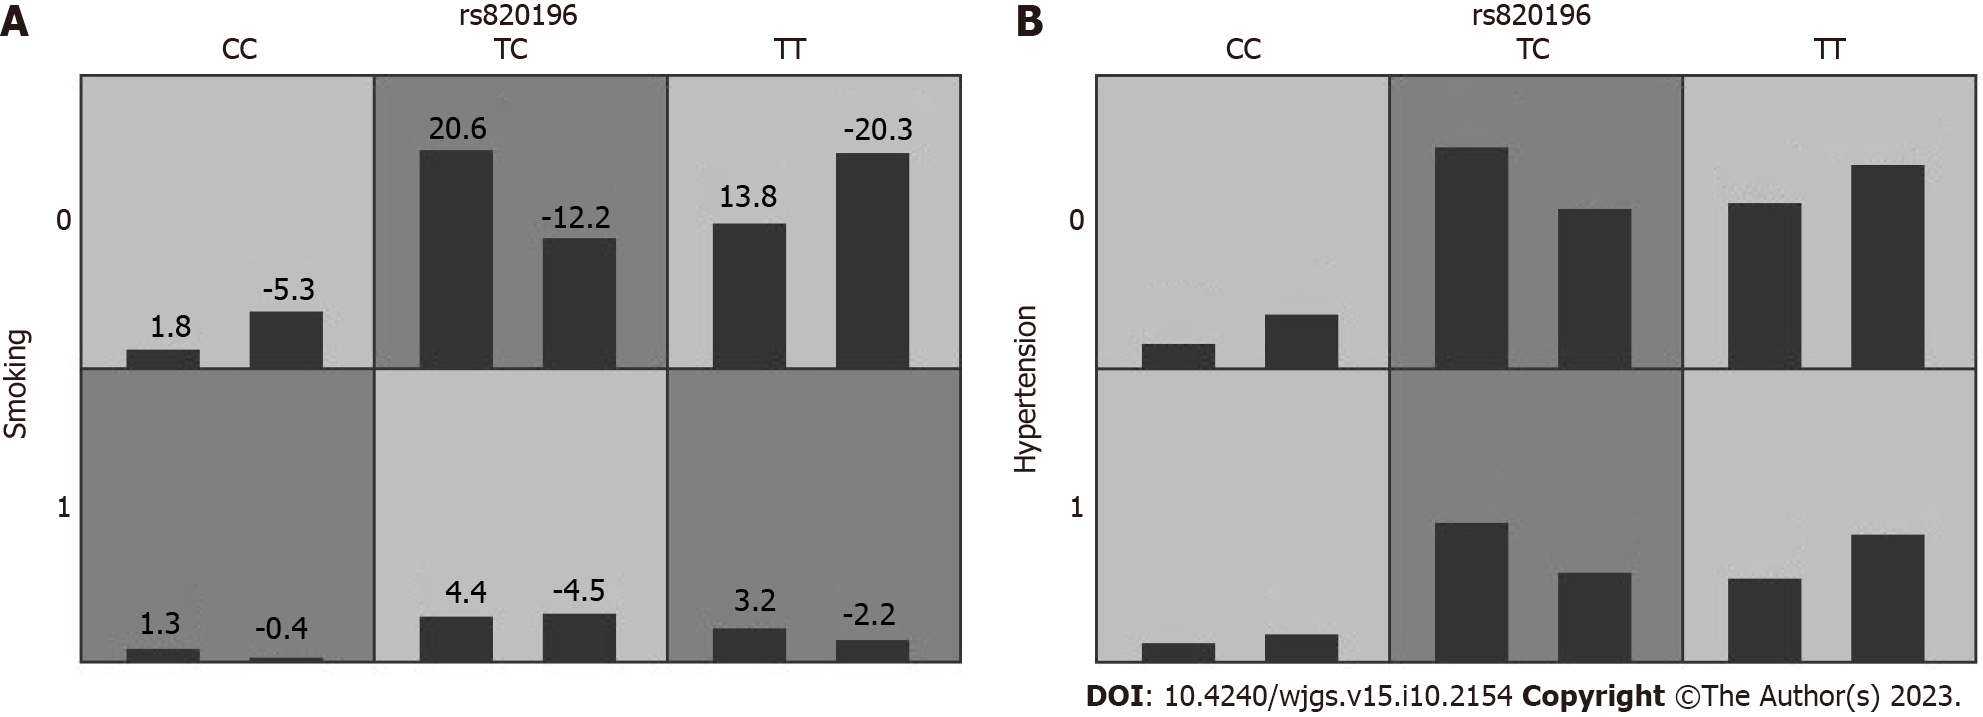
Figure 5 Interaction between rs820196 and smoking and hypertension in patients grouped by the 15% heart rate variability cutoff.
A: Rs820196-smoking interaction. No smoking = 0; smoking = 1; B: Rs820196-hypertension interaction. No hypertension = 0; hypertension = 1. For each multifactor cell, the score of patients with heart rate variability (HRV) ≥ 15% is displayed on the left bar and the score of patients with HRV < 15% is displayed on the right bar. The high-risk interaction genotype was assigned as 1 and the low-risk interaction genotype was assigned as 0 in multivariable logistic regression analyses. Dark gray cells indicate high-risk combinations, and light gray cells indicate low-risk combinations.
- Citation: Yao S, Yuan Y, Zhang J, Yu Y, Luo GH. Gene polymorphisms associated with sudden decreases in heart rate during extensive peritoneal lavage with distilled water after gastrectomy. World J Gastrointest Surg 2023; 15(10): 2154-2170
- URL: https://www.wjgnet.com/1948-9366/full/v15/i10/2154.htm
- DOI: https://dx.doi.org/10.4240/wjgs.v15.i10.2154


