Copyright
©The Author(s) 2022.
World J Gastrointest Surg. Aug 27, 2022; 14(8): 809-820
Published online Aug 27, 2022. doi: 10.4240/wjgs.v14.i8.809
Published online Aug 27, 2022. doi: 10.4240/wjgs.v14.i8.809
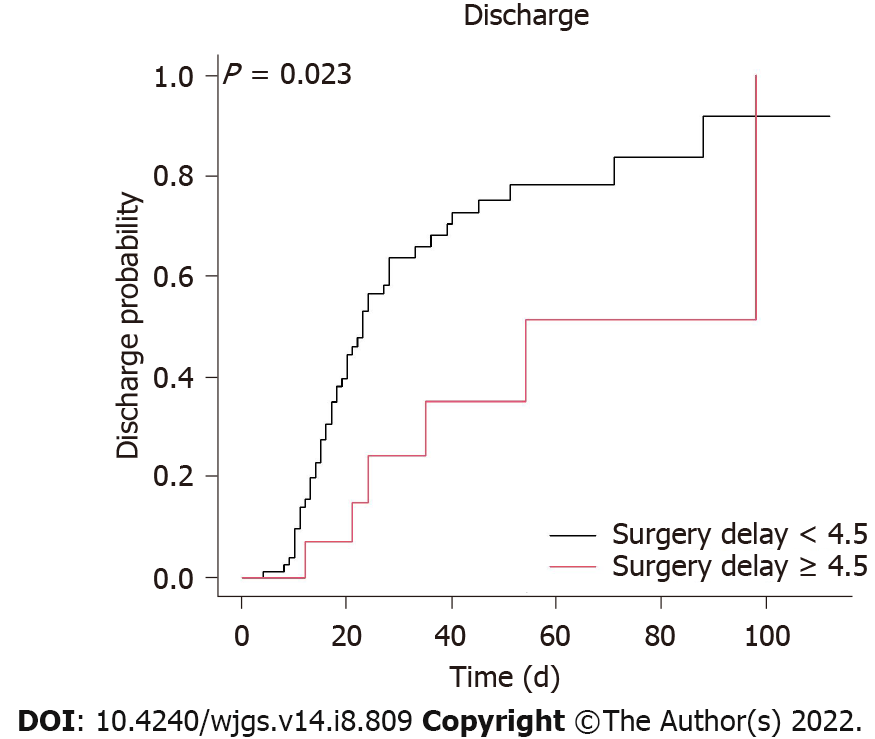
Figure 1 Kaplan–Meier plot for in-hospital survival with a surgery delay less than or not less than 4.
5 d. In patients with a surgery delay < 4.5 d, the 20-d discharge probability was 44.4%, whereas the discharge probability was 50% on day 22. For surgery delays ≥ 4.5 d, the 20-d discharge probability was 14.9%, whereas the discharge probability was 50% on day 54. Surgery delay was defined as the time from the onset of signs and symptoms of acute mesenteric ischemia to surgery.
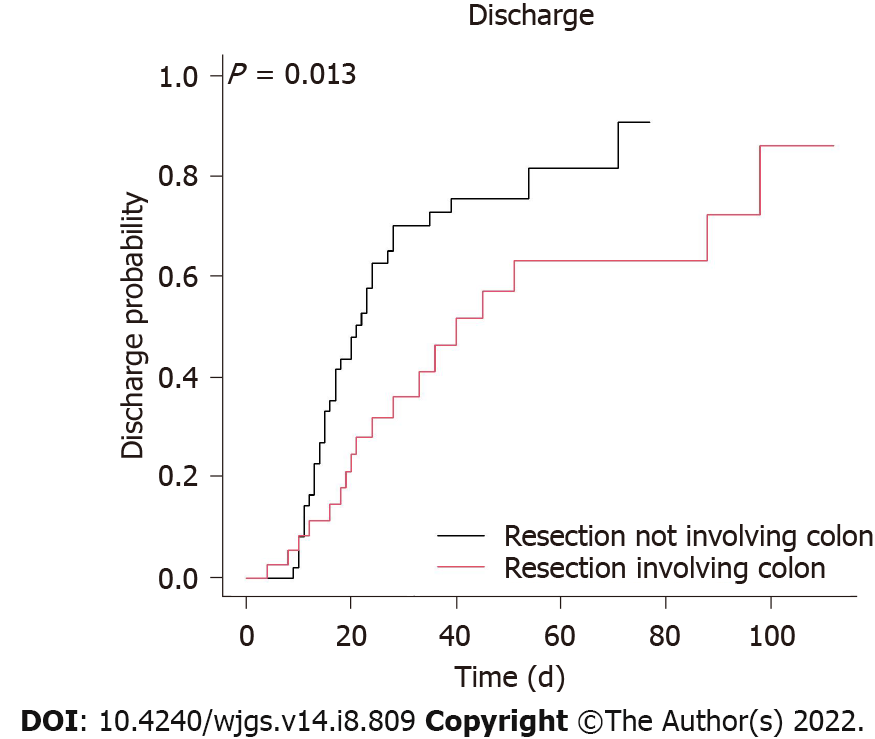
Figure 2 Kaplan–Meier plot for in-hospital survival with bowel resection involving or not involving the colon.
For resection not involving the colon, the 20-d discharge probability was 48.0%, whereas the discharge probability was 50% on day 21. For resection involving the colon, the 20-d discharge probability was 24.7%, whereas the discharge probability was 50% on day 36.
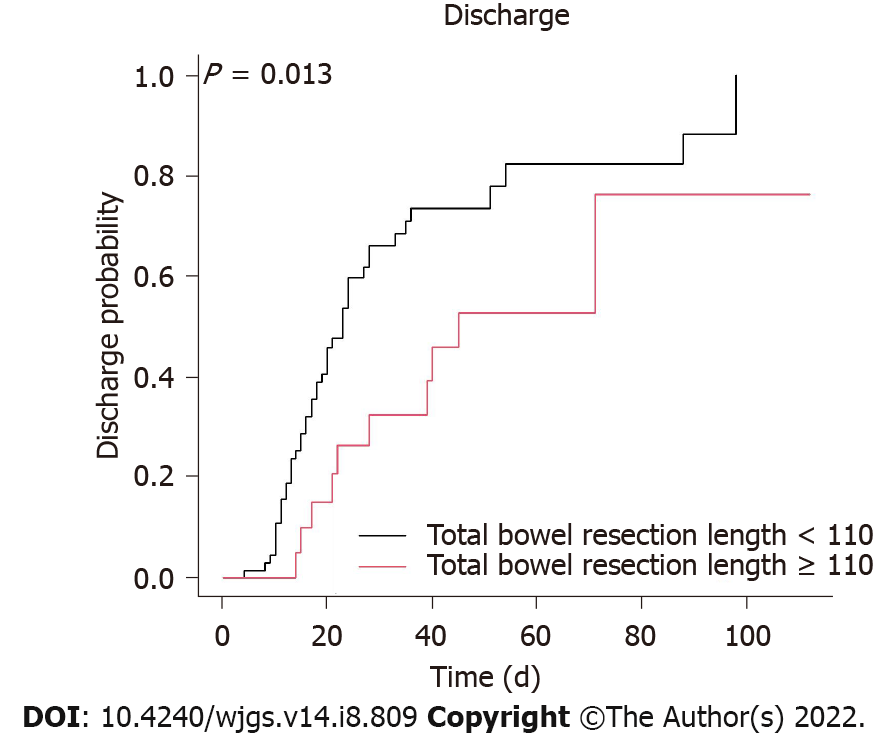
Figure 3 Kaplan–Meier plot for in-hospital survival with a total bowel resection length less than or not less than 110 cm.
In patients with a total bowel resection length < 110 cm, the 20-d discharge probability was 45.8%, whereas the discharge probability was 50% on day 21. In patients with a total bowel resection length ≥ 110 cm, the 20-d discharge probability was 20.1%, whereas the discharge probability was 50% on day 40.
- Citation: Liau SK, Kuo G, Chen CY, Lu YA, Lin YJ, Lee CC, Hung CC, Tian YC, Hsu HH. Identifying survival protective factors for chronic dialysis patients with surgically confirmed acute mesenteric ischemia. World J Gastrointest Surg 2022; 14(8): 809-820
- URL: https://www.wjgnet.com/1948-9366/full/v14/i8/809.htm
- DOI: https://dx.doi.org/10.4240/wjgs.v14.i8.809


