Copyright
©The Author(s) 2022.
World J Gastrointest Surg. Aug 27, 2022; 14(8): 765-777
Published online Aug 27, 2022. doi: 10.4240/wjgs.v14.i8.765
Published online Aug 27, 2022. doi: 10.4240/wjgs.v14.i8.765
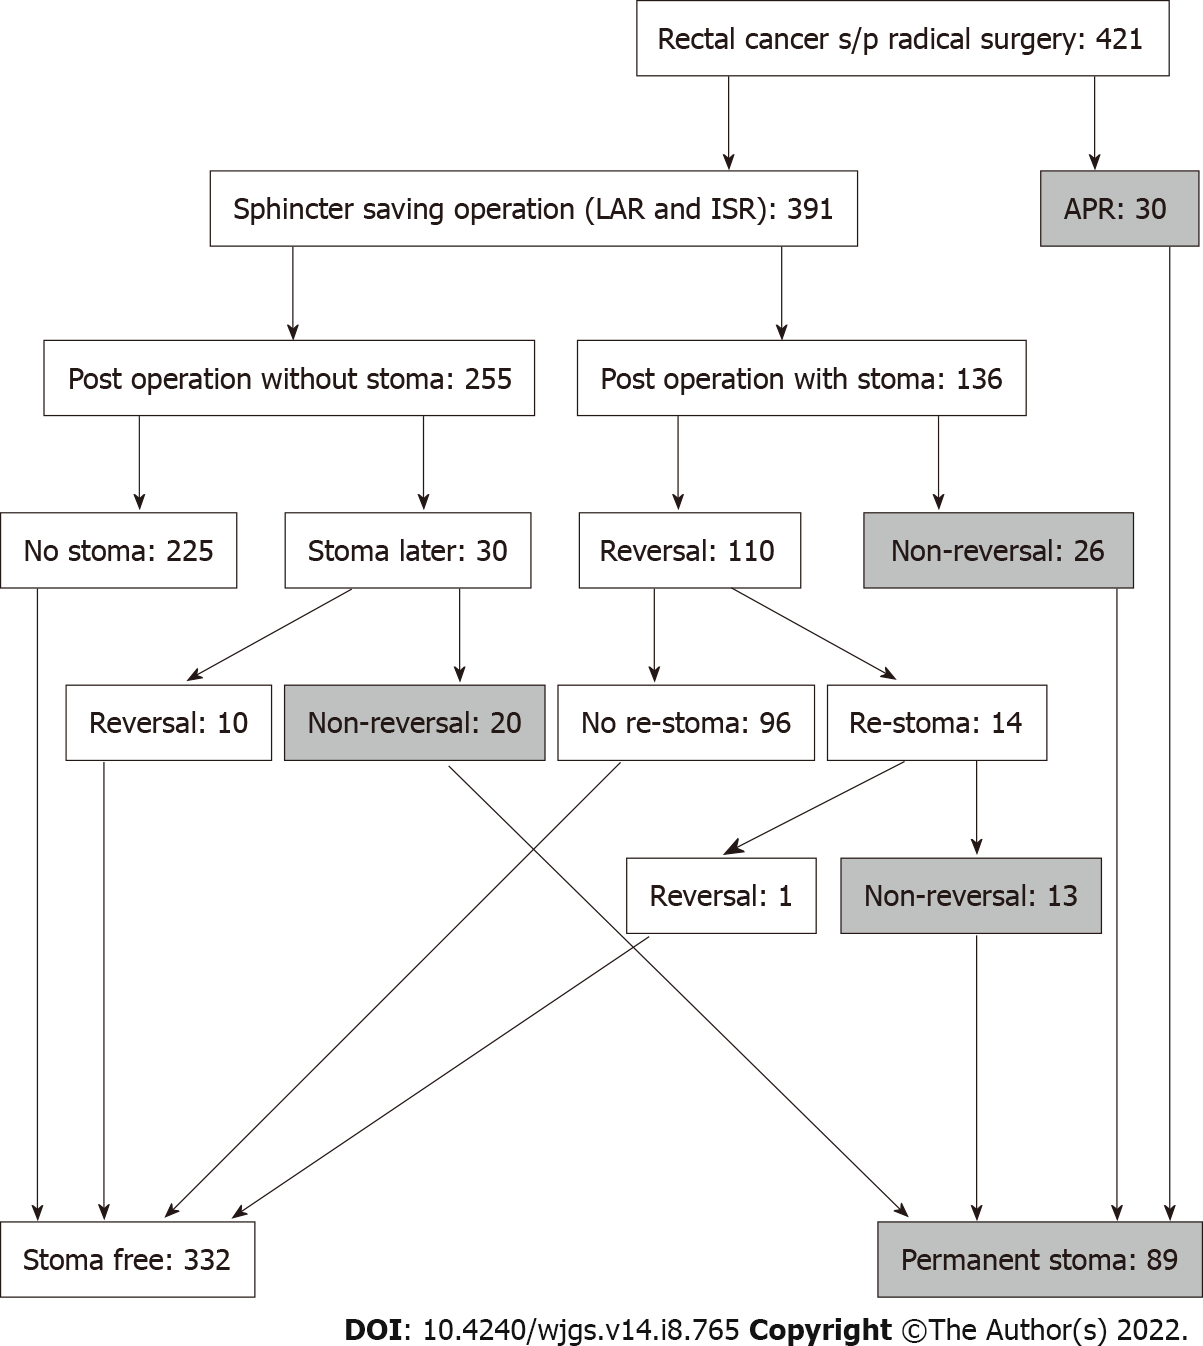
Figure 1
Study flow chart.
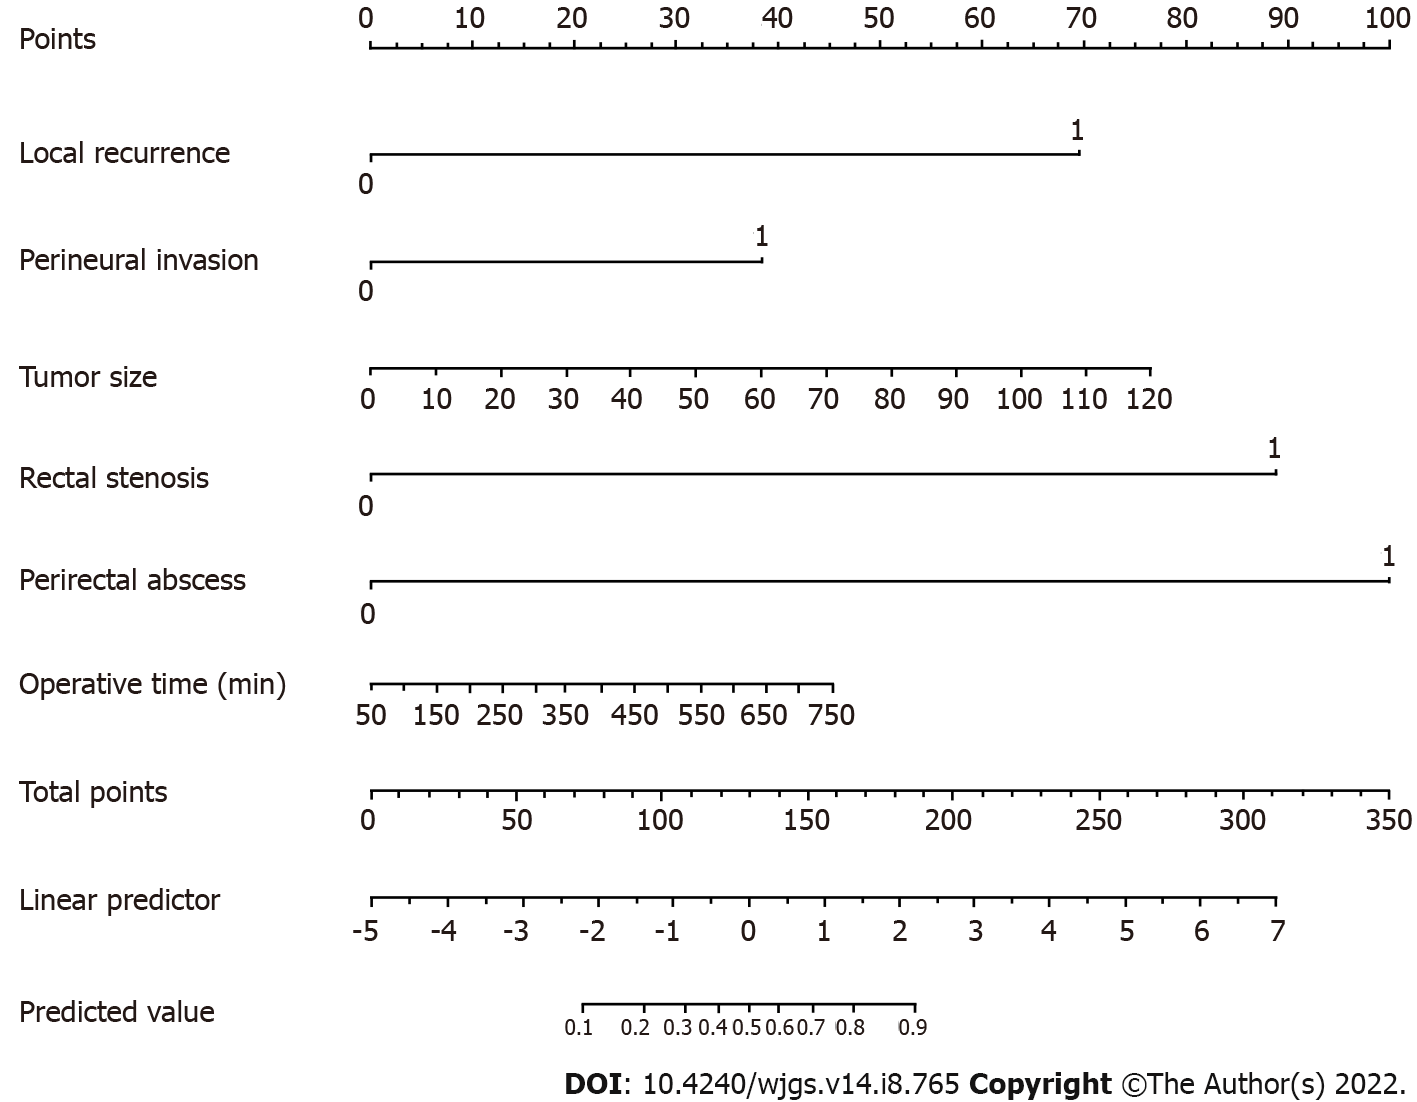
Figure 2 The established nomogram for predicting permanent stoma was developed by incorporating the following six parameters: Local recurrence, perineural invasion, tumor size (mm), rectal stenosis, perirectal abscess and operative time.
First, the nomogram is used by giving each variable a score on the “Points” scale. The scores for all variables are then added to obtain the total score after which a vertical line is drawn from the “Total points” row to estimate the predicted probability of permanent stoma.
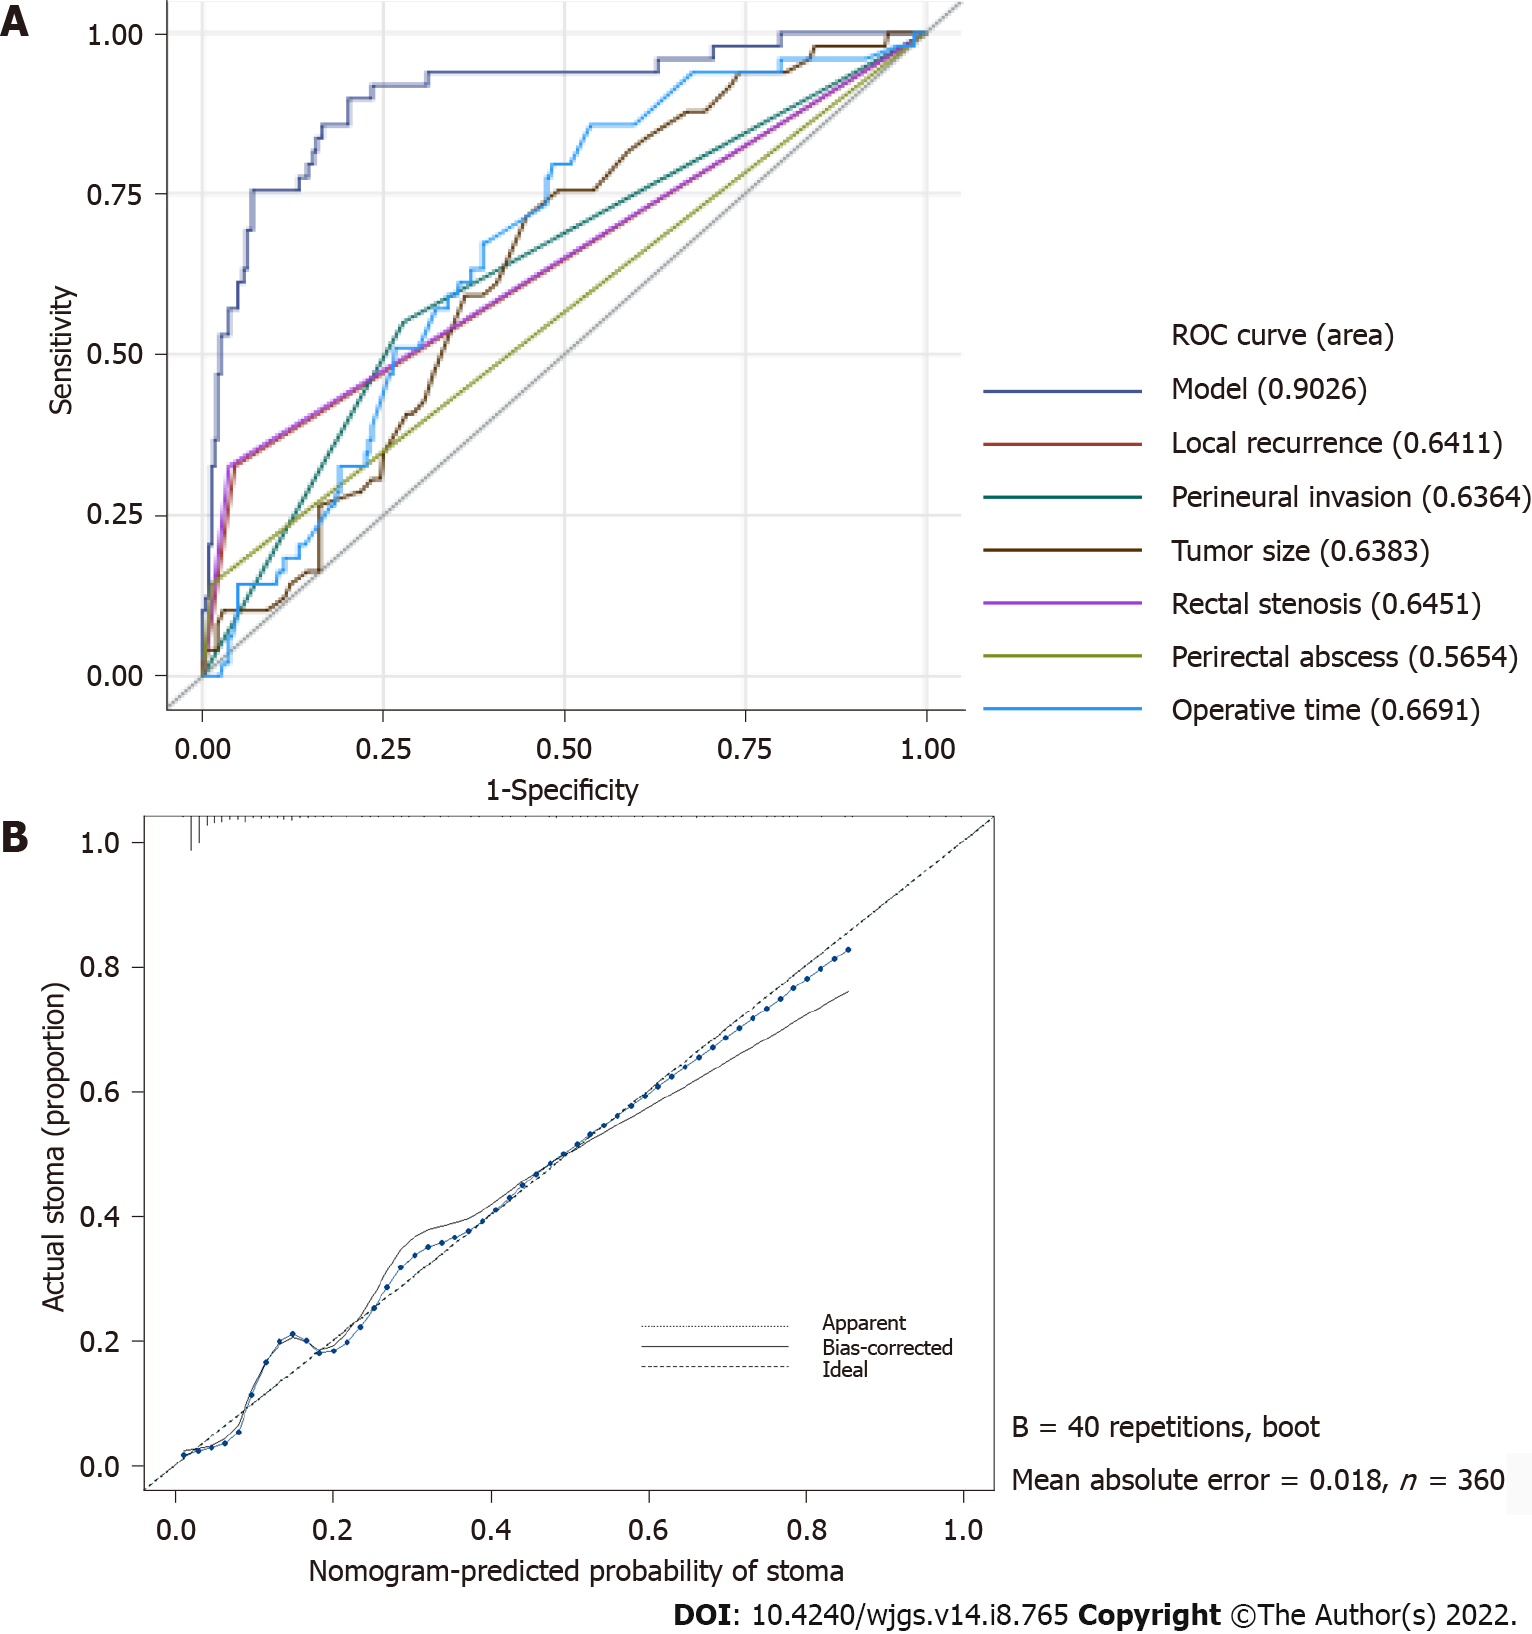
Figure 3 The nomogram calibration plot demonstrated high reliability.
A: The area under the receiver operating characteristic curve for the nomogram was 0.903 (95%CI: 0.851–0.955); B: In the calibration curve, the predicted probability of stoma is plotted on the x-axis, while the actual probability of stoma is plotted on the y-axis. The dotted line represents an ideal nomogram, and the solid blue line represents the current nomogram.
- Citation: Kuo CY, Wei PL, Chen CC, Lin YK, Kuo LJ. Nomogram to predict permanent stoma in rectal cancer patients after sphincter-saving surgery. World J Gastrointest Surg 2022; 14(8): 765-777
- URL: https://www.wjgnet.com/1948-9366/full/v14/i8/765.htm
- DOI: https://dx.doi.org/10.4240/wjgs.v14.i8.765


