Copyright
©The Author(s) 2022.
World J Gastrointest Surg. Apr 27, 2022; 14(4): 341-351
Published online Apr 27, 2022. doi: 10.4240/wjgs.v14.i4.341
Published online Apr 27, 2022. doi: 10.4240/wjgs.v14.i4.341
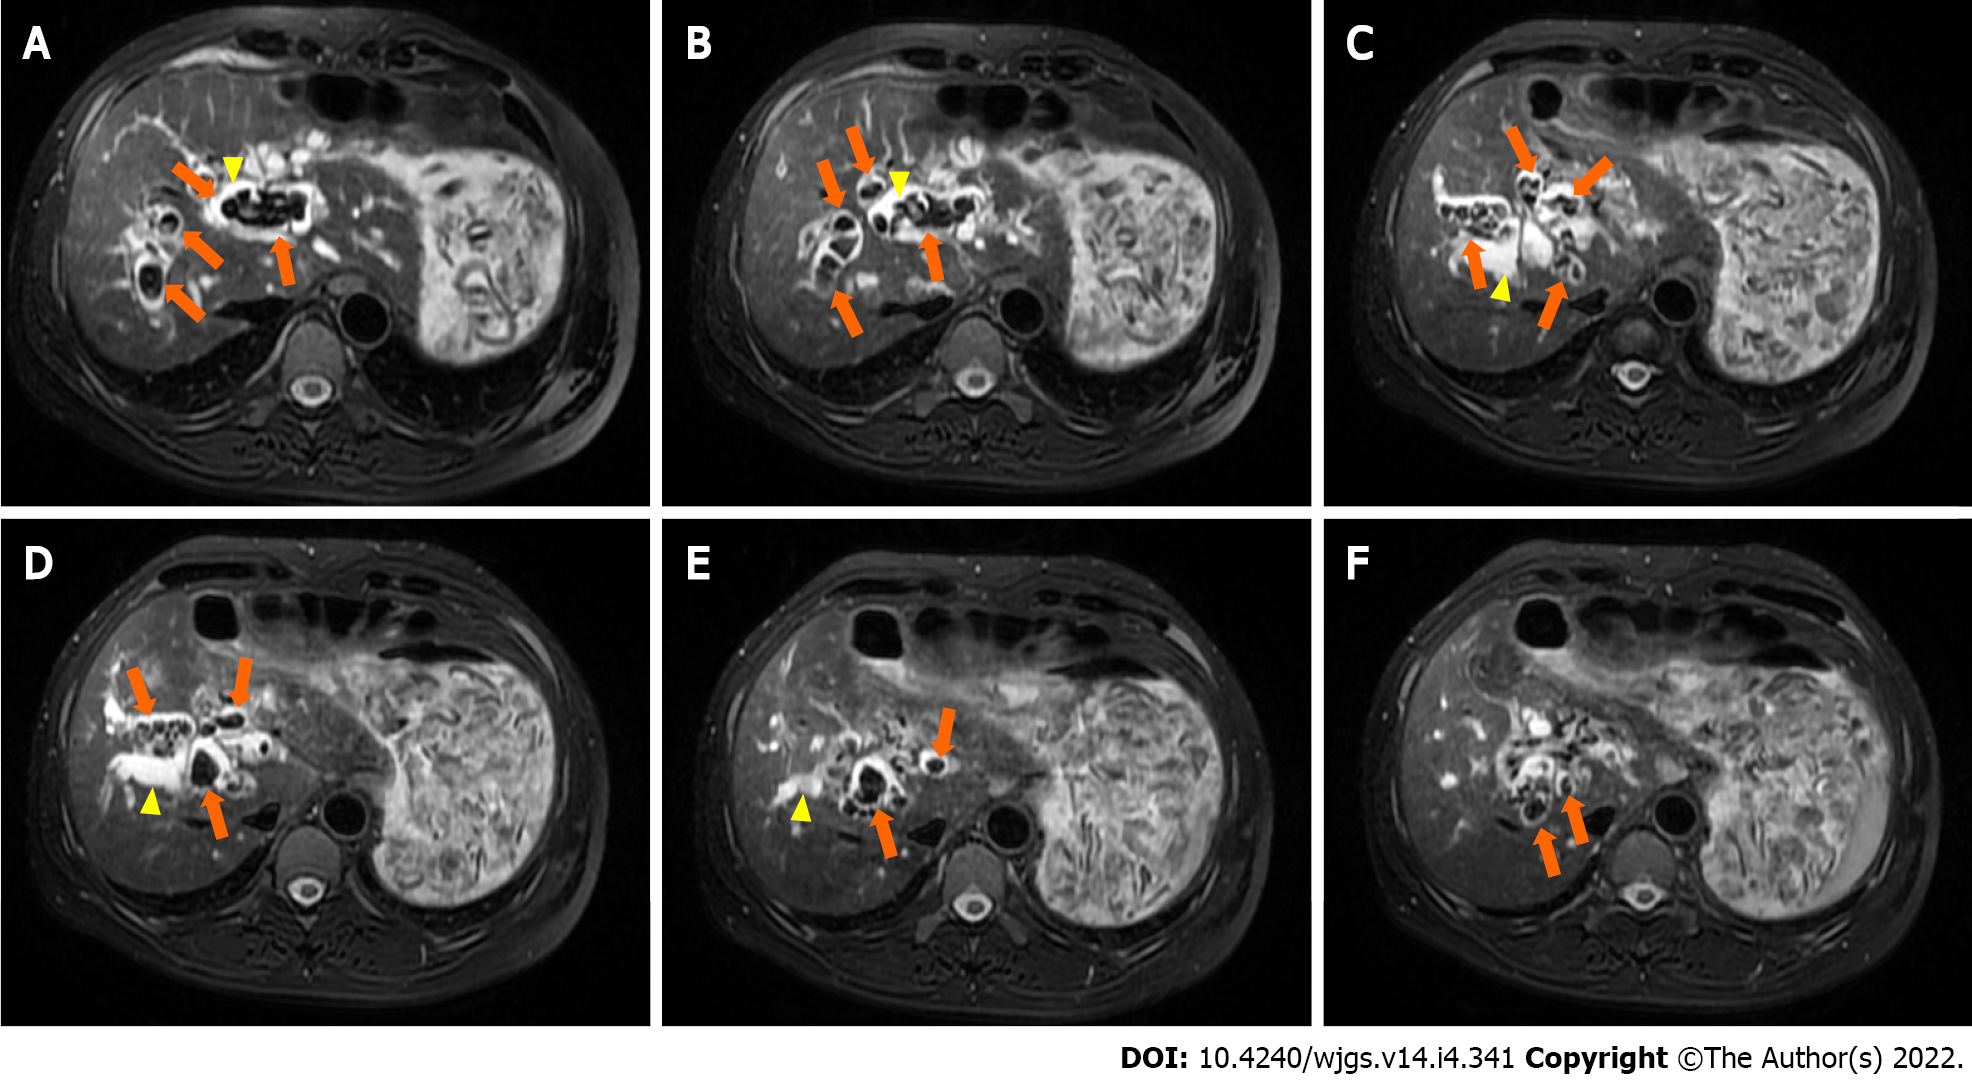
Figure 1 Preoperative magnetic resonance cholangiopancreatography.
A-C: Representative multiple short T2 signals in the intrahepatic and common bile ducts (orange arrows), and obvious intrahepatic duct, left and right hepatic duct dilatation (yellow arrows); D-F: Representative multiple short T2 signals in the intrahepatic and common bile ducts (orange arrows), and obvious intrahepatic duct and left and right hepatic duct dilatation (yellow arrows).
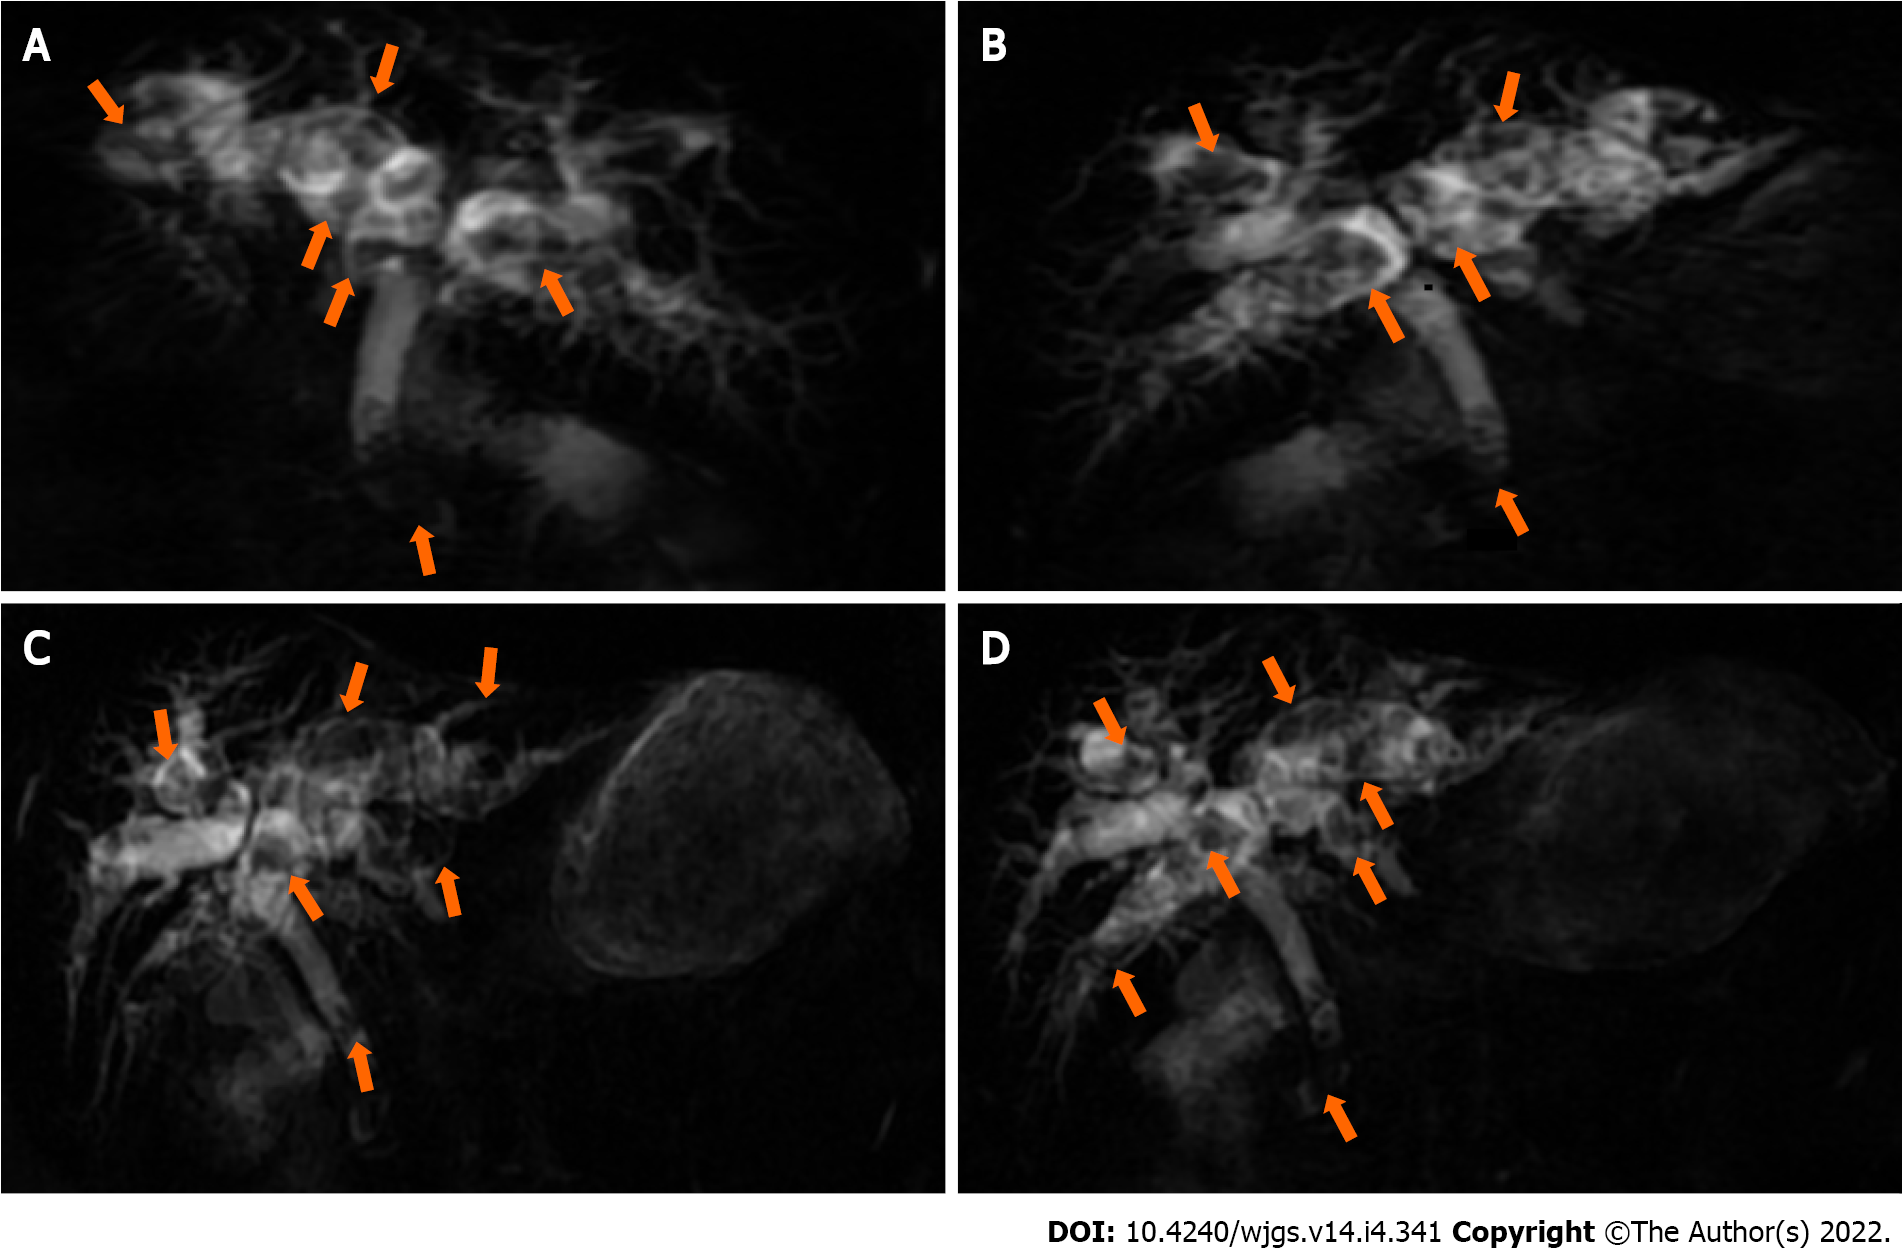
Figure 2 Preoperative multiplanar reconstruction magnetic resonance cholangiopancreatography.
A and B: Representative multiple short T2 signals in the intrahepatic duct common bile duct (orange arrows); C and D: Representative multiple short T2 signals in the intrahepatic duct common bile duct (orange arrows).
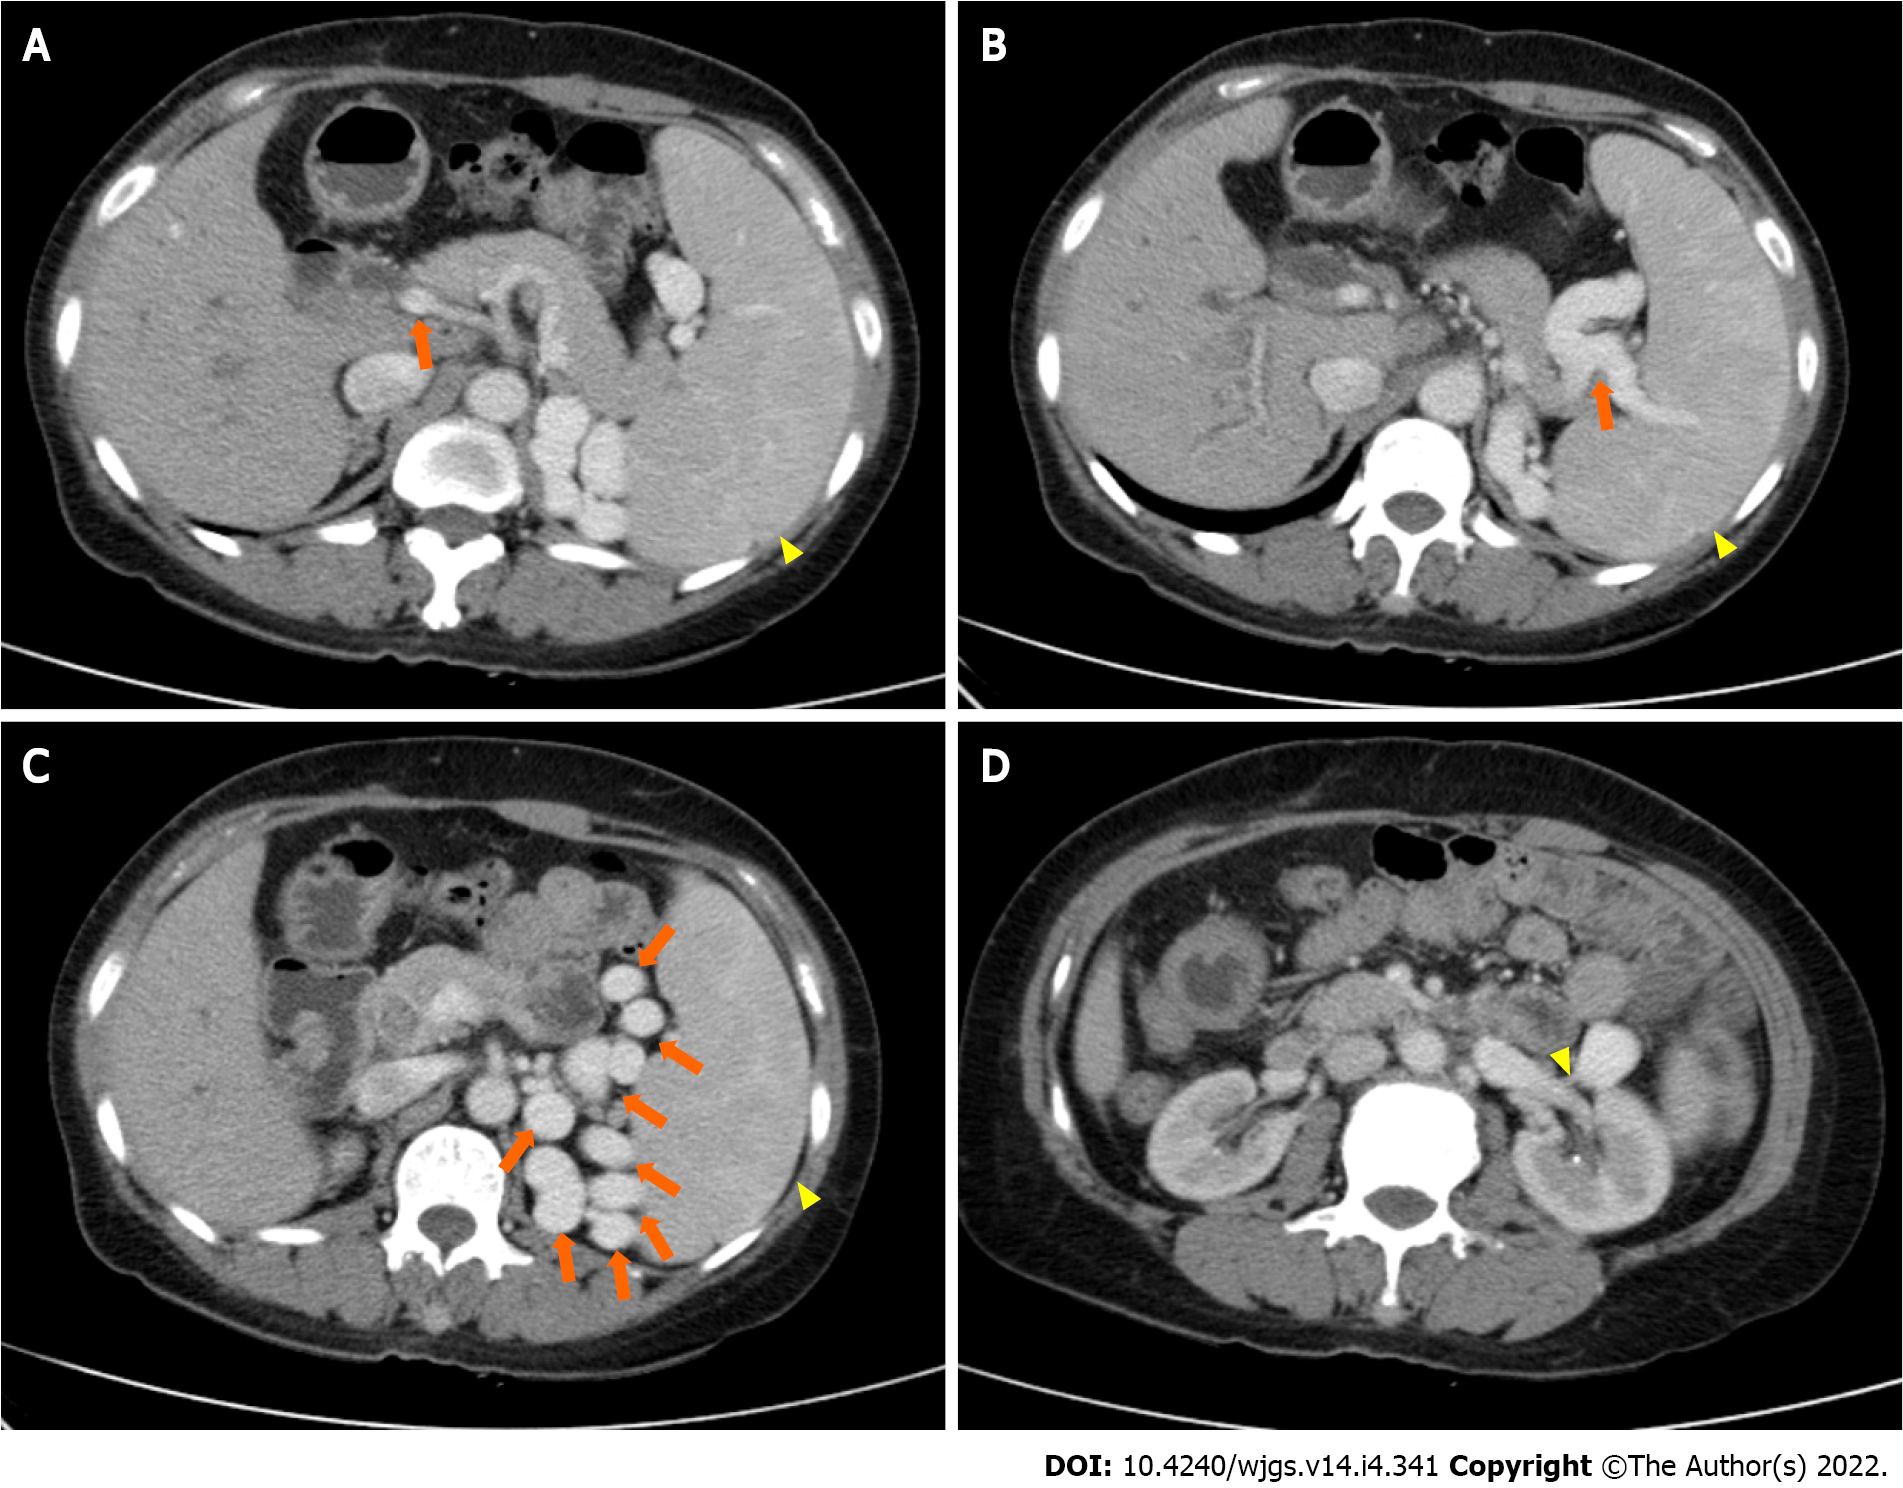
Figure 3 Preoperative abdominal and pelvic contrast-enhanced computed tomography images.
A: Narrowed portal vein (orange arrow) and splenomegaly (yellow arrow); B: Splenic varices (orange arrow) and splenomegaly (yellow arrow); C: Collateral circulation expansion (orange arrows) and splenomegaly (yellow arrow); D: Spontaneous spleno-renal shunt (yellow arrow).
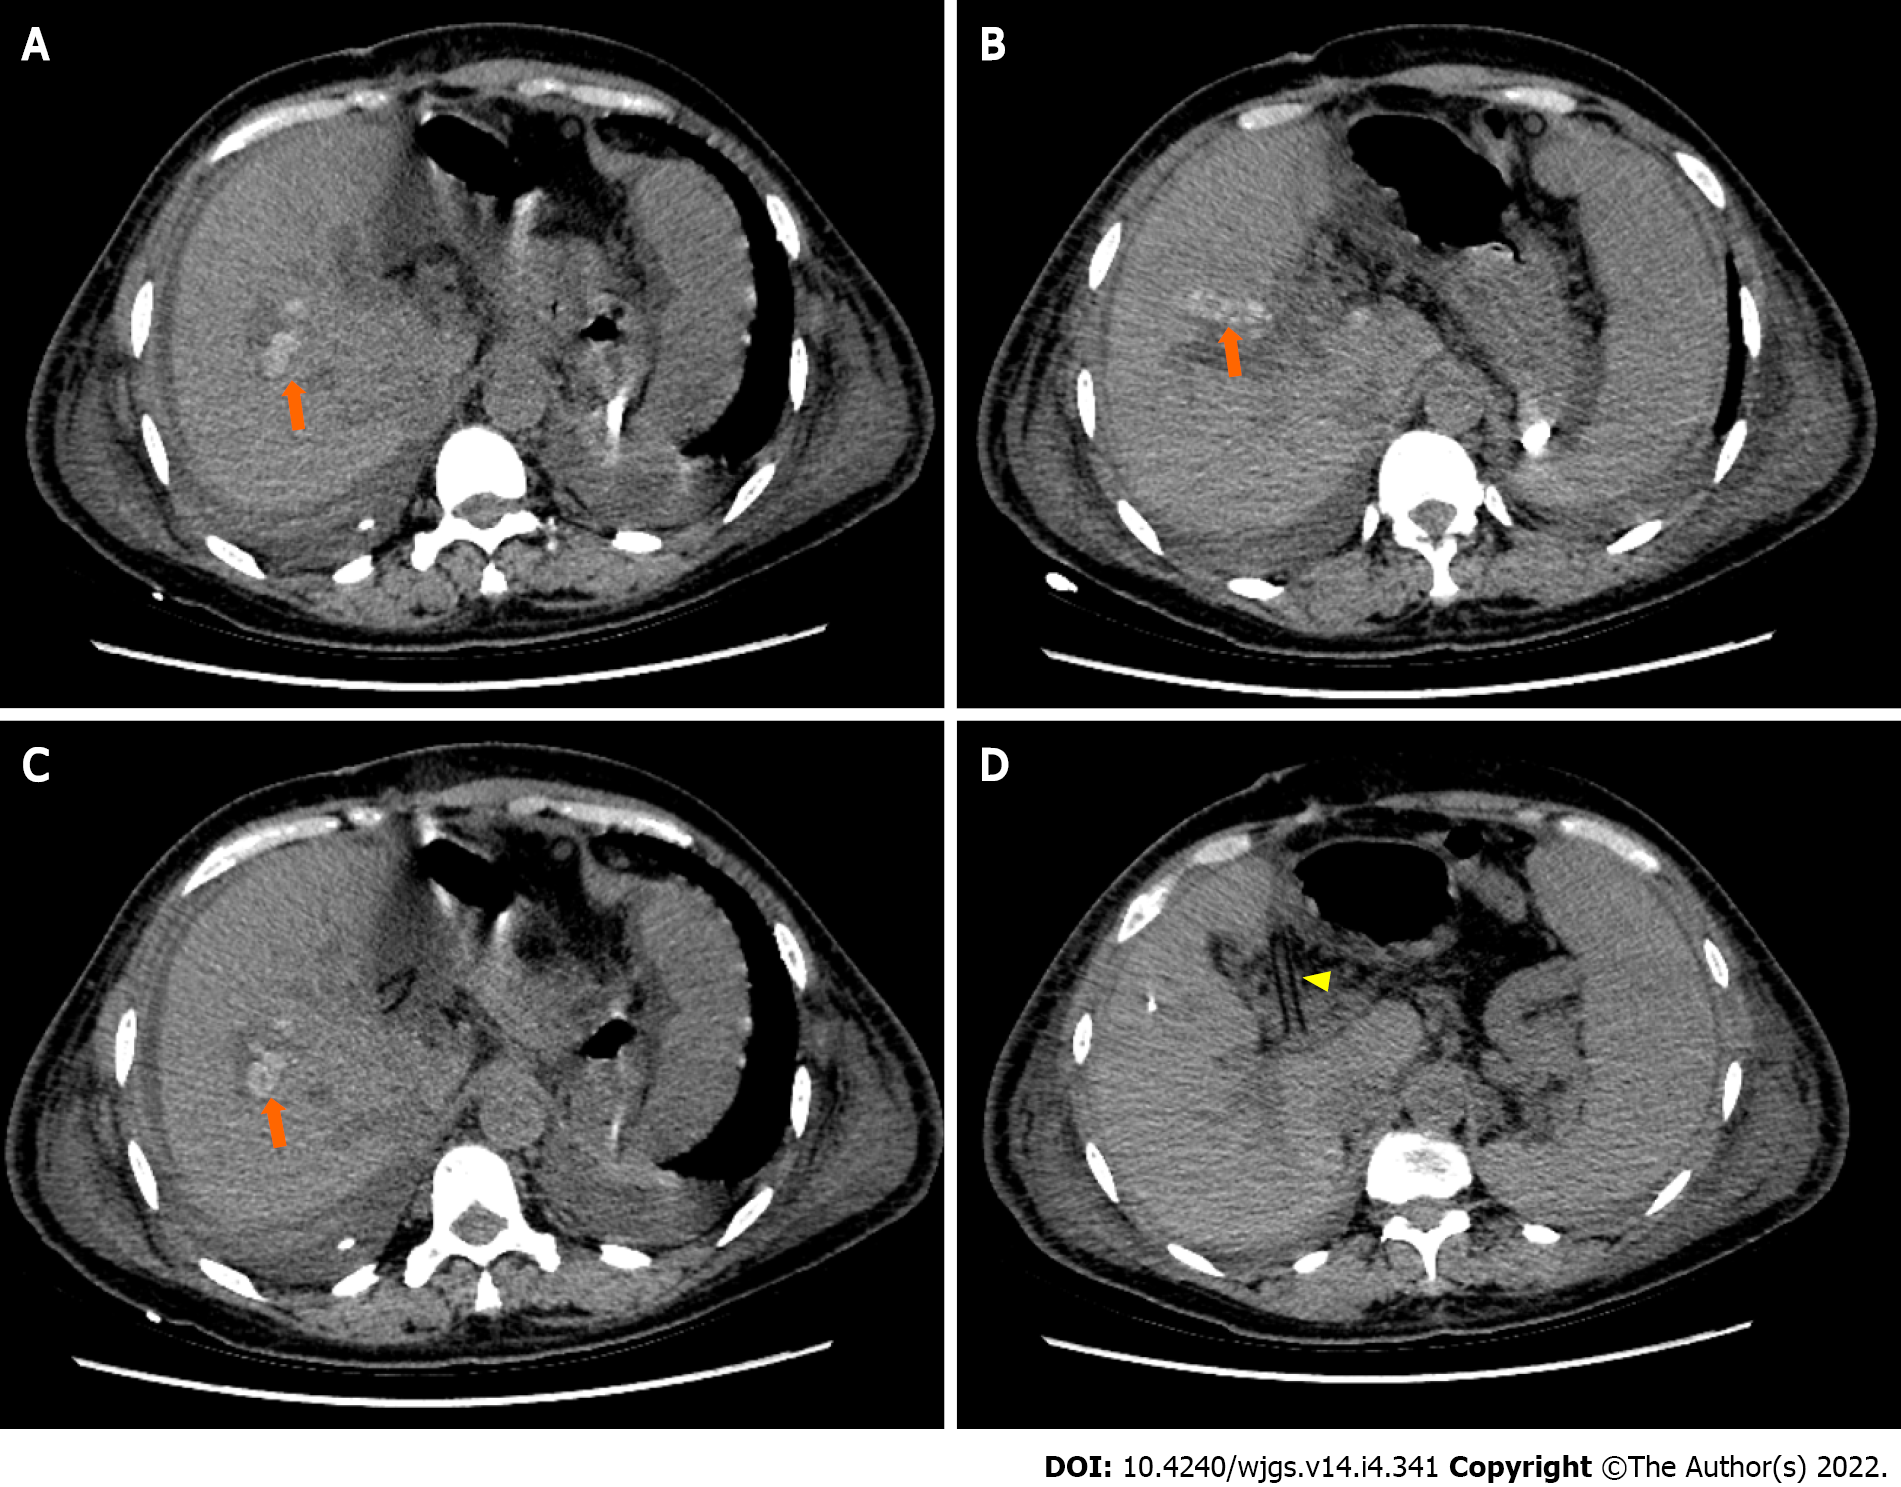
Figure 4 Postoperative abdominal computed tomography images.
A-C: Representative multiple nodular high-density shadows in the right hepatic duct (orange arrows); D: Drainage tube (yellow arrow).
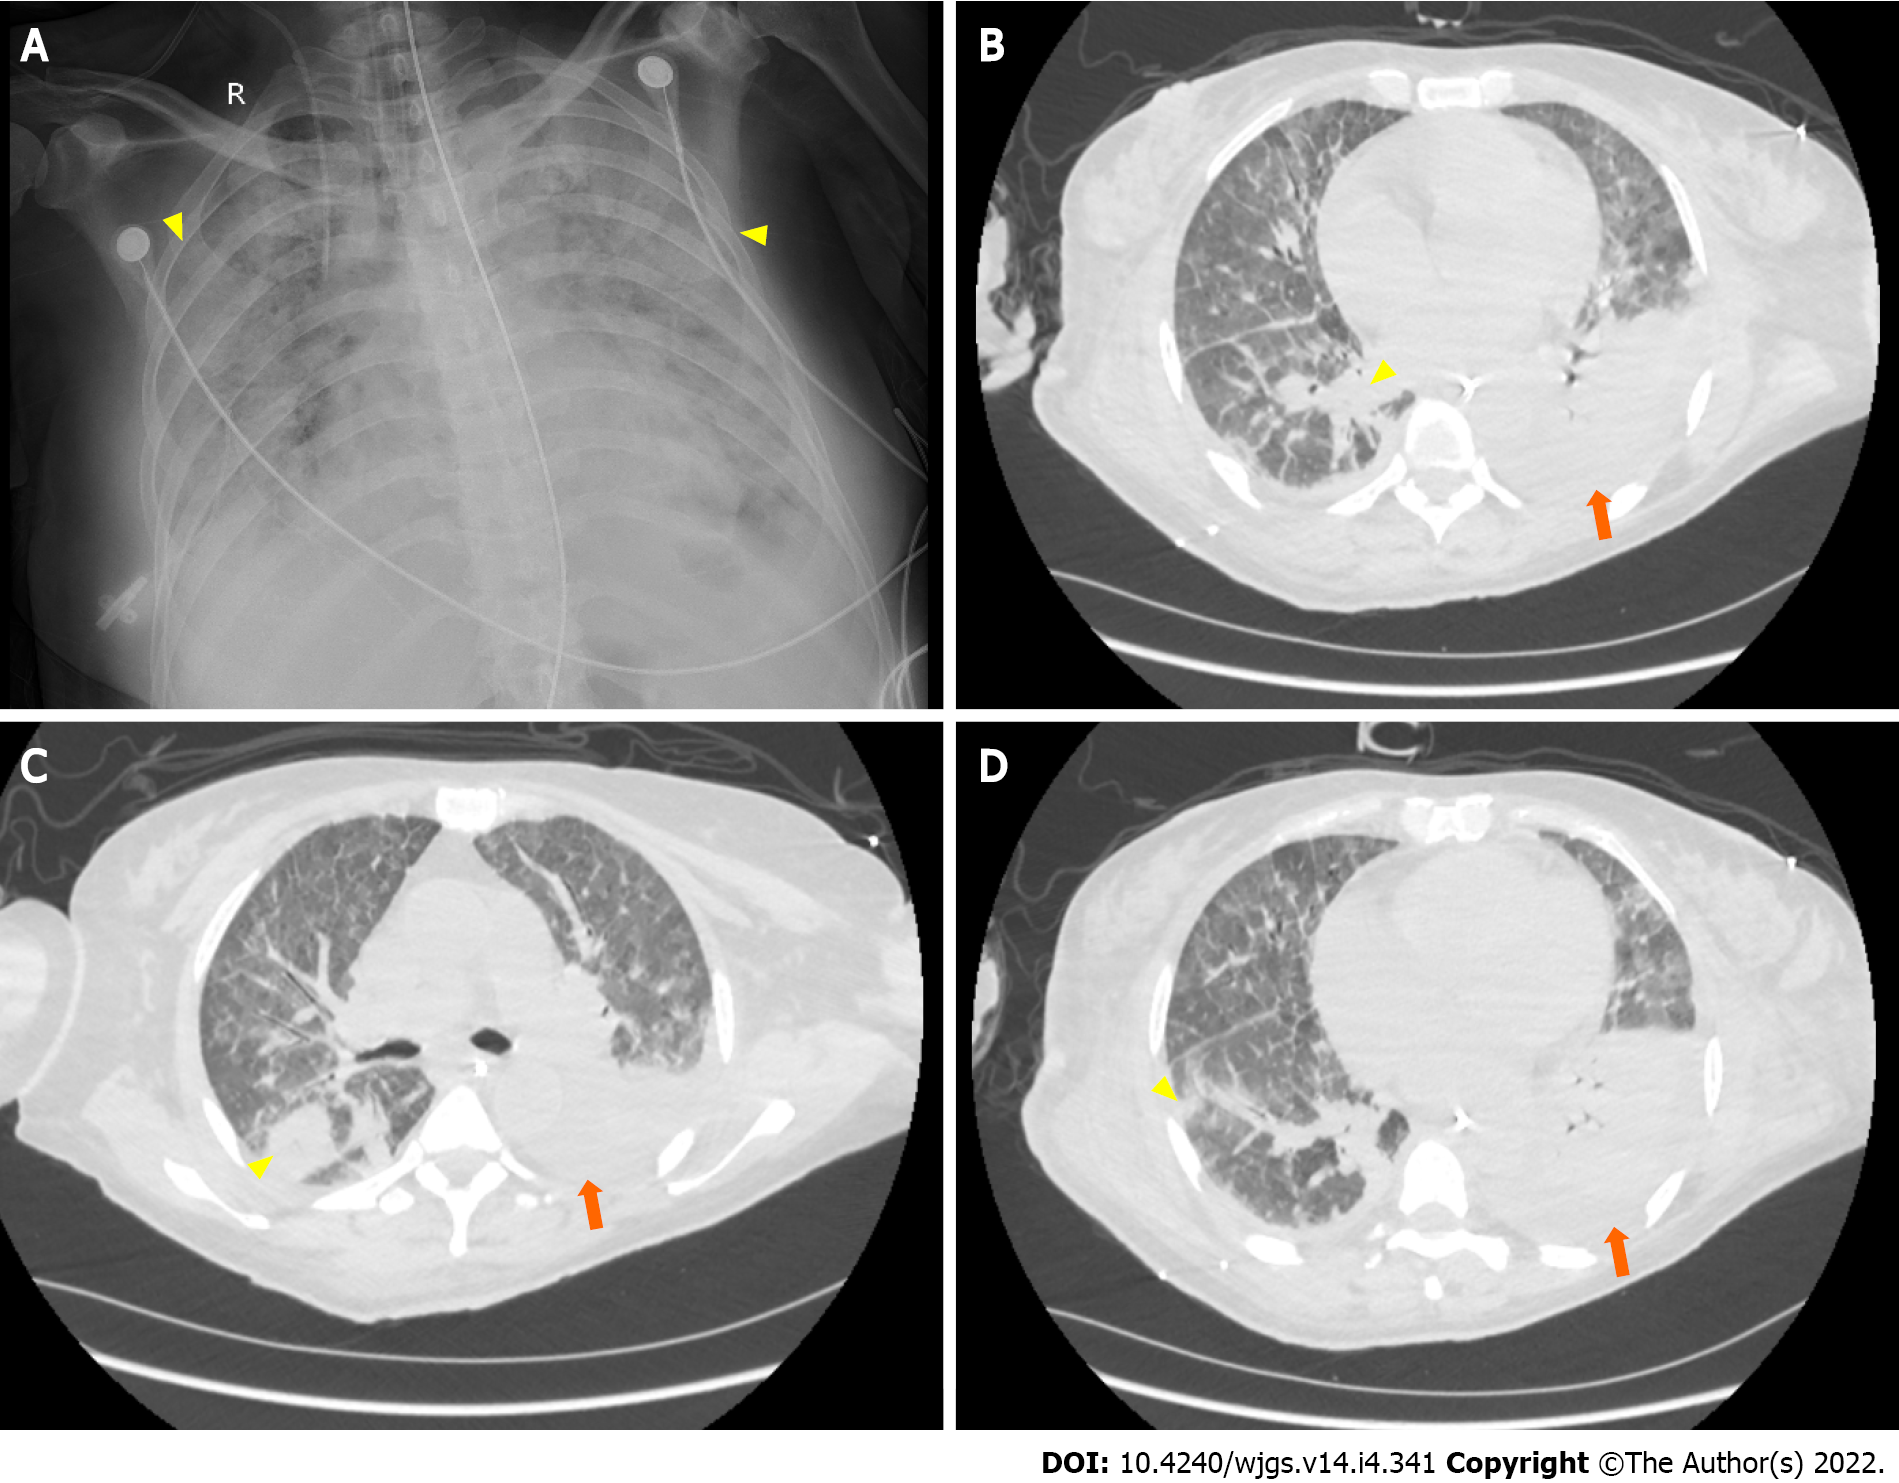
Figure 5 Postoperative pulmonary imaging.
A: Bedside chest X-ray (August 14, 2021) showing bilateral pulmonary diffuse patchy high-density shadows (yellow arrows) and bilateral pleural effusion, indicating bilateral pulmonary infection; B-D: Representative chest computed tomography (August 20, 2021) images showing bilateral pulmonary nodular and patchy shadows (yellow arrows) and left pulmonary atelectasis (orange arrows), indicating pulmonary infection.
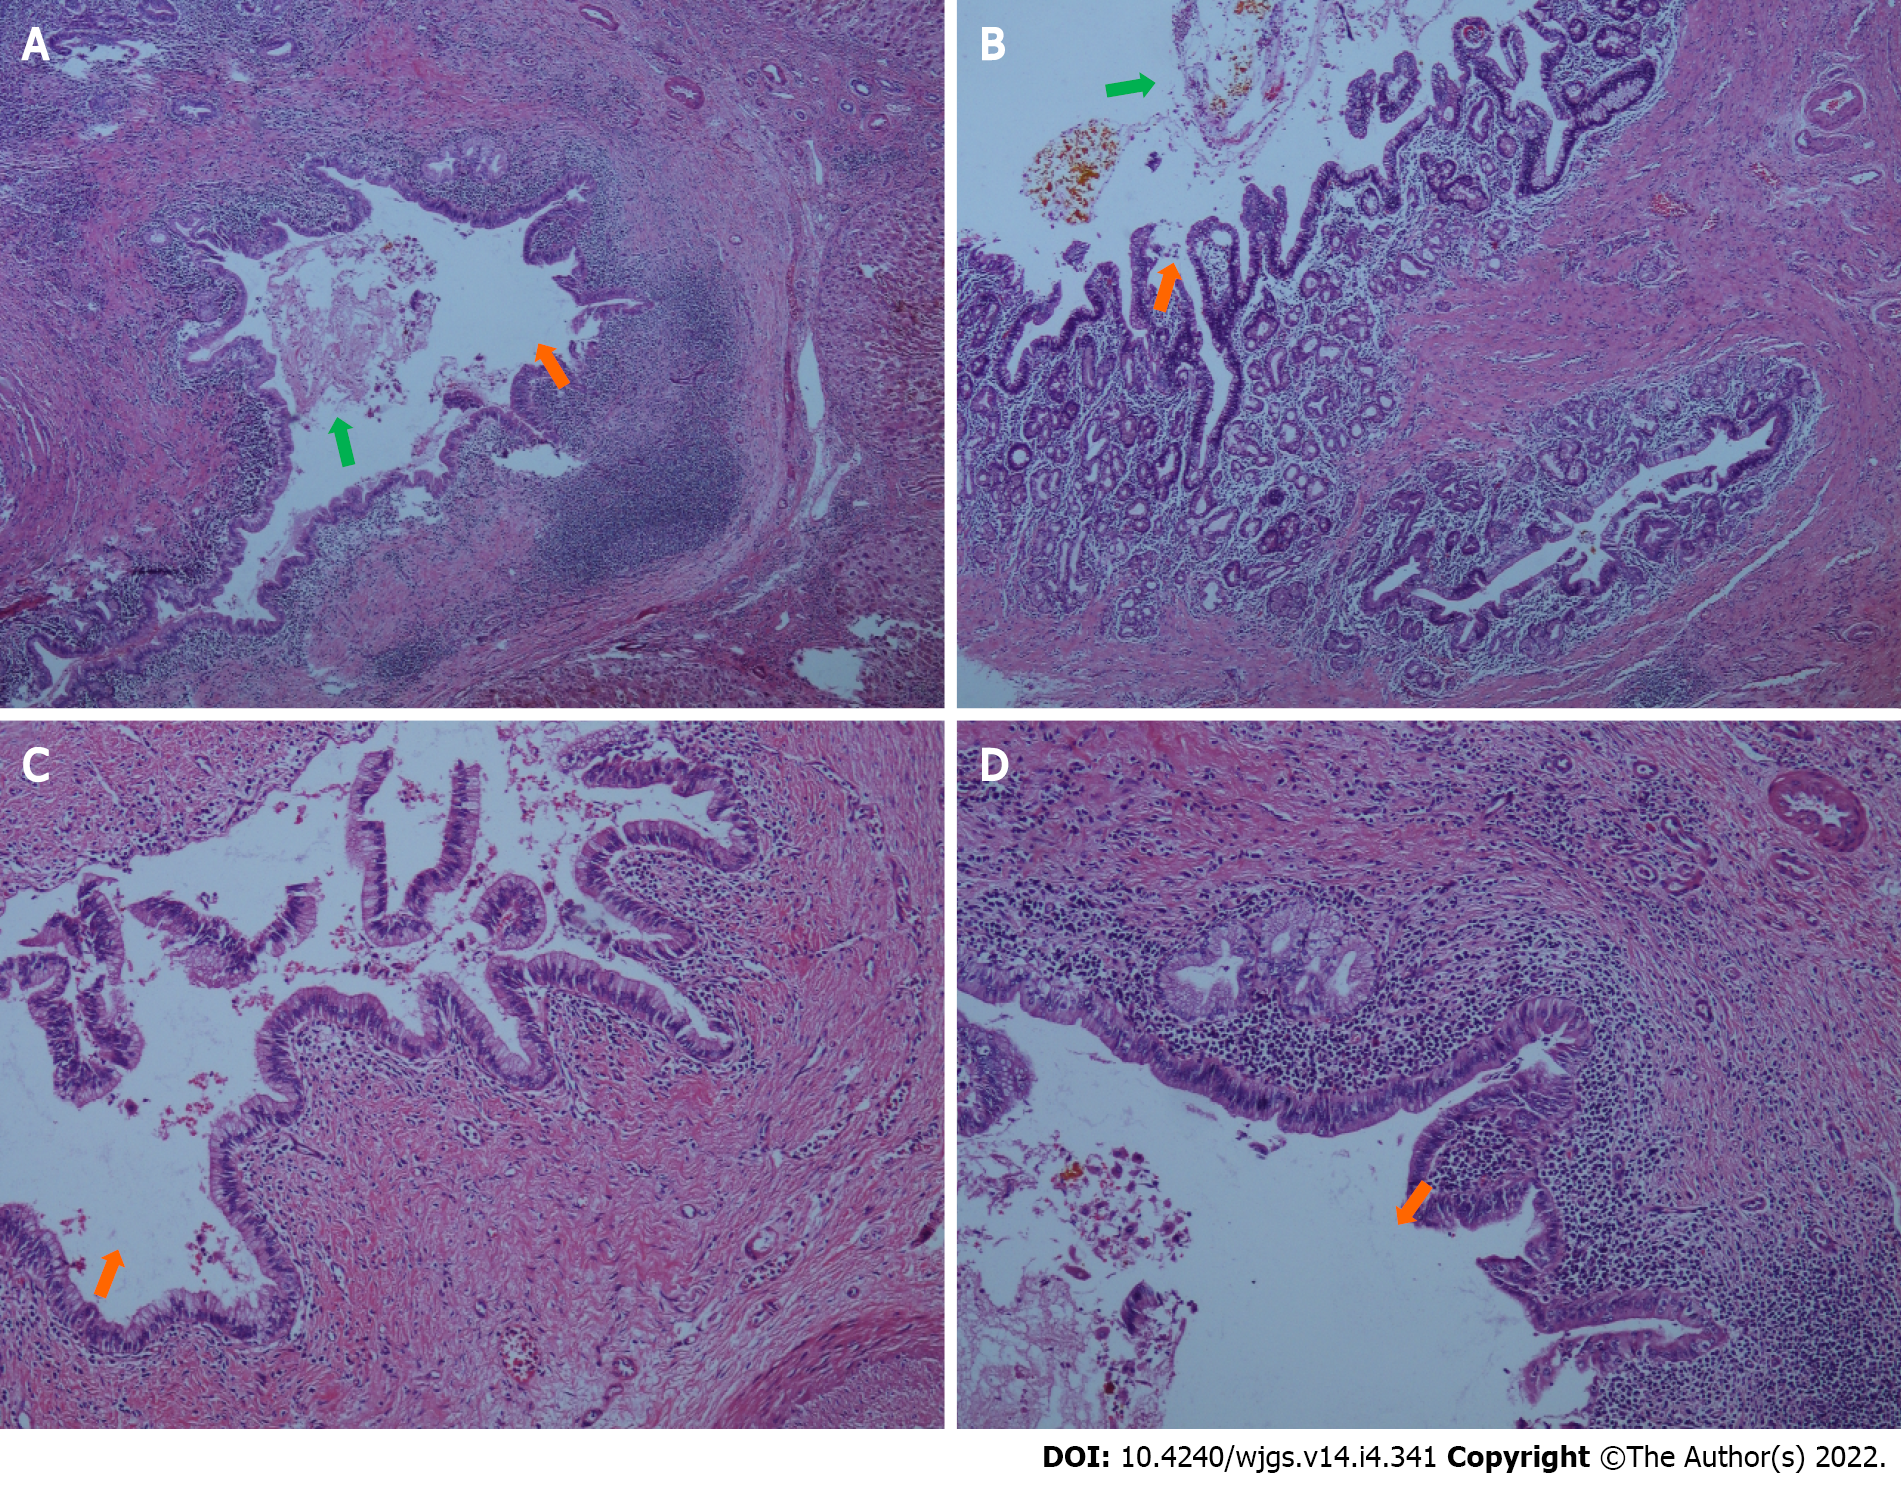
Figure 6 Histopathological findings of the resected liver (intrahepatic duct).
A and B: Representative specimens showing intrahepatic duct dilatation (orange arrows) with stones (green arrows) and inflammatory cell infiltration in bile duct walls (hematoxylin and eosin staining; 40 ×); C and D: Representative specimens showing intrahepatic duct dilatation (orange arrows) with stones and inflammatory cell infiltration in bile duct walls (hematoxylin and eosin staining; 100 ×).
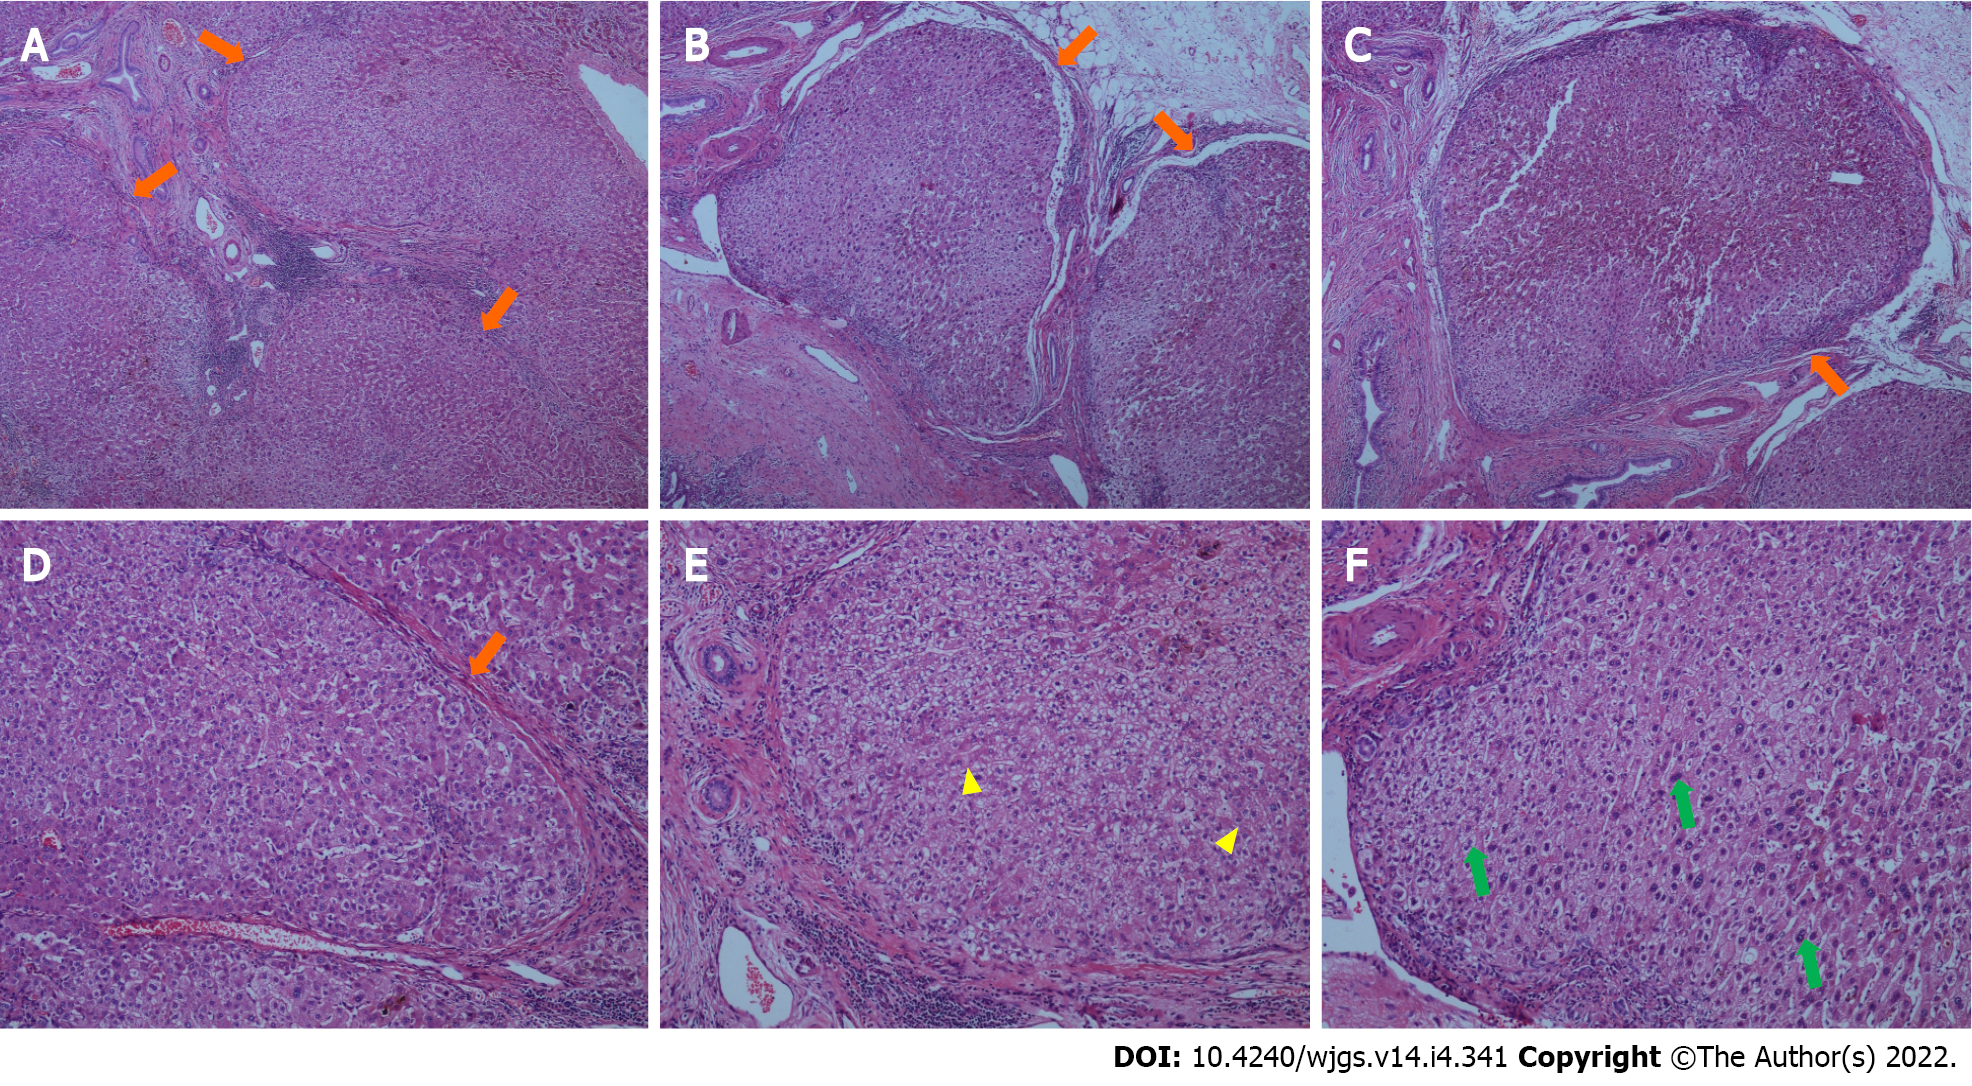
Figure 7 Histopathological findings in the resected liver (liver parenchyma).
A-C: Representative specimens showing proliferation of fibrous tissue in portal tracts dividing the liver parenchyma into irregular regenerative nodules (pseudolobules, orange arrows) that have lost the normal structure, and central veins (hematoxylin and eosin staining; 40 ×); D-F: Representative specimens showing pseudolobules (orange arrow) hepatic cords arranged irregularly, with foci of two layers of cells (yellow arrows), and large, occasionally binucleate cells (green arrows; hematoxylin and eosin staining; 100 ×).
- Citation: Fan WJ, Zou XJ. Subacute liver and respiratory failure after segmental hepatectomy for complicated hepatolithiasis with secondary biliary cirrhosis: A case report. World J Gastrointest Surg 2022; 14(4): 341-351
- URL: https://www.wjgnet.com/1948-9366/full/v14/i4/341.htm
- DOI: https://dx.doi.org/10.4240/wjgs.v14.i4.341


