Copyright
©The Author(s) 2022.
World J Gastrointest Surg. Apr 27, 2022; 14(4): 304-314
Published online Apr 27, 2022. doi: 10.4240/wjgs.v14.i4.304
Published online Apr 27, 2022. doi: 10.4240/wjgs.v14.i4.304
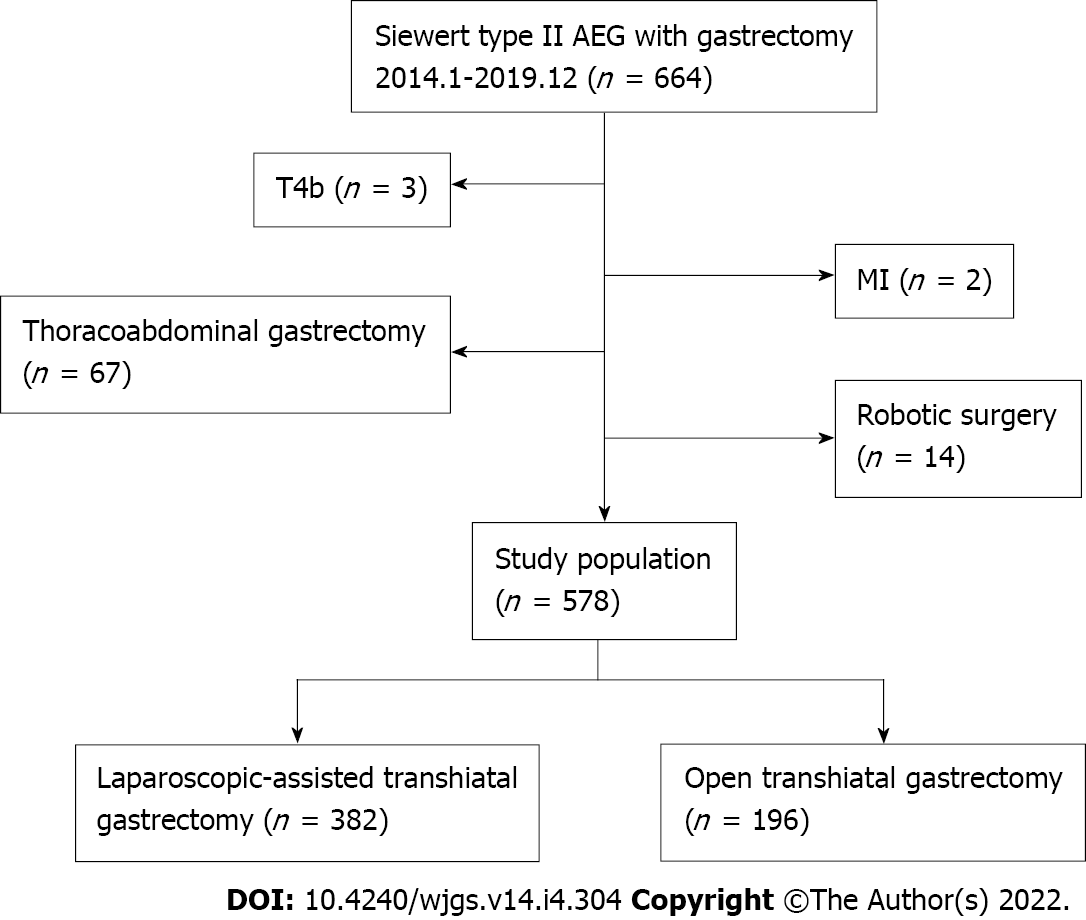
Figure 1 Flow chart of patient selection.
AEG: Adenocarcinoma of the esophagogastric junction.
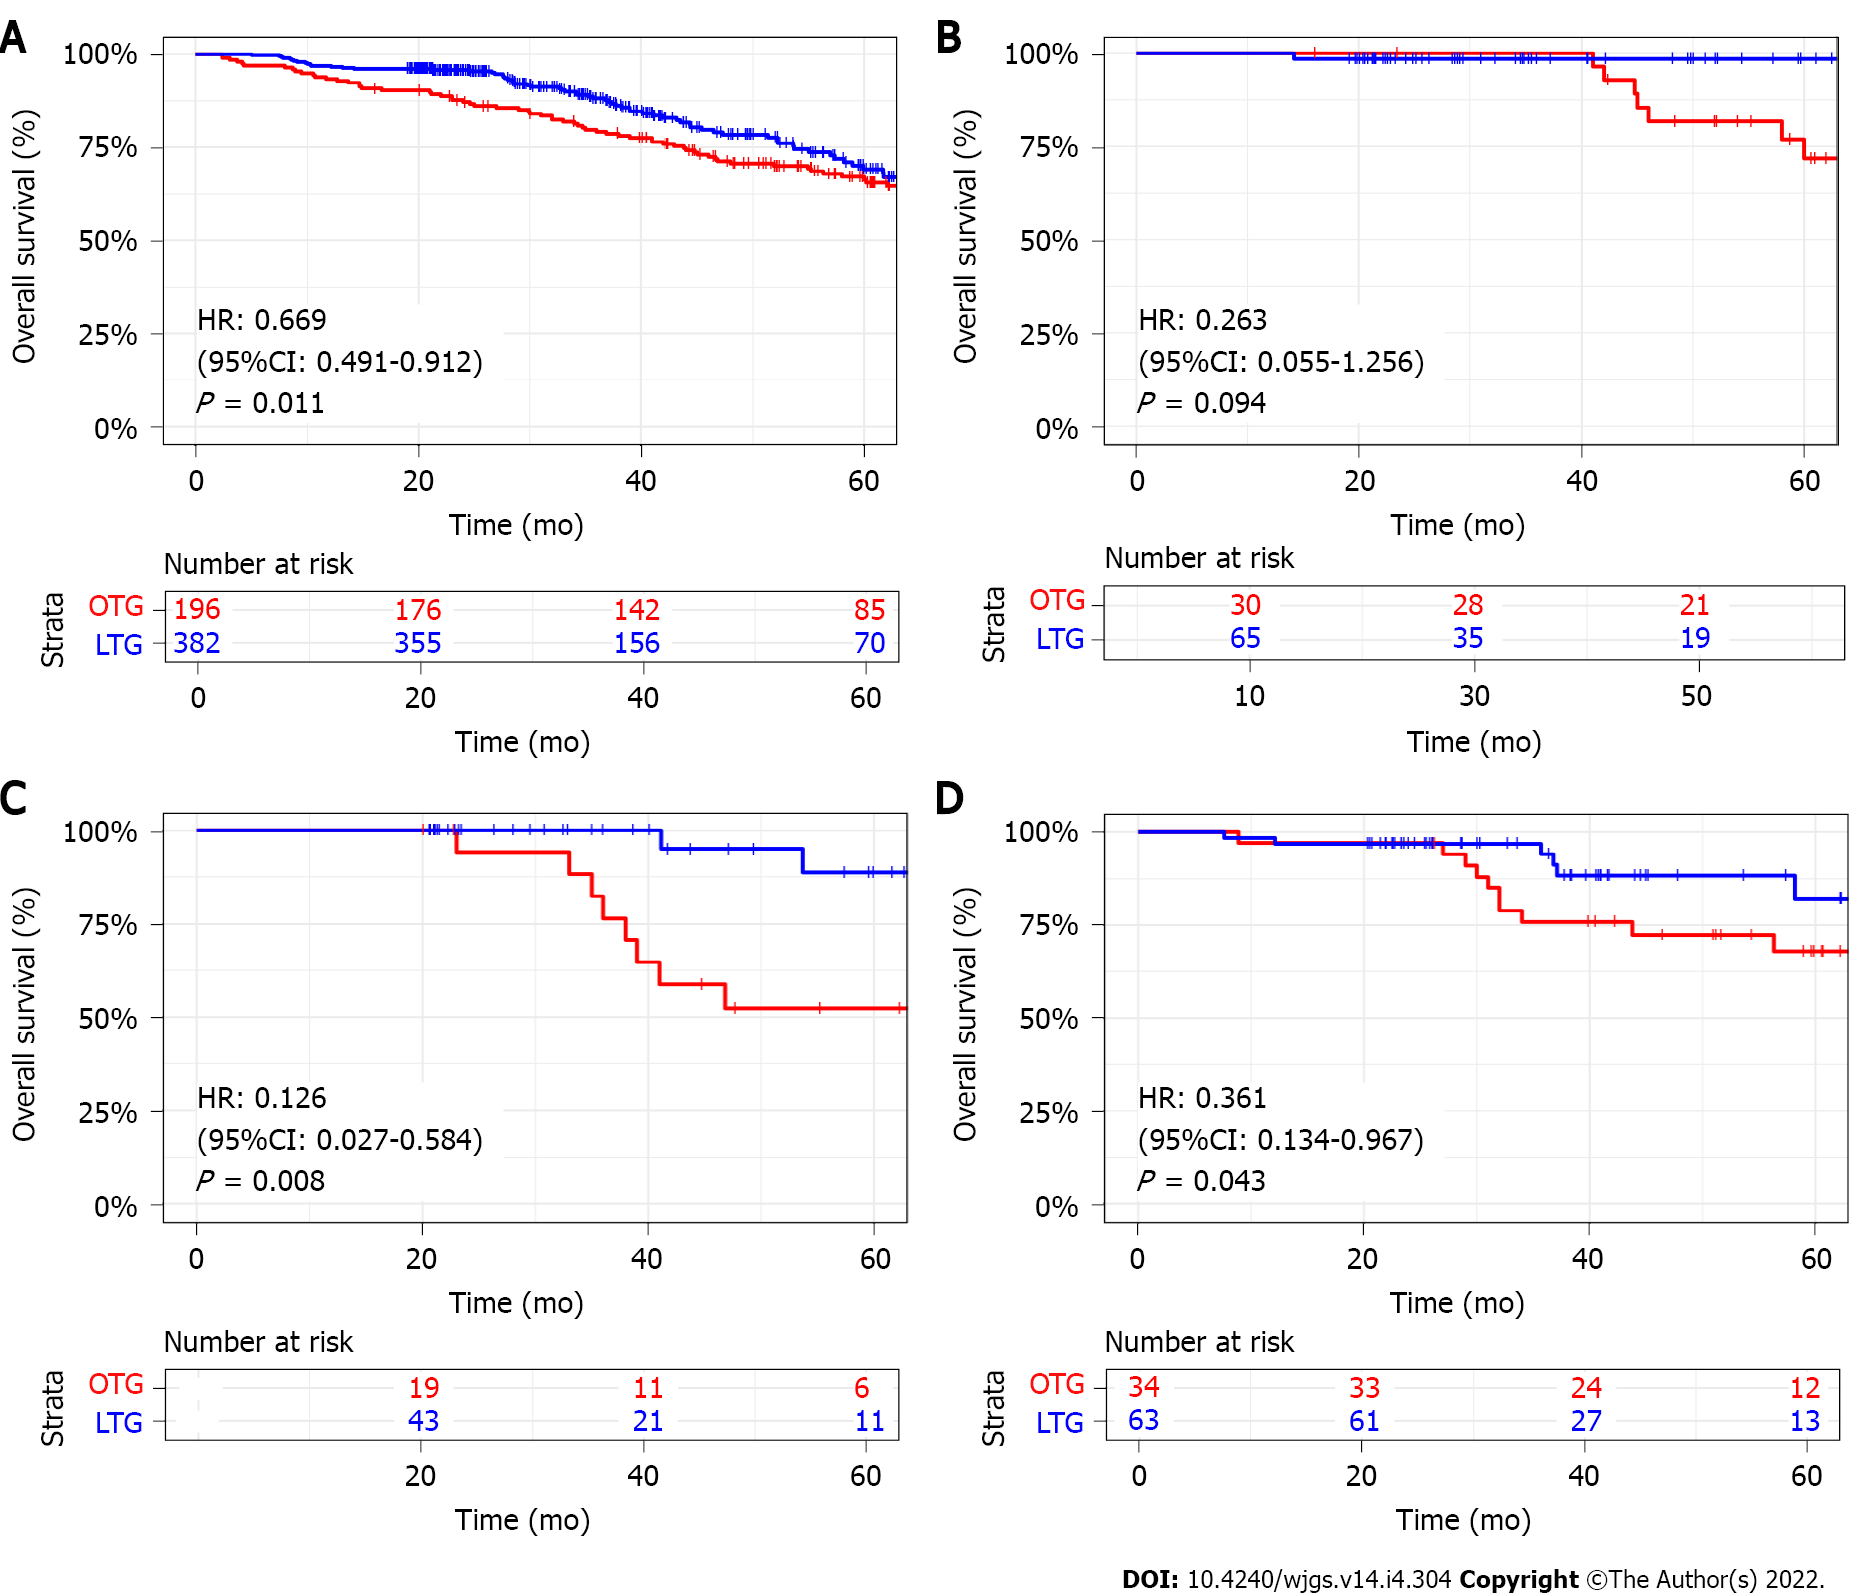
Figure 2 Comparison of overall survival rates between the laparoscopic-assisted transhiatal gastrectomy and open transhiatal gastrectomy groups.
A. Comparison of overall survival rates between the laparoscopic-assisted transhiatal gastrectomy (LTG) and open transhiatal gastrectomy (OTG) groups for all patients; B: Comparison of overall survival rates between the LTG and OTG groups for stage I patients; C: Comparison of overall survival rates between the LTG and OTG groups for stage II patients; D: Comparison of overall survival rates between the LTG and OTG groups for stage III patients. CI: Confidence interval; HR: Hazard ratio.
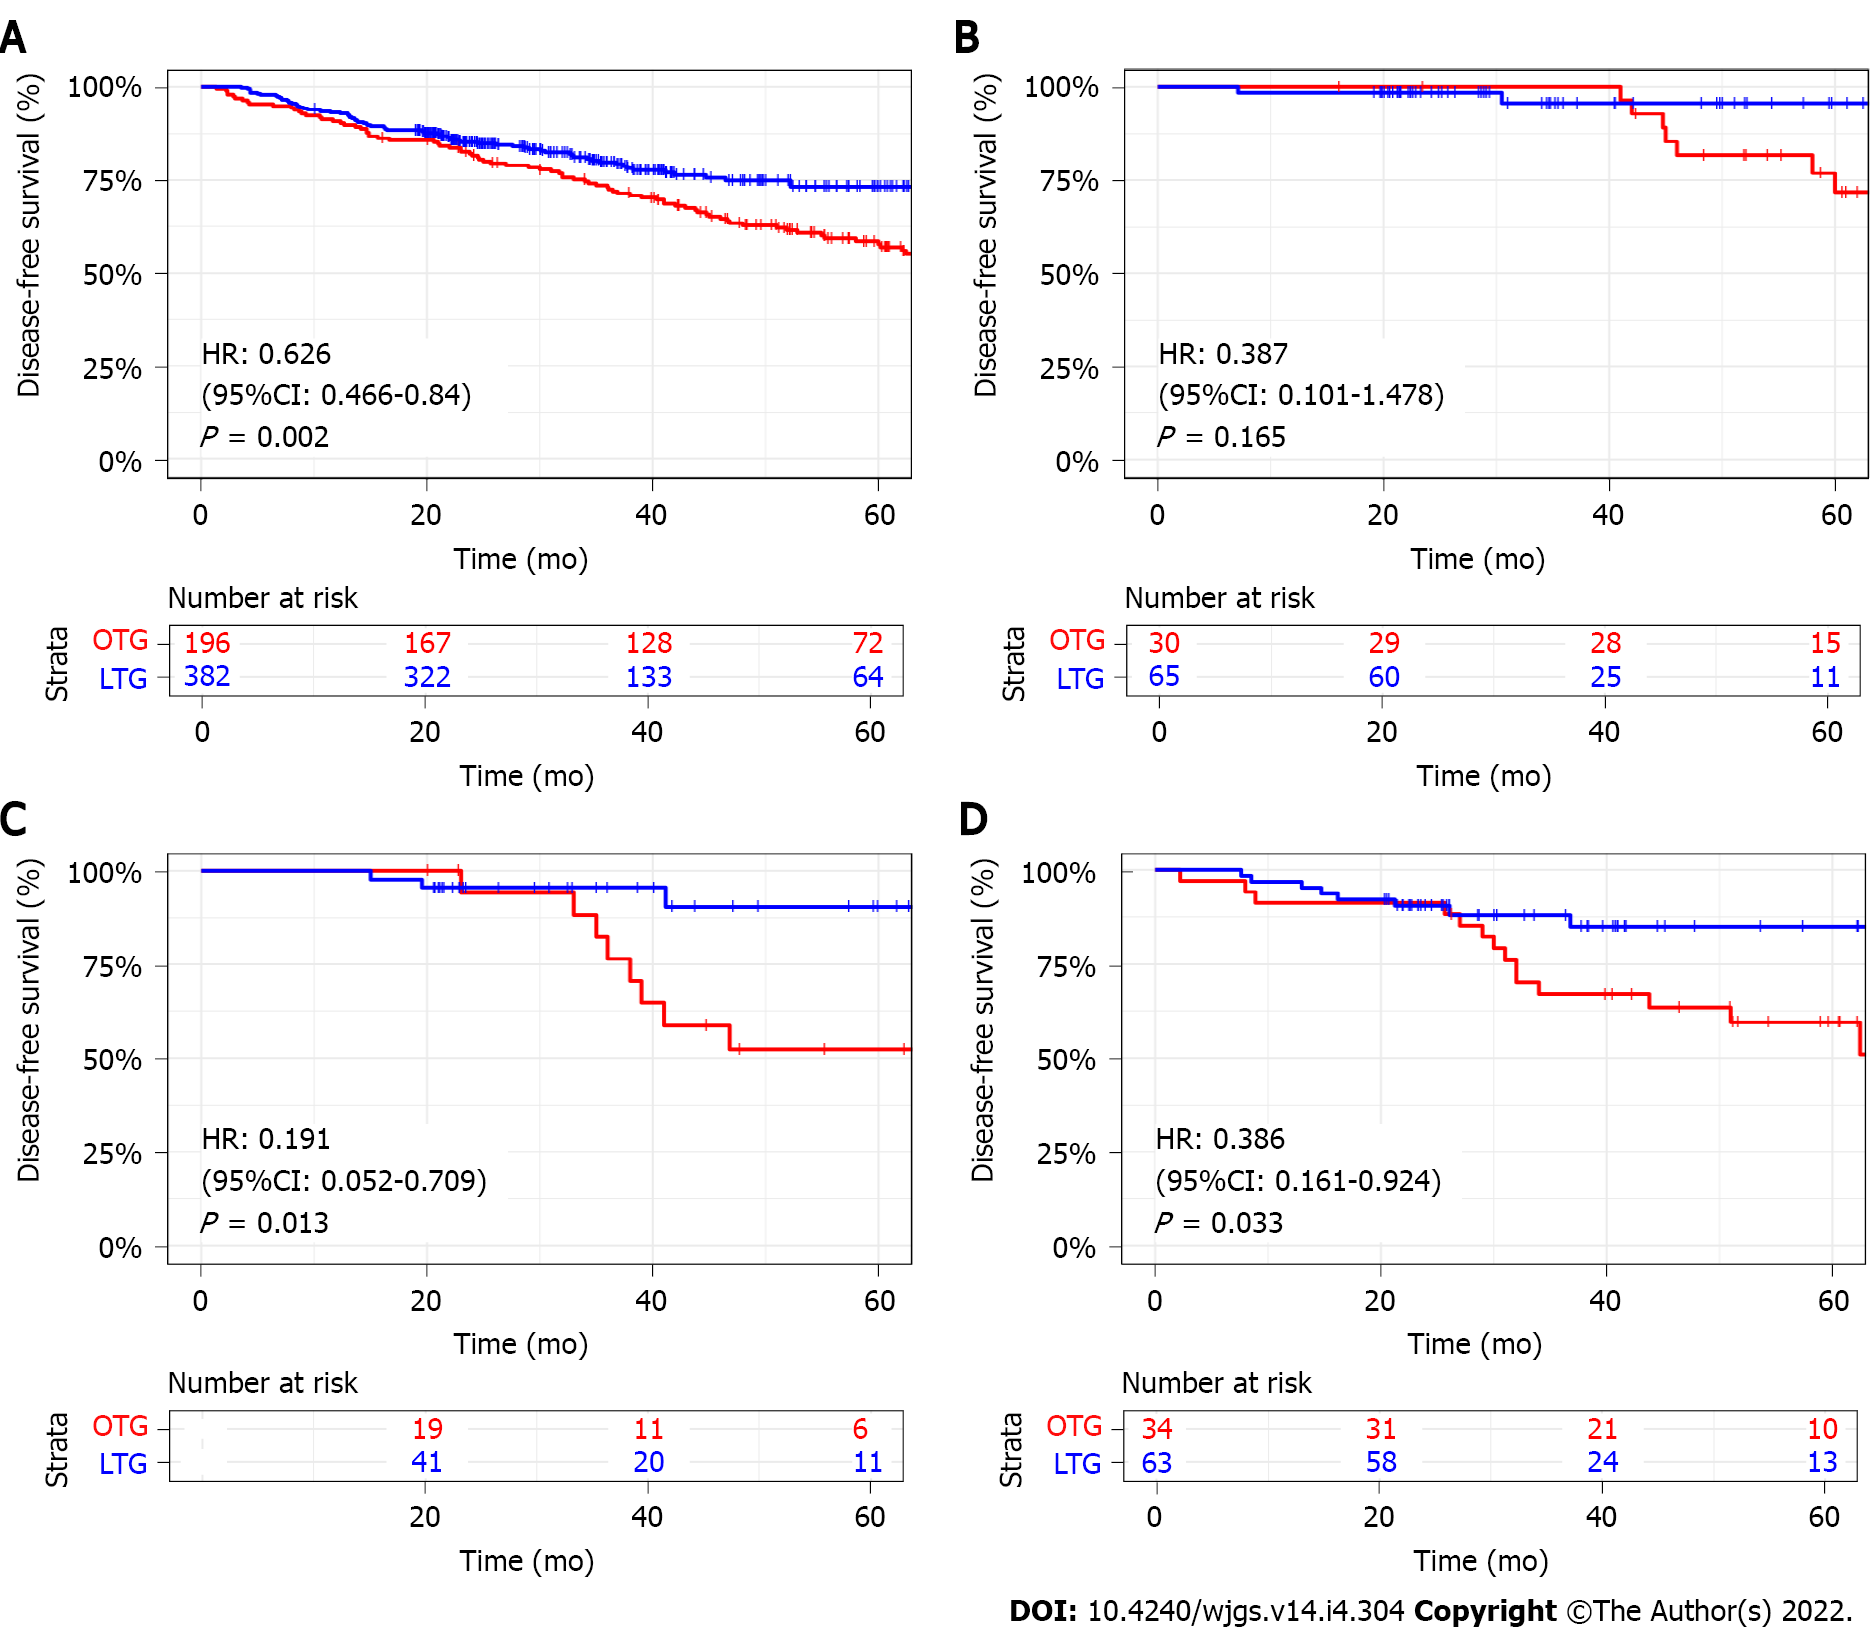
Figure 3 Comparison of disease-free survival rates between the laparoscopic-assisted transhiatal gastrectomy and open transhiatal gastrectomy groups.
A: Comparison of disease-free survival rates between the laparoscopic-assisted transhiatal gastrectomy (LTG) and open transhiatal gastrectomy (OTG) groups for all patients; B: Comparison of disease-free survival rates between the LTG and OTG groups for stage I patients; C: Comparison of disease-free survival rates between the LTG and OTG groups for stage II patients; D: Comparison of disease-free survival rates between the LTG and OTG groups for stage III patients. CI: Confidence interval; HR: Hazard ratio.
- Citation: Song QY, Li XG, Zhang LY, Wu D, Li S, Zhang BL, Xu ZY, Wu RLG, Guo X, Wang XX. Laparoscopic-assisted vs open transhiatal gastrectomy for Siewert type II adenocarcinoma of the esophagogastric junction: A retrospective cohort study. World J Gastrointest Surg 2022; 14(4): 304-314
- URL: https://www.wjgnet.com/1948-9366/full/v14/i4/304.htm
- DOI: https://dx.doi.org/10.4240/wjgs.v14.i4.304


