Copyright
©The Author(s) 2022.
World J Gastrointest Surg. Feb 27, 2022; 14(2): 200-210
Published online Feb 27, 2022. doi: 10.4240/wjgs.v14.i2.200
Published online Feb 27, 2022. doi: 10.4240/wjgs.v14.i2.200
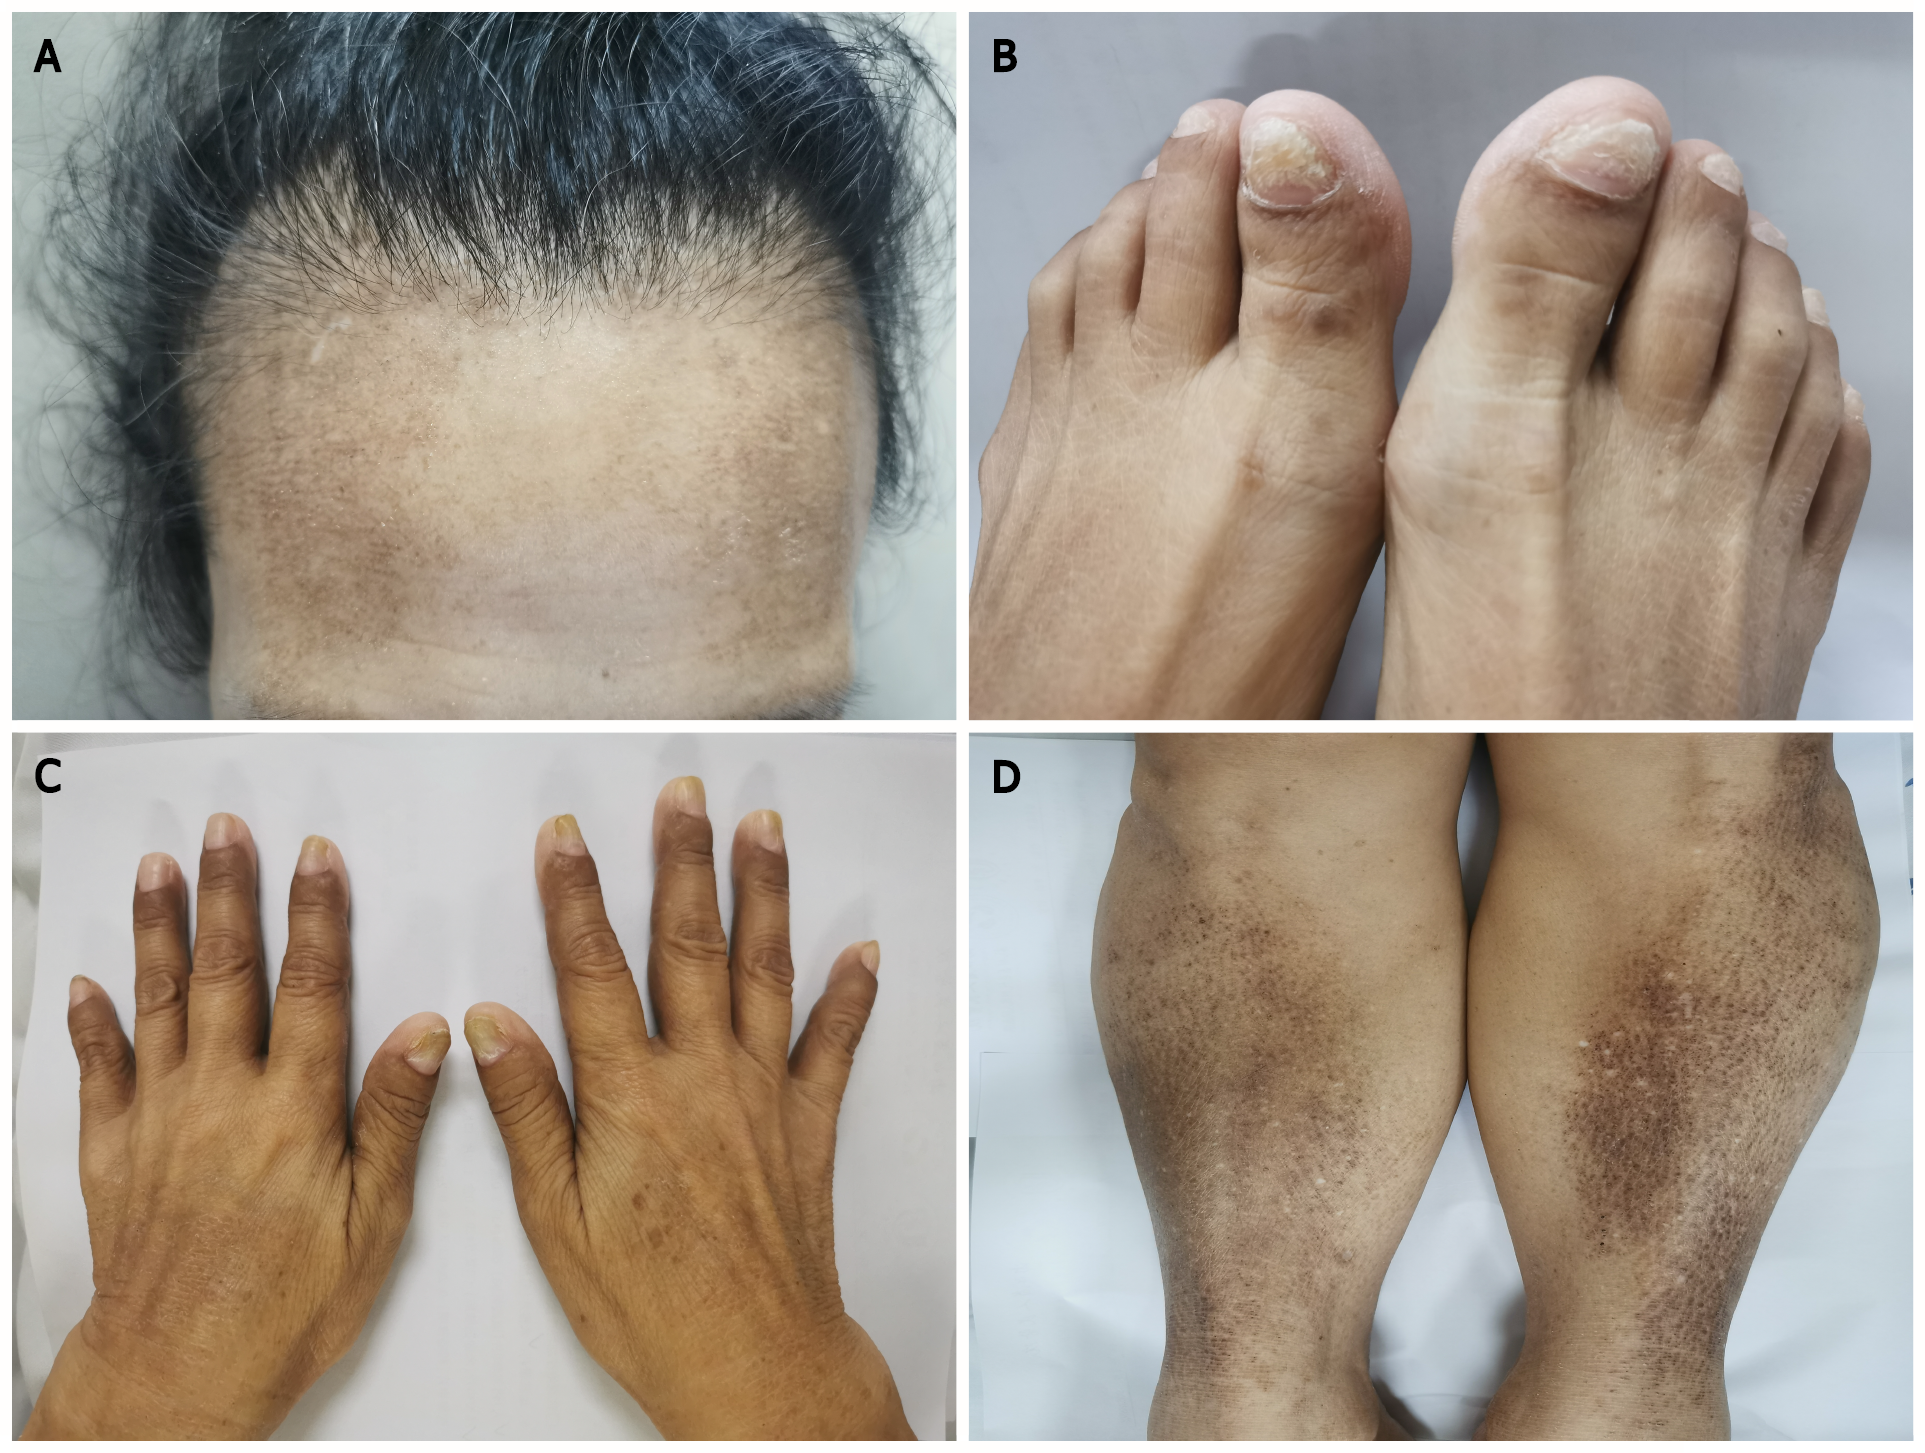
Figure 1 Physical examination.
A: Sparse hair; B: Nail dystrophy; C: Skin pigmentation of the hands; D: Skin pigmentation of the legs.
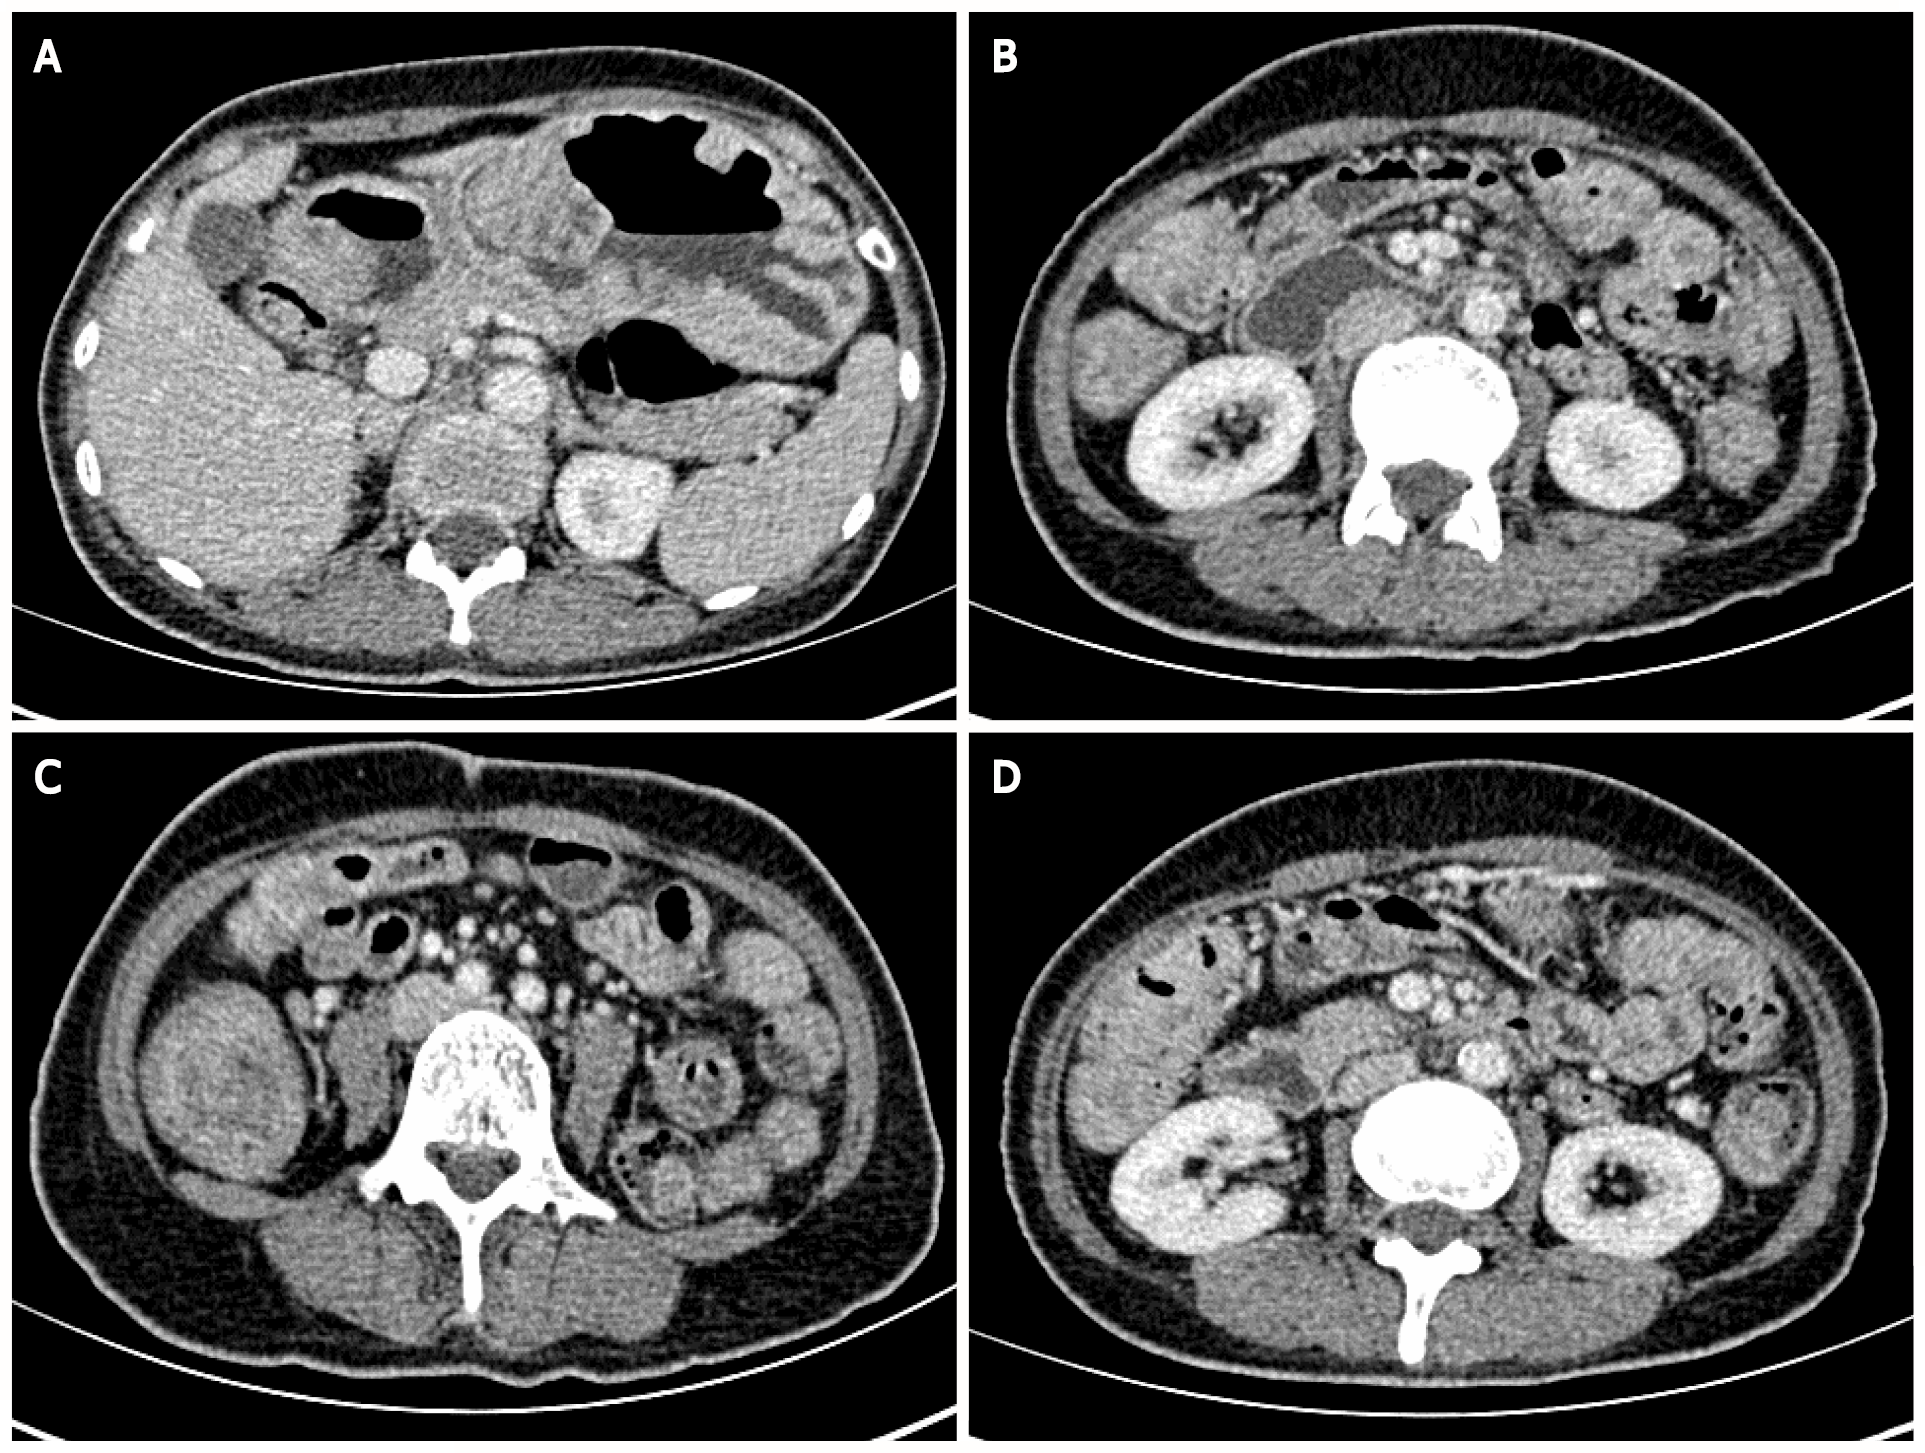
Figure 2 Abdominal enhanced computed tomography.
Thickening of the gastrointestinal tract with multiple cauliflower-like and nodular protrusions. A: The stomach wall; B: Part of the small intestinal wall; C and D: Part of the colon wall.
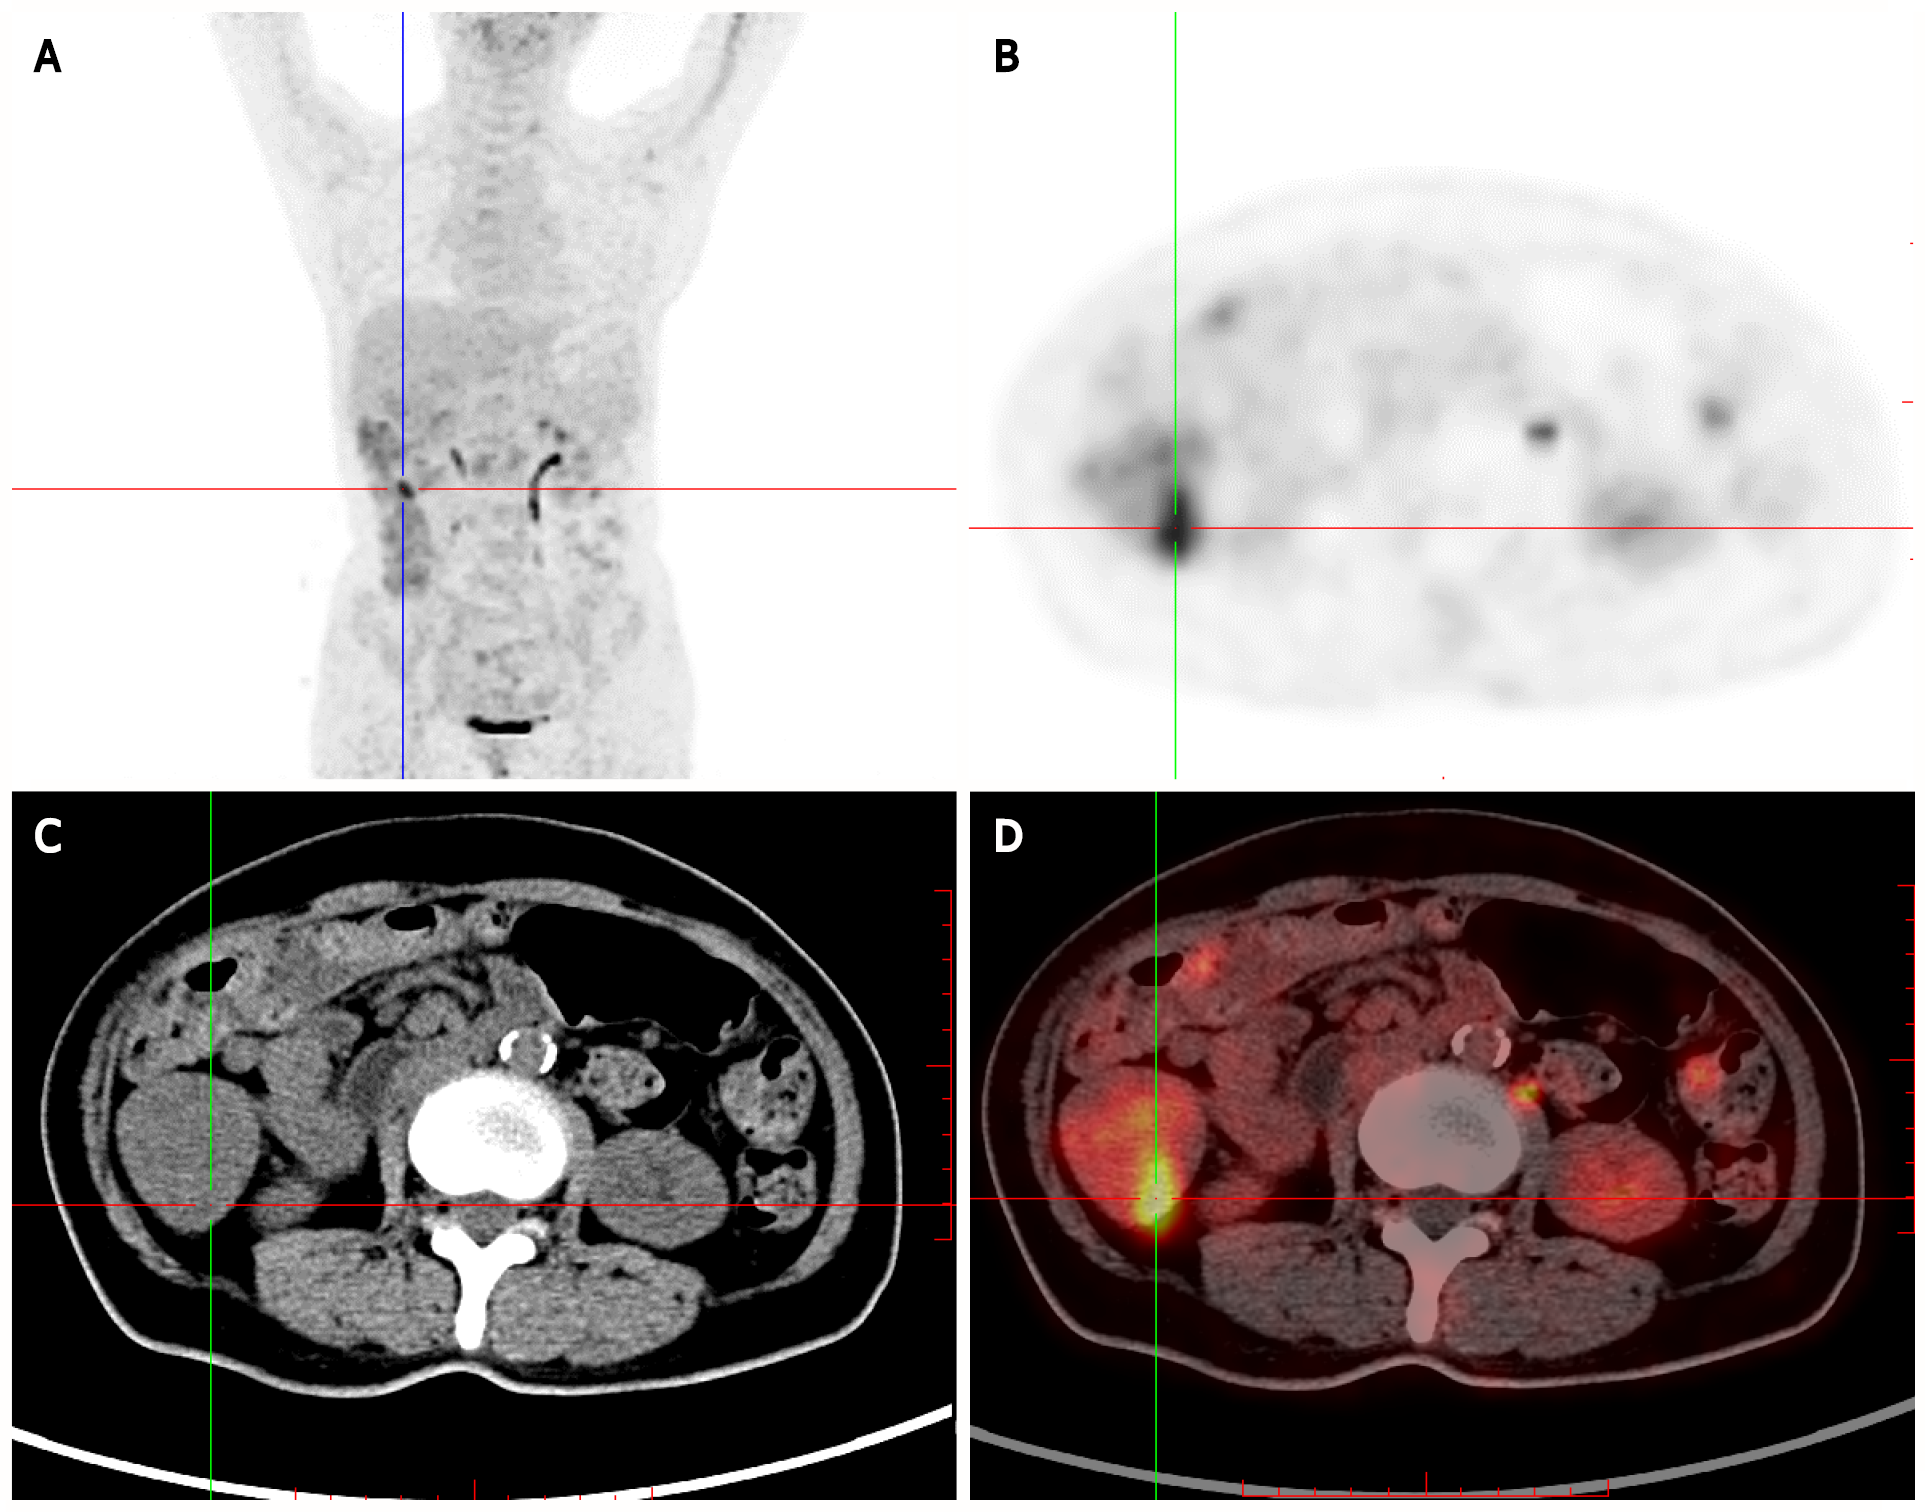
Figure 3 Positron-emission tomography/computed tomography showing multiple nodules with increased fluorodeoxyglucose uptake in the stomach wall, descending duodenum, and bulb, in the small intestine (obvious increase in the ileum), and the colon (obvious increase in the ascending colon).
Multiple nodular thickening with increased fluorodeoxyglucose (FDG) uptake was observed in the proximal rectum. A: Whole-body maximum intensity projection 18F-FDG and positron-emission tomography (PET) image; B: PET; C: Computed tomography (CT); D: PET/CT.
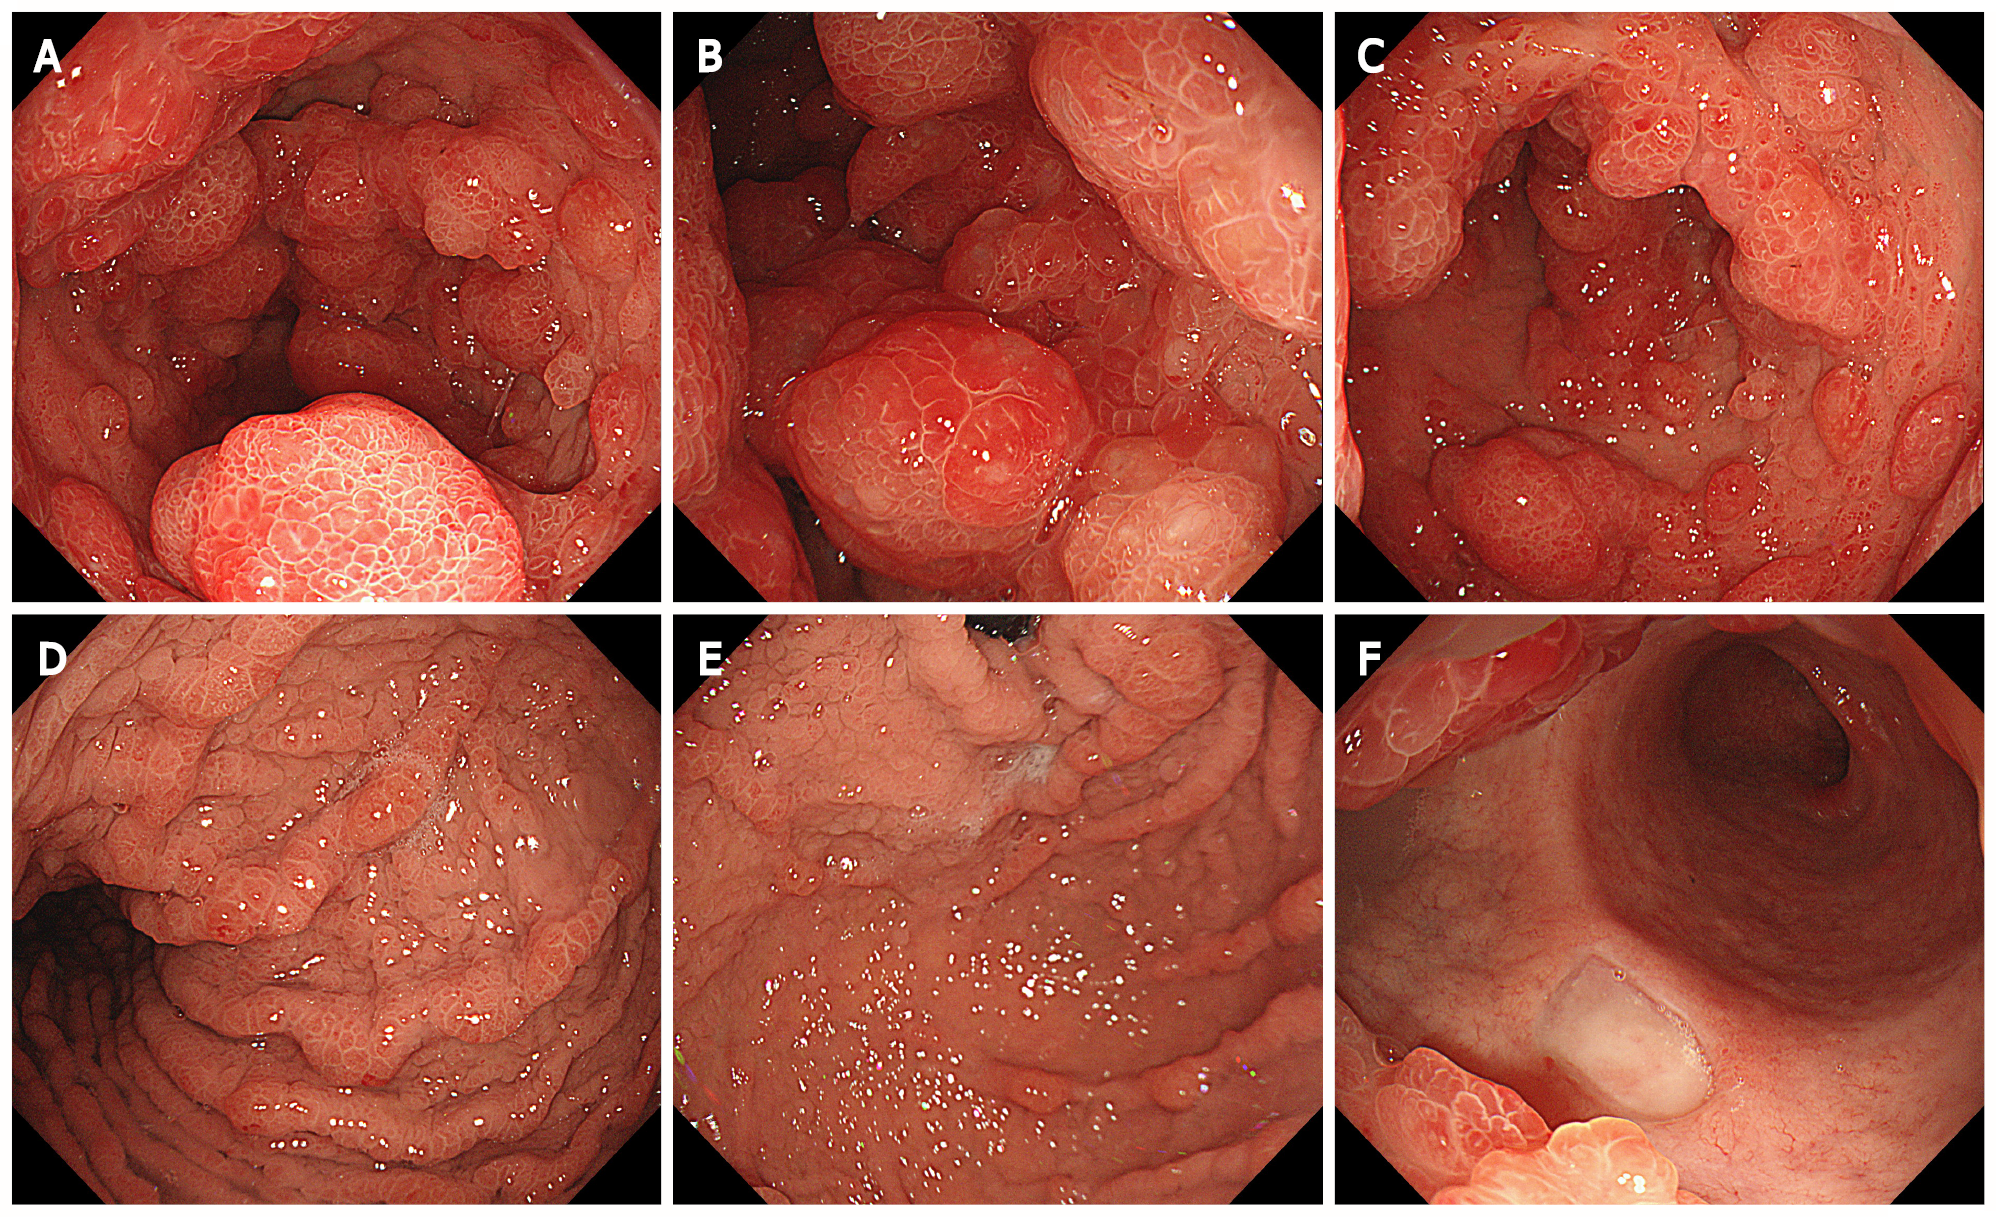
Figure 4 Endoscopic findings in the stomach.
Extensive and diffuse polypoid eminences in the stomach. A: Antrum; B: Lower part of the gastric body; C: Middle part of the gastric body; D: Upper part of the gastric body; E: Gastric fundus; F: Duodenal bulb.
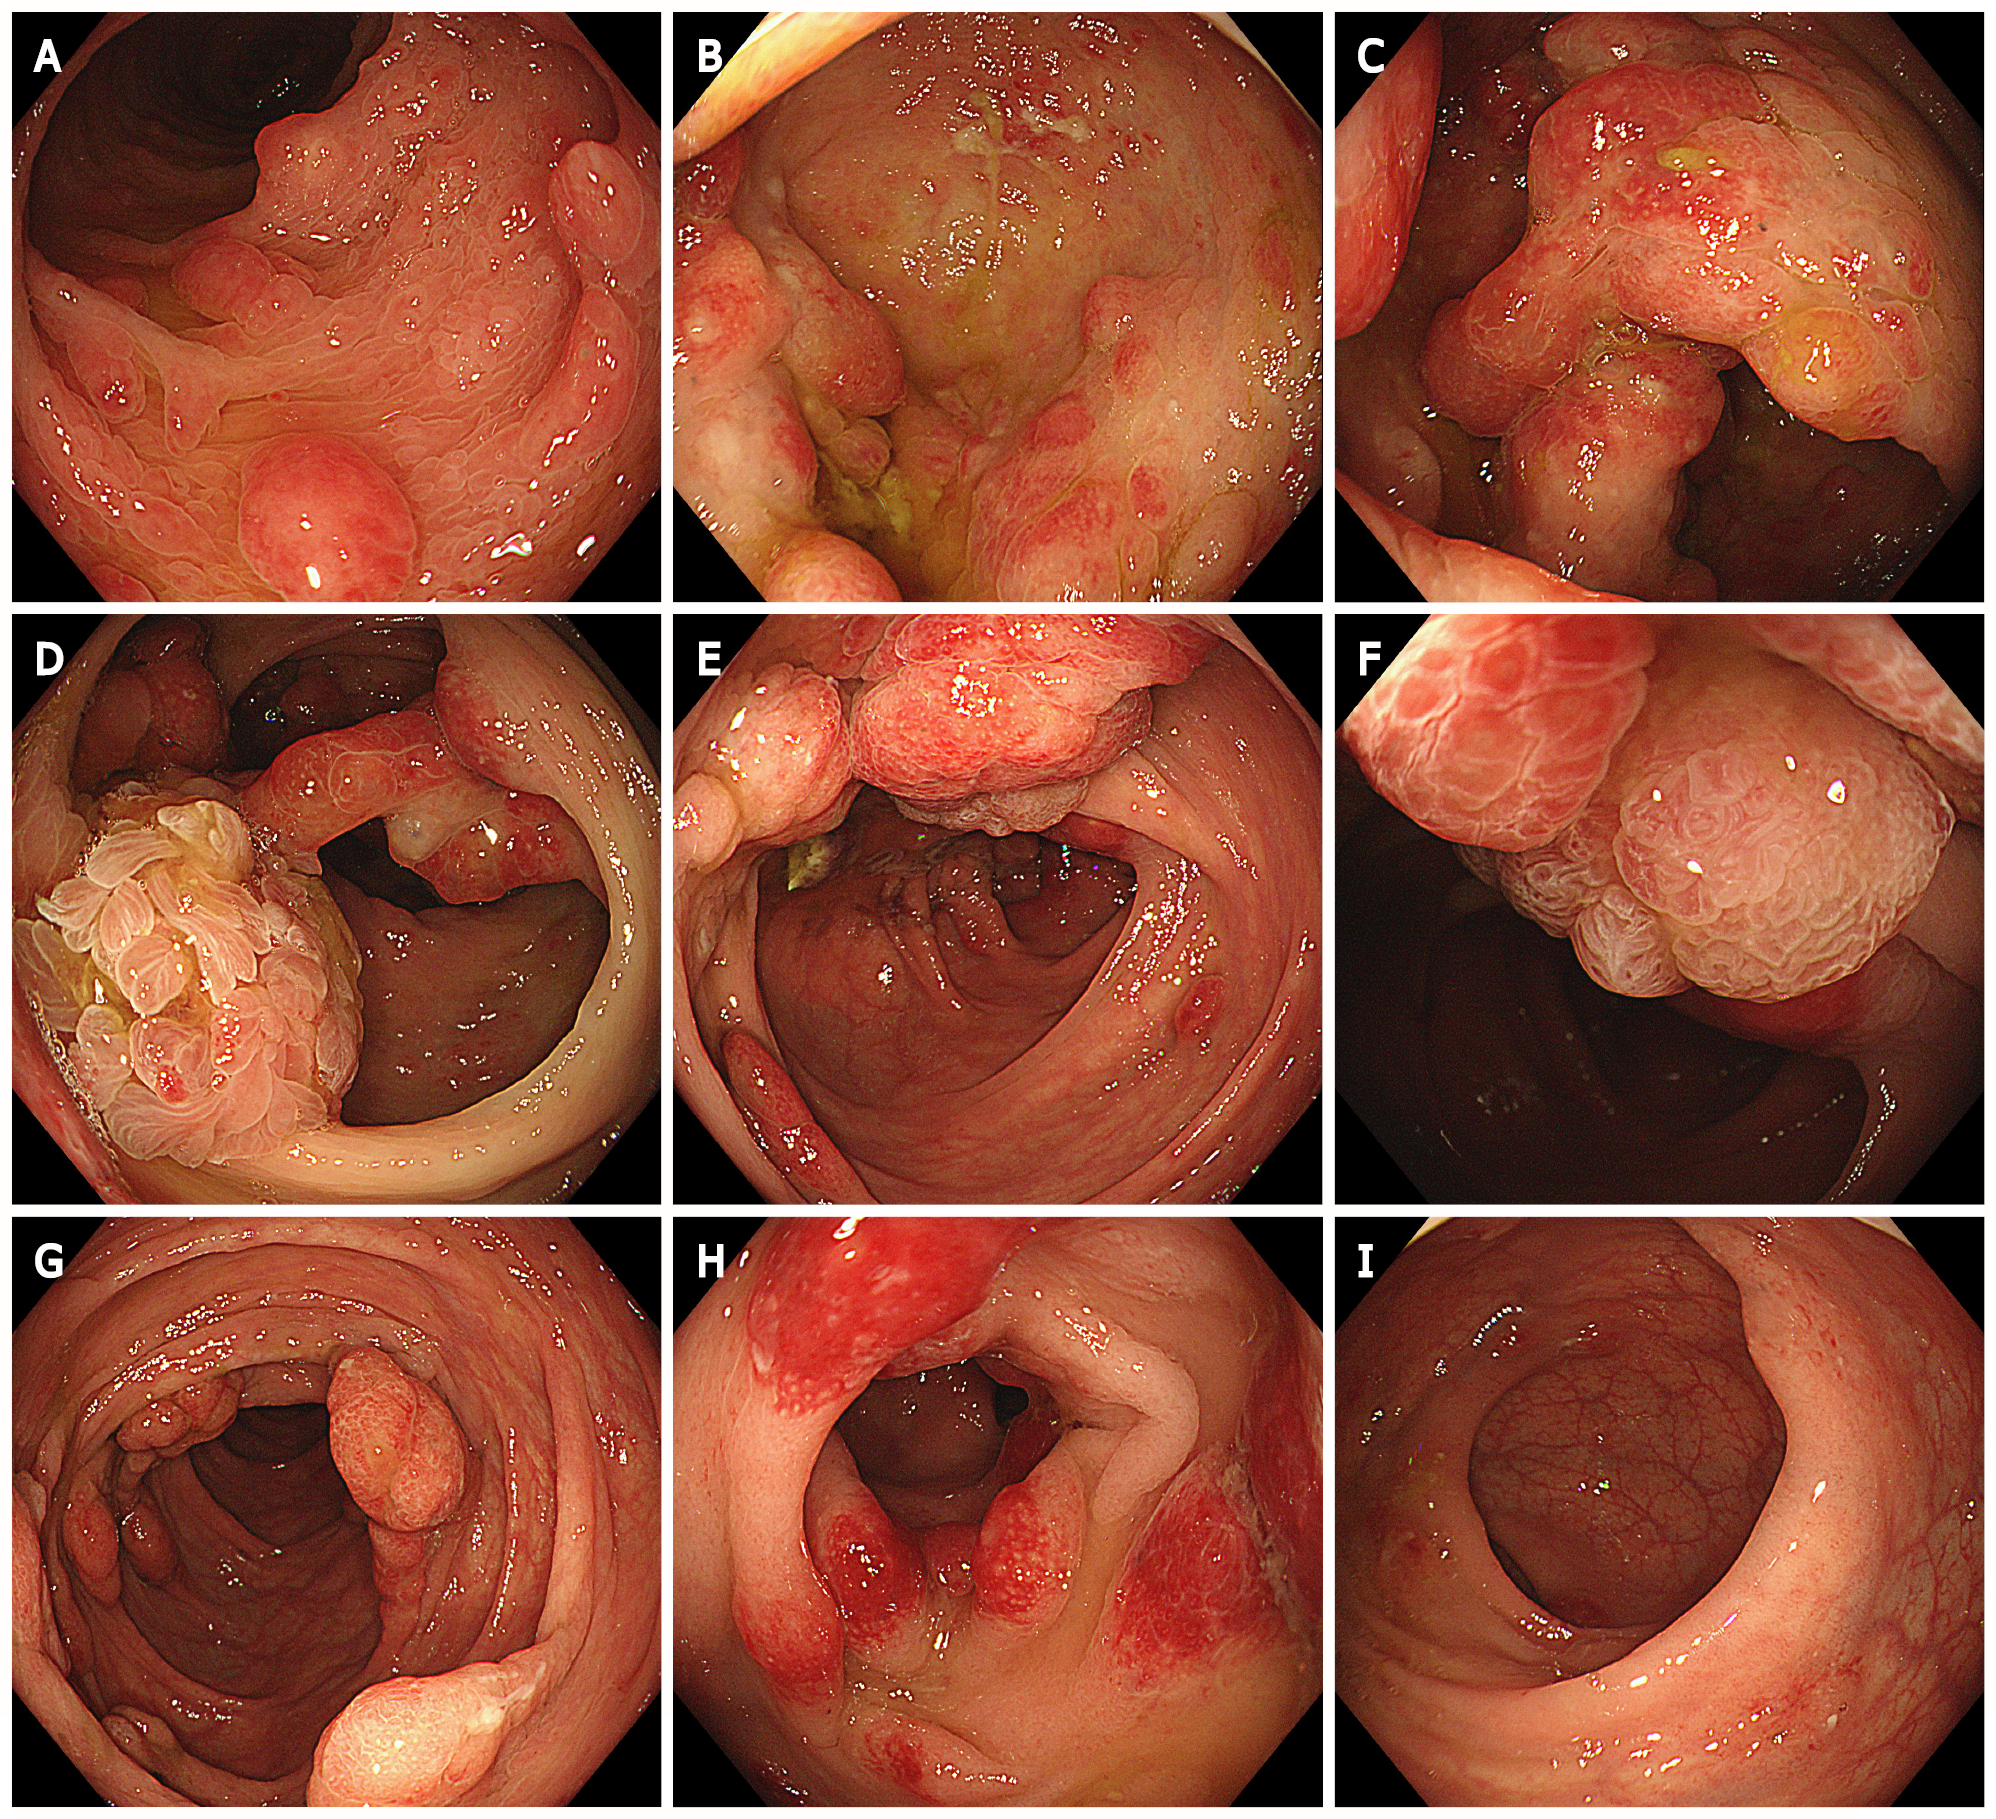
Figure 5 Endoscopic findings in the colon.
Multiple polypoid mucosal bulges in the distal small intestine and multiple polyps throughout the colon. Some were villus-like changes, and severe hyperemia was observed on the surface. A: Terminal ileum; B: Cecum; C and D: Ascending colon; E and F: Transverse colon; G: Descending colon; H: Sigmoid colon; I: Rectum.
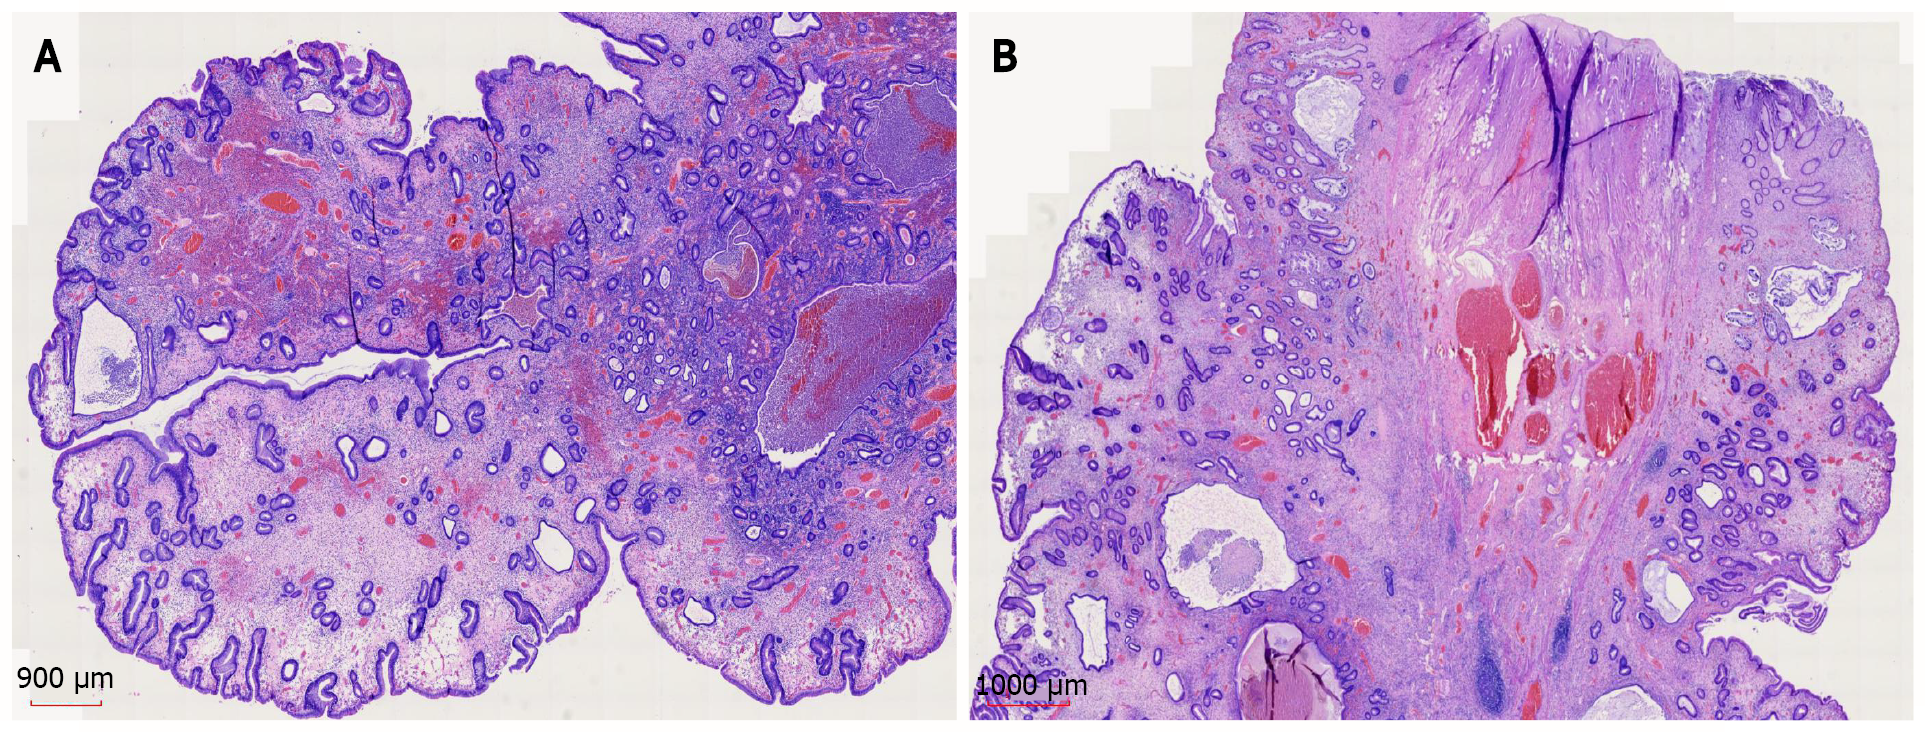
Figure 6 Histopathology and hematoxylin and eosin staining of gastroscopic pathology samples suggested a diagnosis of juvenile polyps.
A: × 11; B: × 12.5.
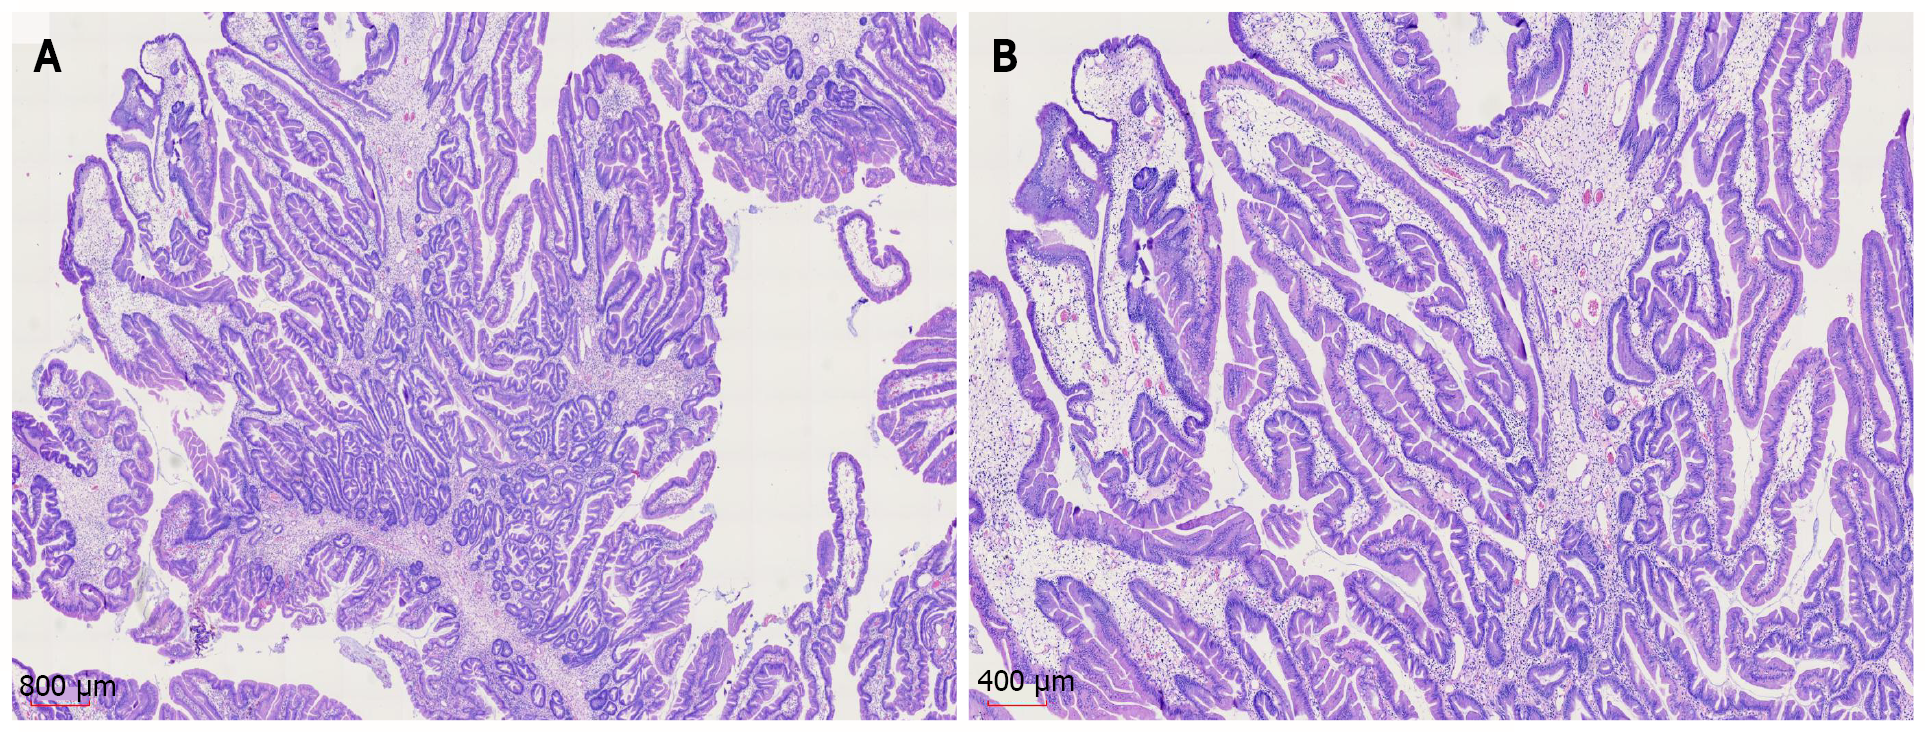
Figure 7 Histopathology and hematoxylin and eosin staining of colonoscopic pathology samples suggested a diagnosis of juvenile polyps.
A: × 12.5; B: × 25.
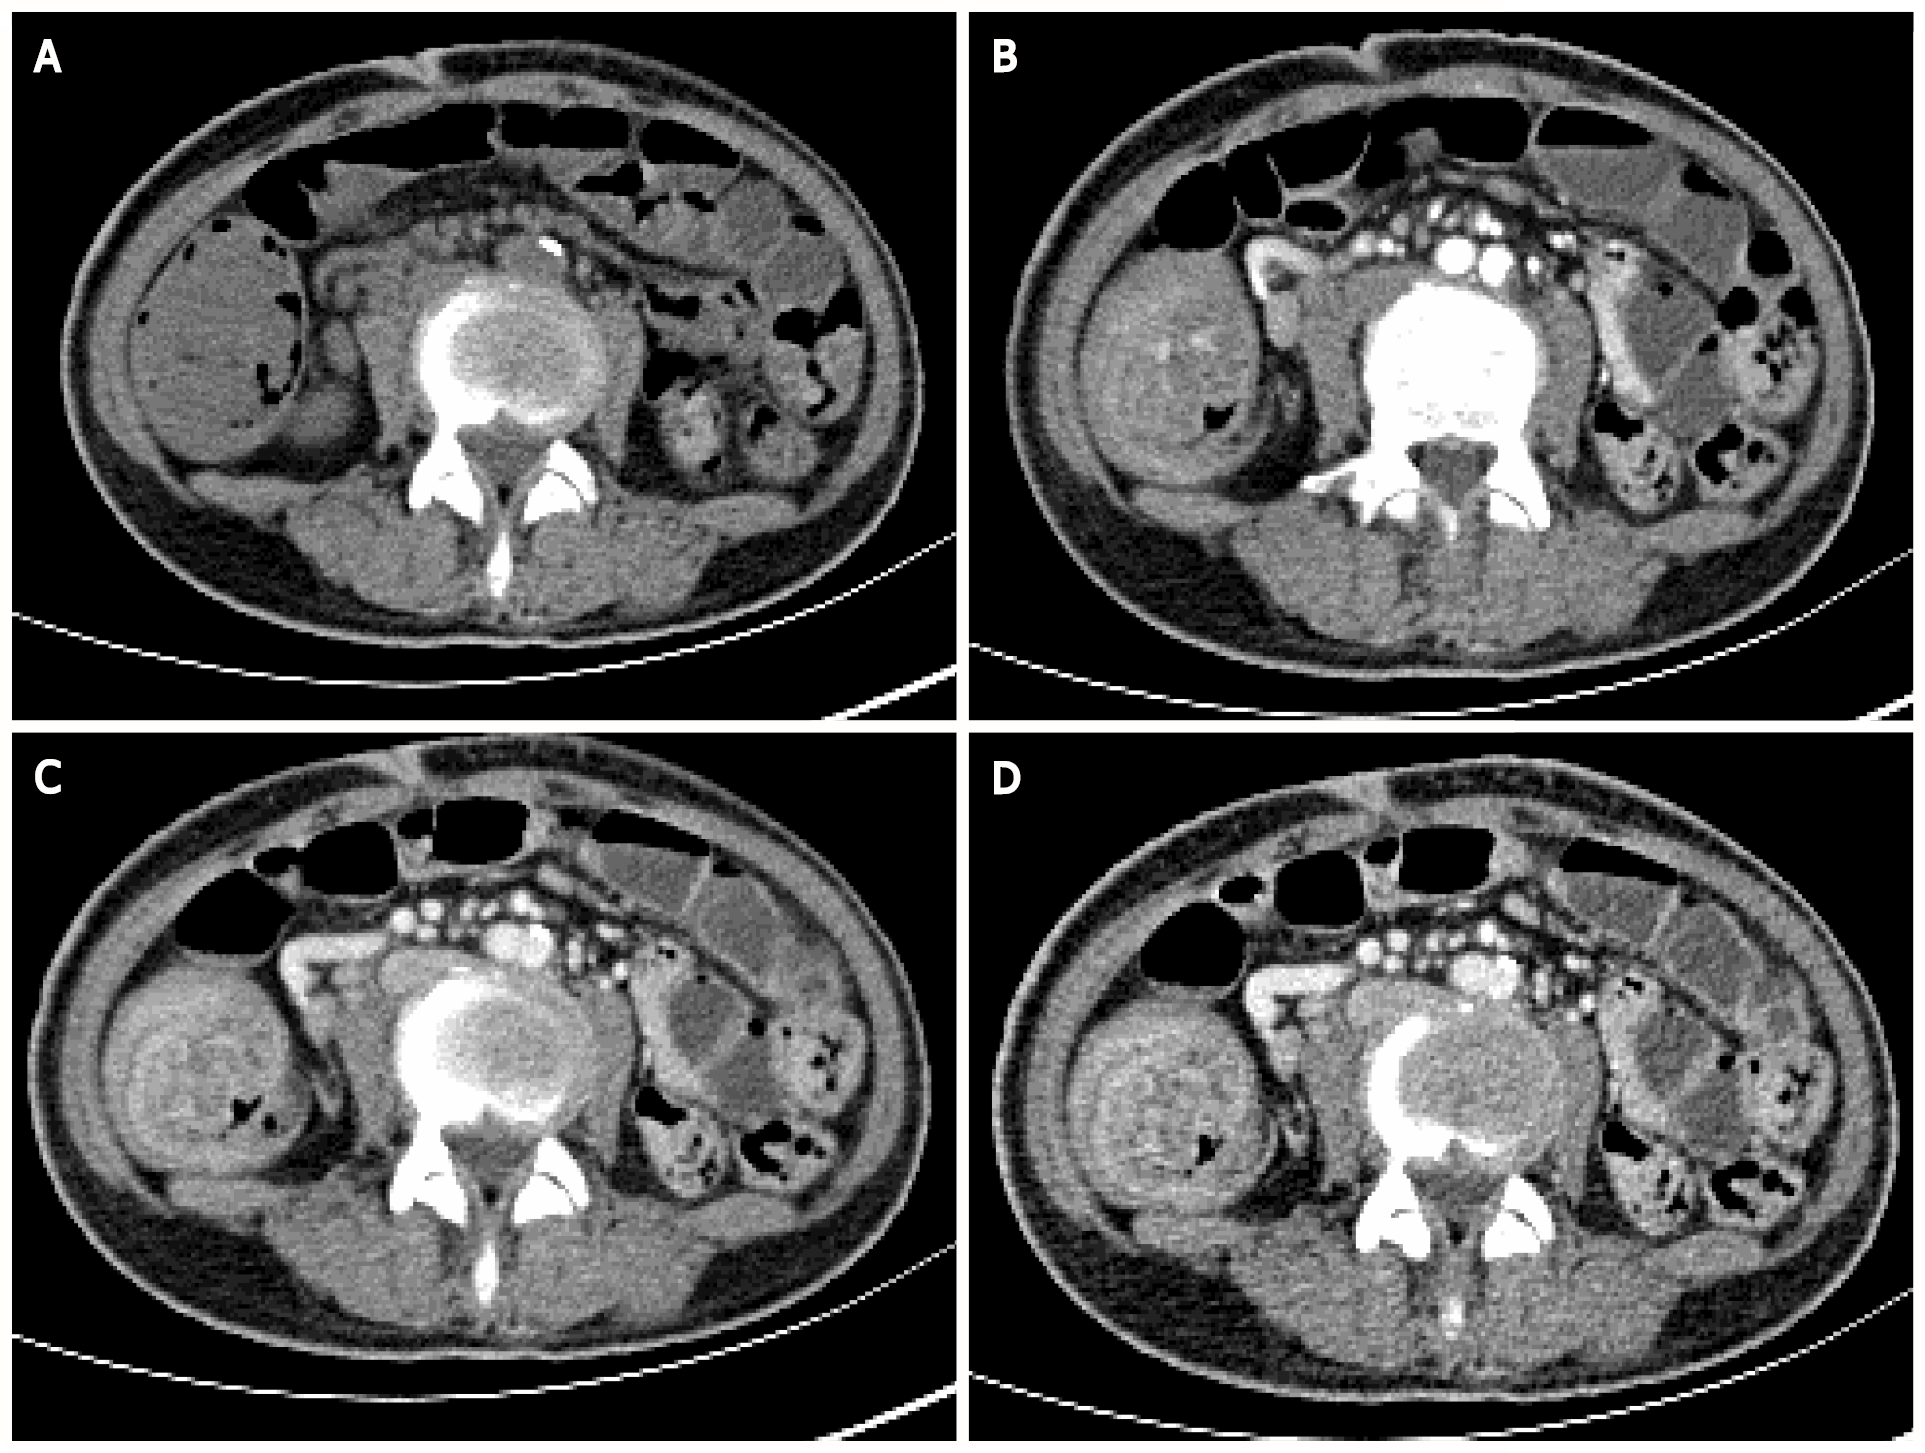
Figure 8 Abdominal enhanced computed tomography.
Multiple concentric ring signs in the ileocecal area indicating ileocecal intussusception. A: Plain computed tomography scan; B: Arterial phase; C and D: Venous phase.
- Citation: Dong J, Ma TS, Tu JF, Chen YW. Surgery for Cronkhite-Canada syndrome complicated with intussusception: A case report and review of literature. World J Gastrointest Surg 2022; 14(2): 200-210
- URL: https://www.wjgnet.com/1948-9366/full/v14/i2/200.htm
- DOI: https://dx.doi.org/10.4240/wjgs.v14.i2.200


