Copyright
©The Author(s) 2022.
World J Gastrointest Surg. Oct 27, 2022; 14(10): 1131-1140
Published online Oct 27, 2022. doi: 10.4240/wjgs.v14.i10.1131
Published online Oct 27, 2022. doi: 10.4240/wjgs.v14.i10.1131
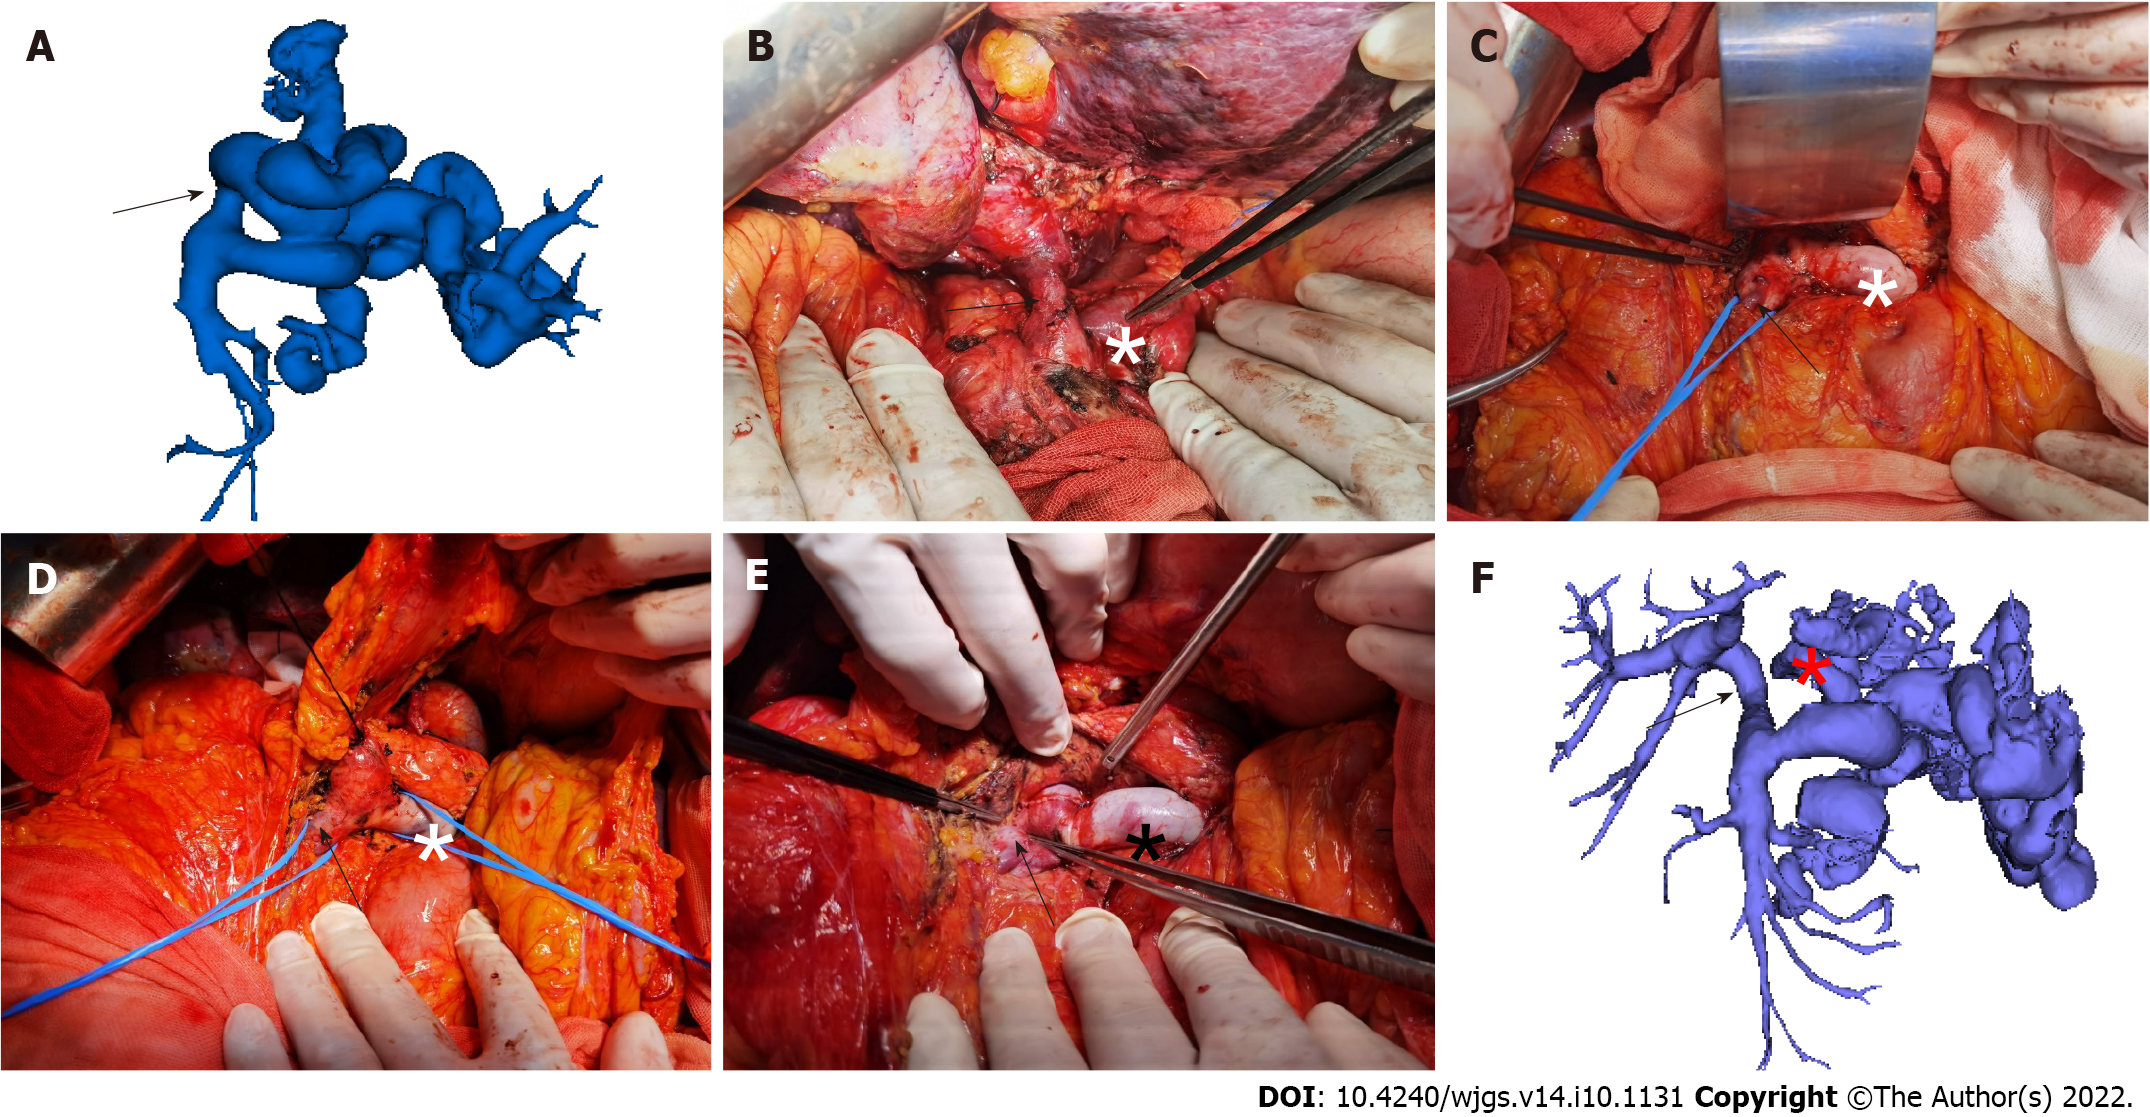
Figure 1 Main steps of reconstructing the portal vein through the posterior pancreatic tunnel technique during portal vein reconstruction in liver transplantation recipients with complex portal vein thrombosis.
A: Three-dimensional (3D) visualization model of the portal vein system constructed before surgery showed that the main portal vein was occluded, and the left gastric veins (coronary veins) were visible (arrow); B: After the varicose vessels were severed, the main portal vein (arrow) was exposed, the portal vein was dissected from the cephalic side to the upper edge of the pancreas, and the coronary varicose was ligated (*); C: Dissection started from the lower edge of the pancreas. The superior mesenteric vein (SMV) (arrow) and splenic vein (SpV) (*) were dissected successively, and the rear of the pancreas was separated towards the cephalic side along the main portal vein to establish a retropancreatic tunnel; D: The main portal vein was pulled out from the retropancreatic tunnel, and the main portal vein, SMV (arrow), and SpV (*) presented a triangular structure; E: Blood flow in the SMV and SpV was blocked. After the portal vein containing the thrombus was resected, the portal vein of the donor was pulled to the lower edge of the pancreas through the retropancreatic tunnel, and portal vein reconstruction was completed at the confluence of the SMV (arrow) and SpV (*); F: 3D visualization model of the portal vein system after surgery showed that the main portal vein was unobstructed (arrow), and the original coronary vein was severed (*).
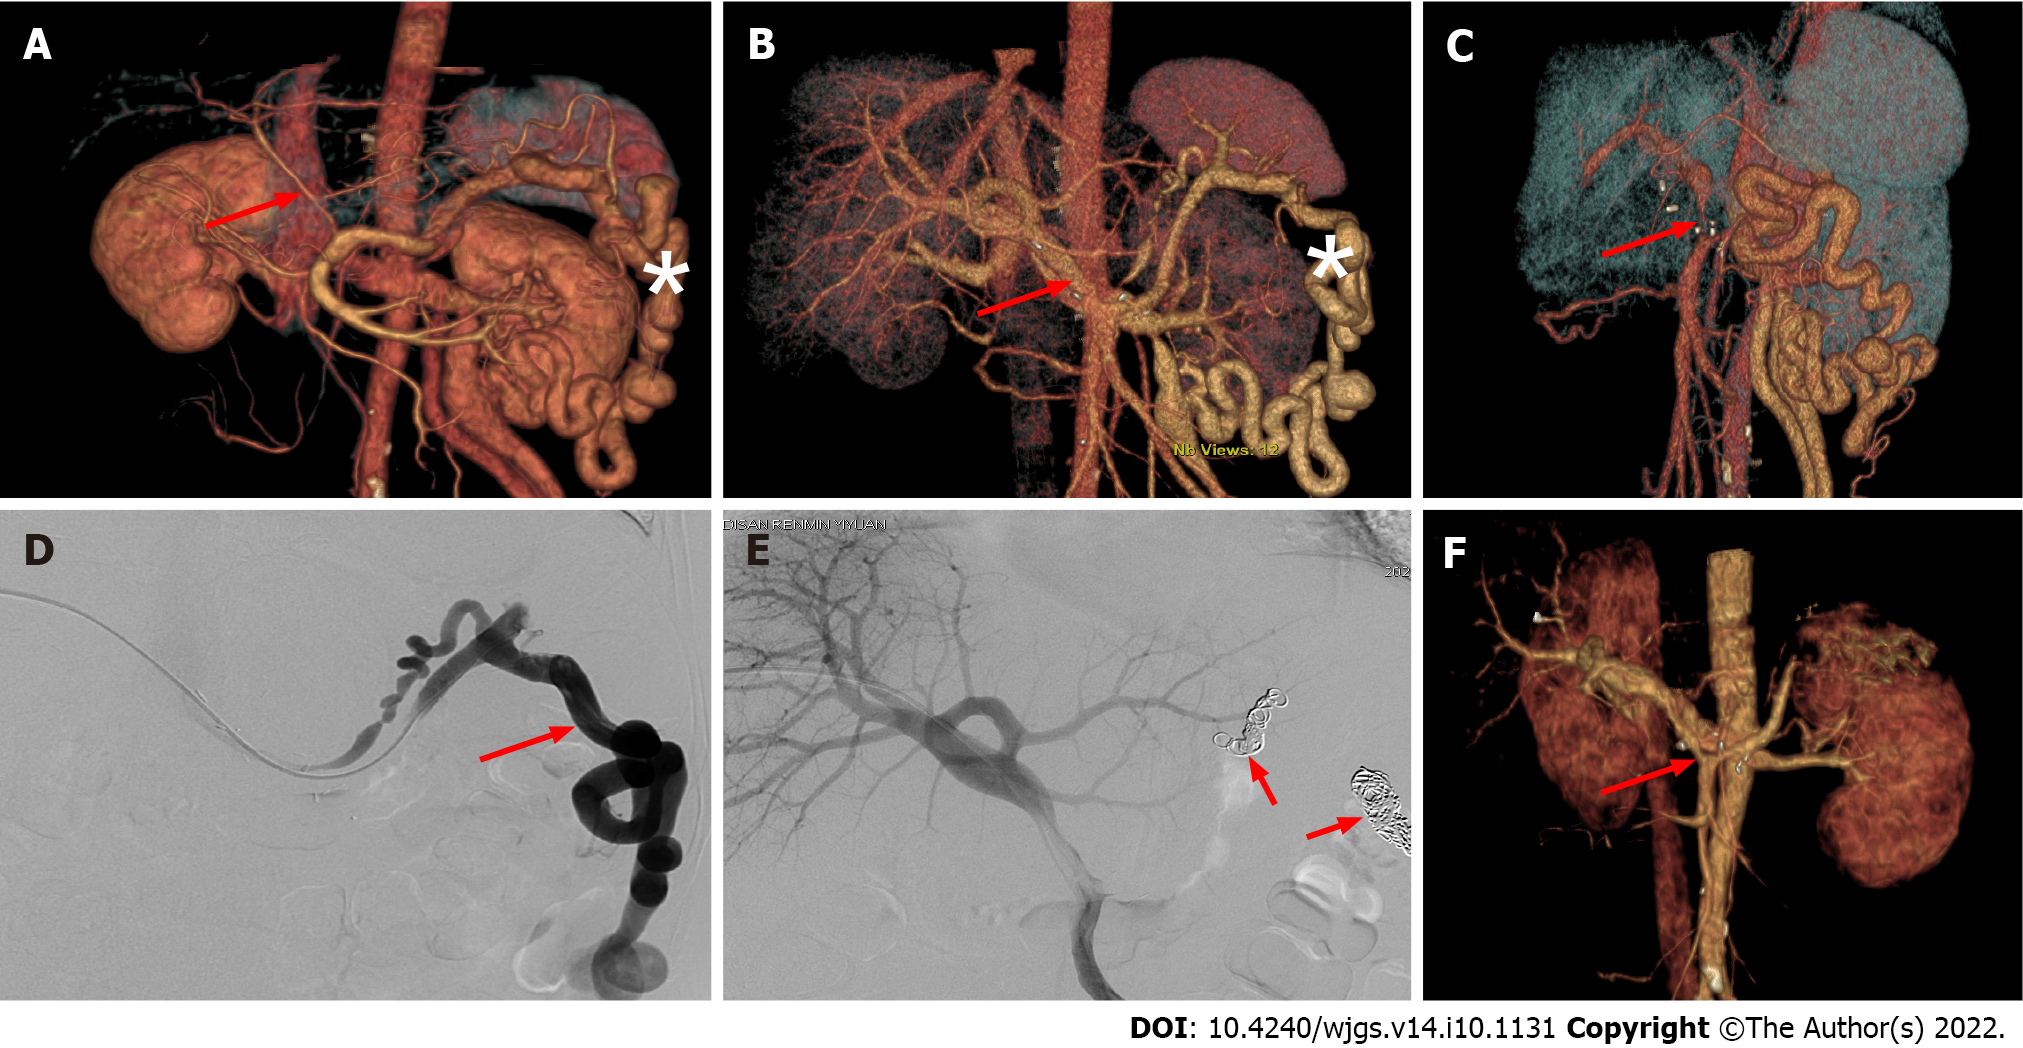
Figure 2 Embolization of large splenorenal shunt under digital subtraction angiography alleviates portal vein insufficiency after liver transplantation.
A: Preoperative three-dimensional (3D) visualization model showed a slender portal vein (arrow) and obvious splenorenal shunt varices (*); B: Postoperative 3D visualization model on day 3 showed a normal portal vein shape and unobstructed blood flow (arrow), and splenorenal shunt varicosity was reduced (*); C: Postoperative 3D visualization model (at 3 wk) showed portal vein stenosis in the initial segment (arrow), and color Doppler ultrasound examination indicated insufficient portal venous blood supply; D: Percutaneous and transhepatic splenic venography showed that most splenic venous flow drained into the inferior vena cava through the splenorenal shunt, but did not drain into the portal vein (arrow); E: After embolization of the splenorenal shunt (arrow), angiography showed that blood flow was mainly present into the portal vein; F: 3D visualization model 1 wk after the vascular intervention showed unobstructed portal vein flow (arrow), and the splenorenal shunt was no longer visible.
- Citation: Zhao D, Huang YM, Liang ZM, Zhang KJ, Fang TS, Yan X, Jin X, Zhang Y, Tang JX, Xie LJ, Zeng XC. Reconstructing the portal vein through a posterior pancreatic tunnel: New choice for portal vein thrombosis during liver transplantation. World J Gastrointest Surg 2022; 14(10): 1131-1140
- URL: https://www.wjgnet.com/1948-9366/full/v14/i10/1131.htm
- DOI: https://dx.doi.org/10.4240/wjgs.v14.i10.1131


