Copyright
©The Author(s) 2022.
World J Gastrointest Surg. Jan 27, 2022; 14(1): 46-55
Published online Jan 27, 2022. doi: 10.4240/wjgs.v14.i1.46
Published online Jan 27, 2022. doi: 10.4240/wjgs.v14.i1.46
Figure 1 Kaplan-Meier survival curves, according to the presence of pneumonia.
A: Overall survival; B: Recurrence-free survival. Red and blue lines indicate the groups with and without pneumonia, respectively.
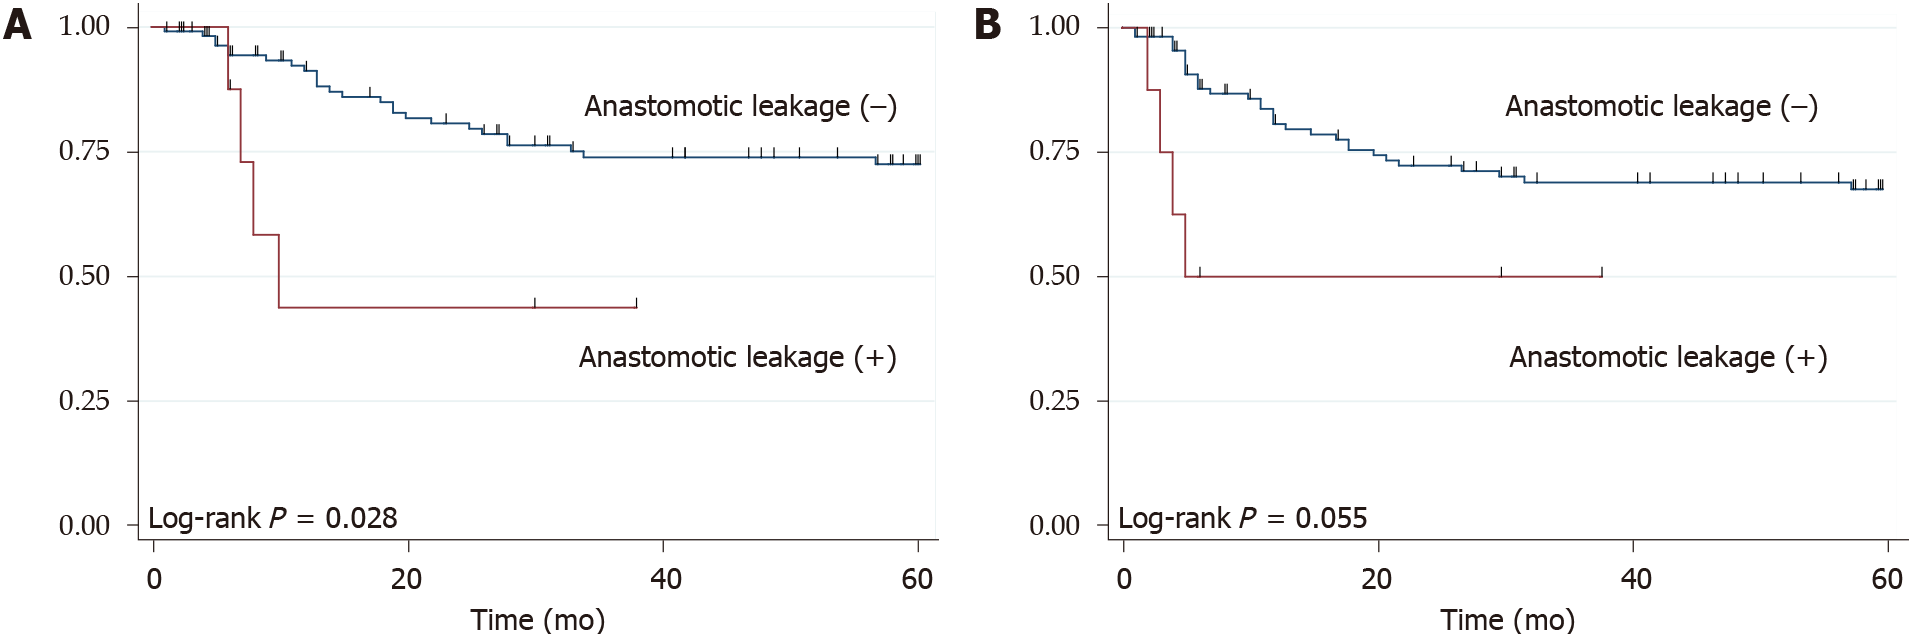
Figure 2 Kaplan–Meier survival curves, according to the presence of anastomotic leakage.
A: Overall survival; B: Recurrence-free survival. Red and blue lines indicate the groups with and without anastomotic leakage, respectively.
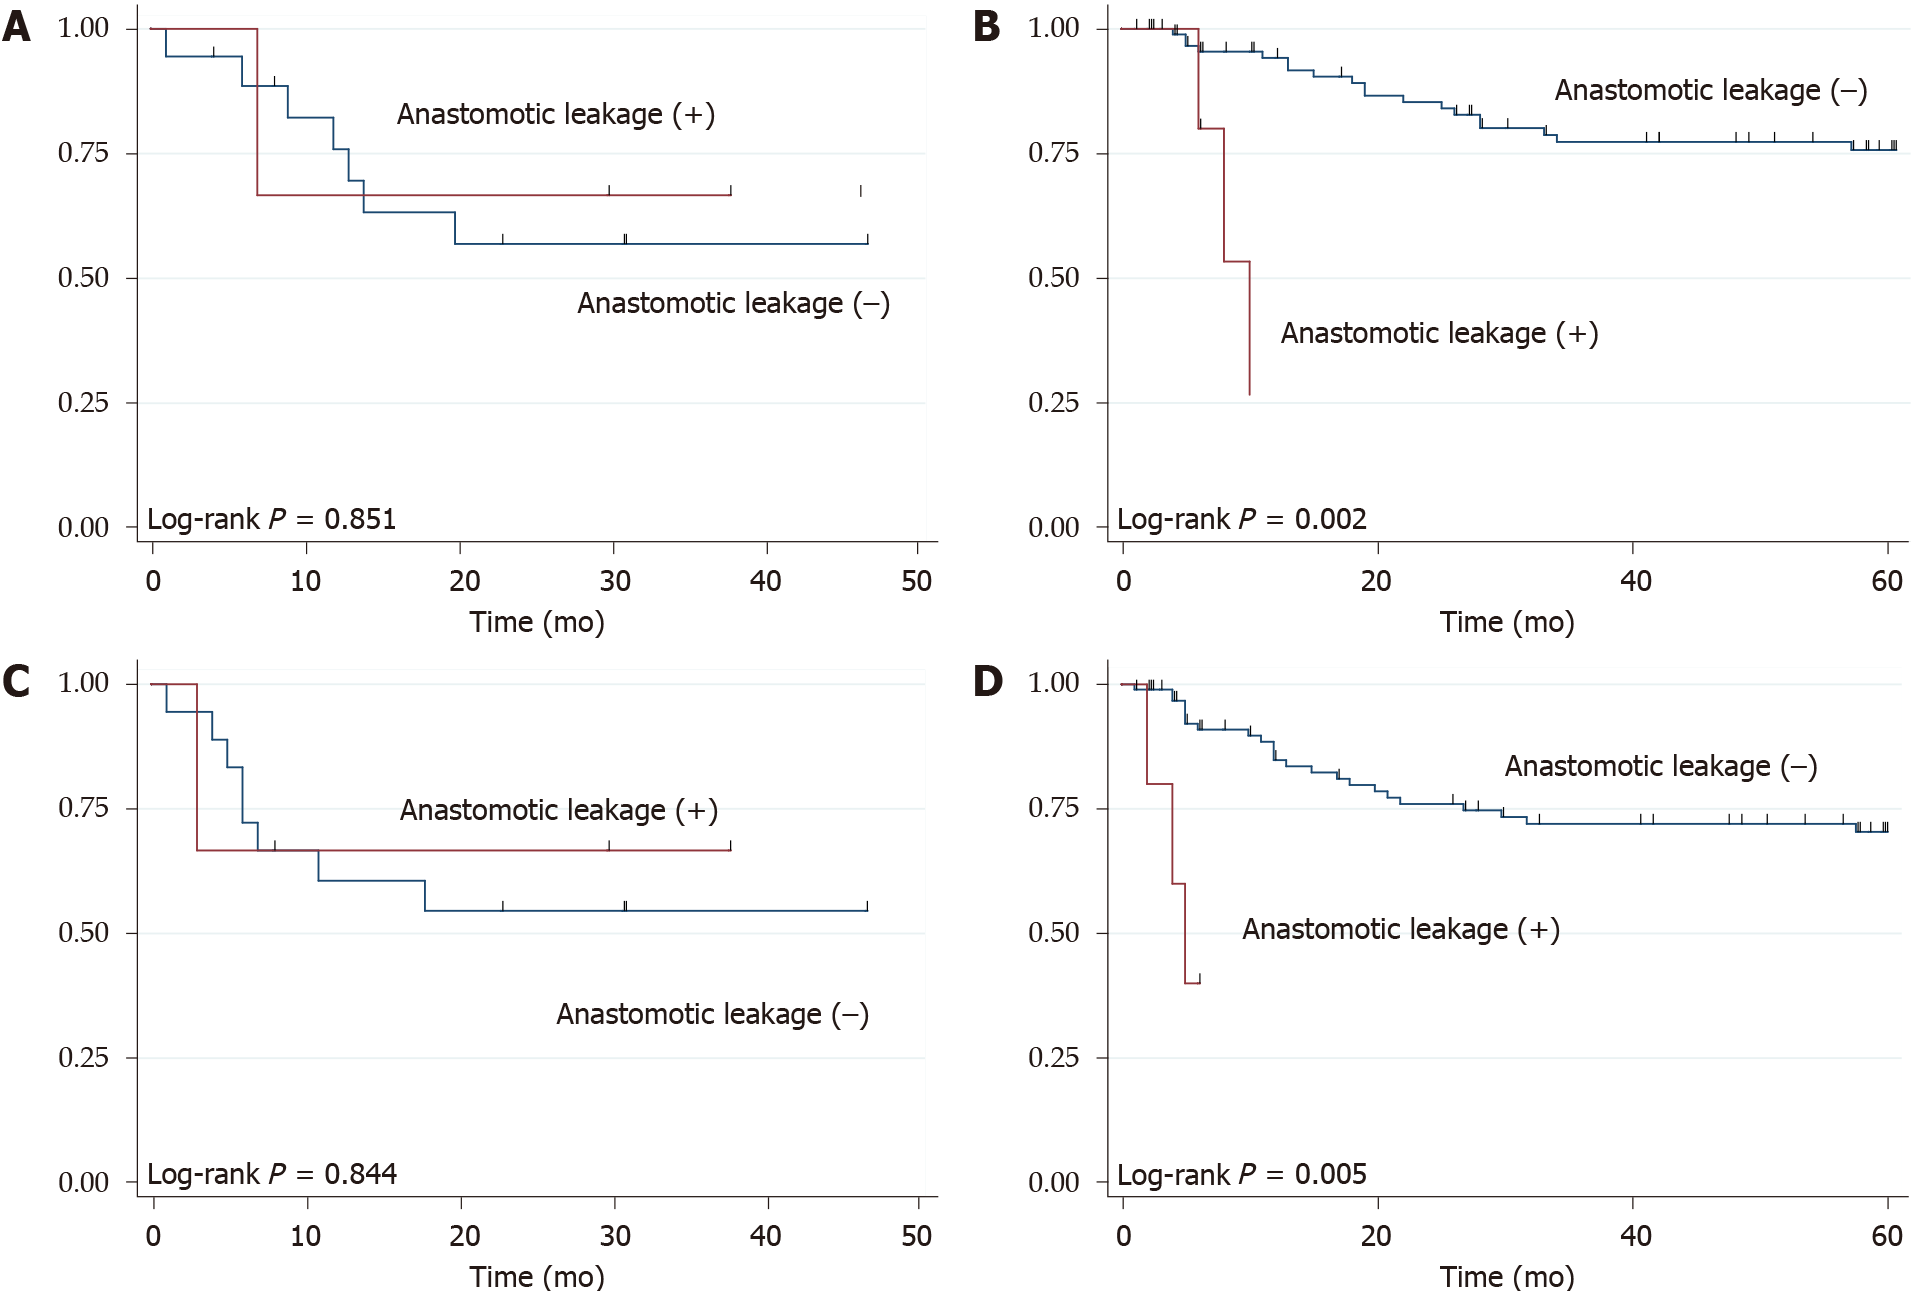
Figure 3 Kaplan–Meier survival curves, according to the presence of anastomotic leakage and type of anastomosis.
A and B: The overall survival (A) in patients with cervical anastomosis and (B) in patients with intrathoracic anastomosis; C and D: The recurrence-free survival (C) in patients with cervical anastomosis and (D) in patients with intrathoracic anastomosis. Red and blue lines indicate the groups with and without anastomotic leakage, respectively.
- Citation: Takeuchi M, Kawakubo H, Matsuda S, Mayanagi S, Irino T, Okui J, Fukuda K, Nakamura R, Wada N, Takeuchi H, Kitagawa Y. Association of anastomotic leakage with long-term oncologic outcomes of patients with esophagogastric junction cancer. World J Gastrointest Surg 2022; 14(1): 46-55
- URL: https://www.wjgnet.com/1948-9366/full/v14/i1/46.htm
- DOI: https://dx.doi.org/10.4240/wjgs.v14.i1.46


