Copyright
©The Author(s) 2021.
World J Gastrointest Surg. Aug 27, 2021; 13(8): 848-858
Published online Aug 27, 2021. doi: 10.4240/wjgs.v13.i8.848
Published online Aug 27, 2021. doi: 10.4240/wjgs.v13.i8.848
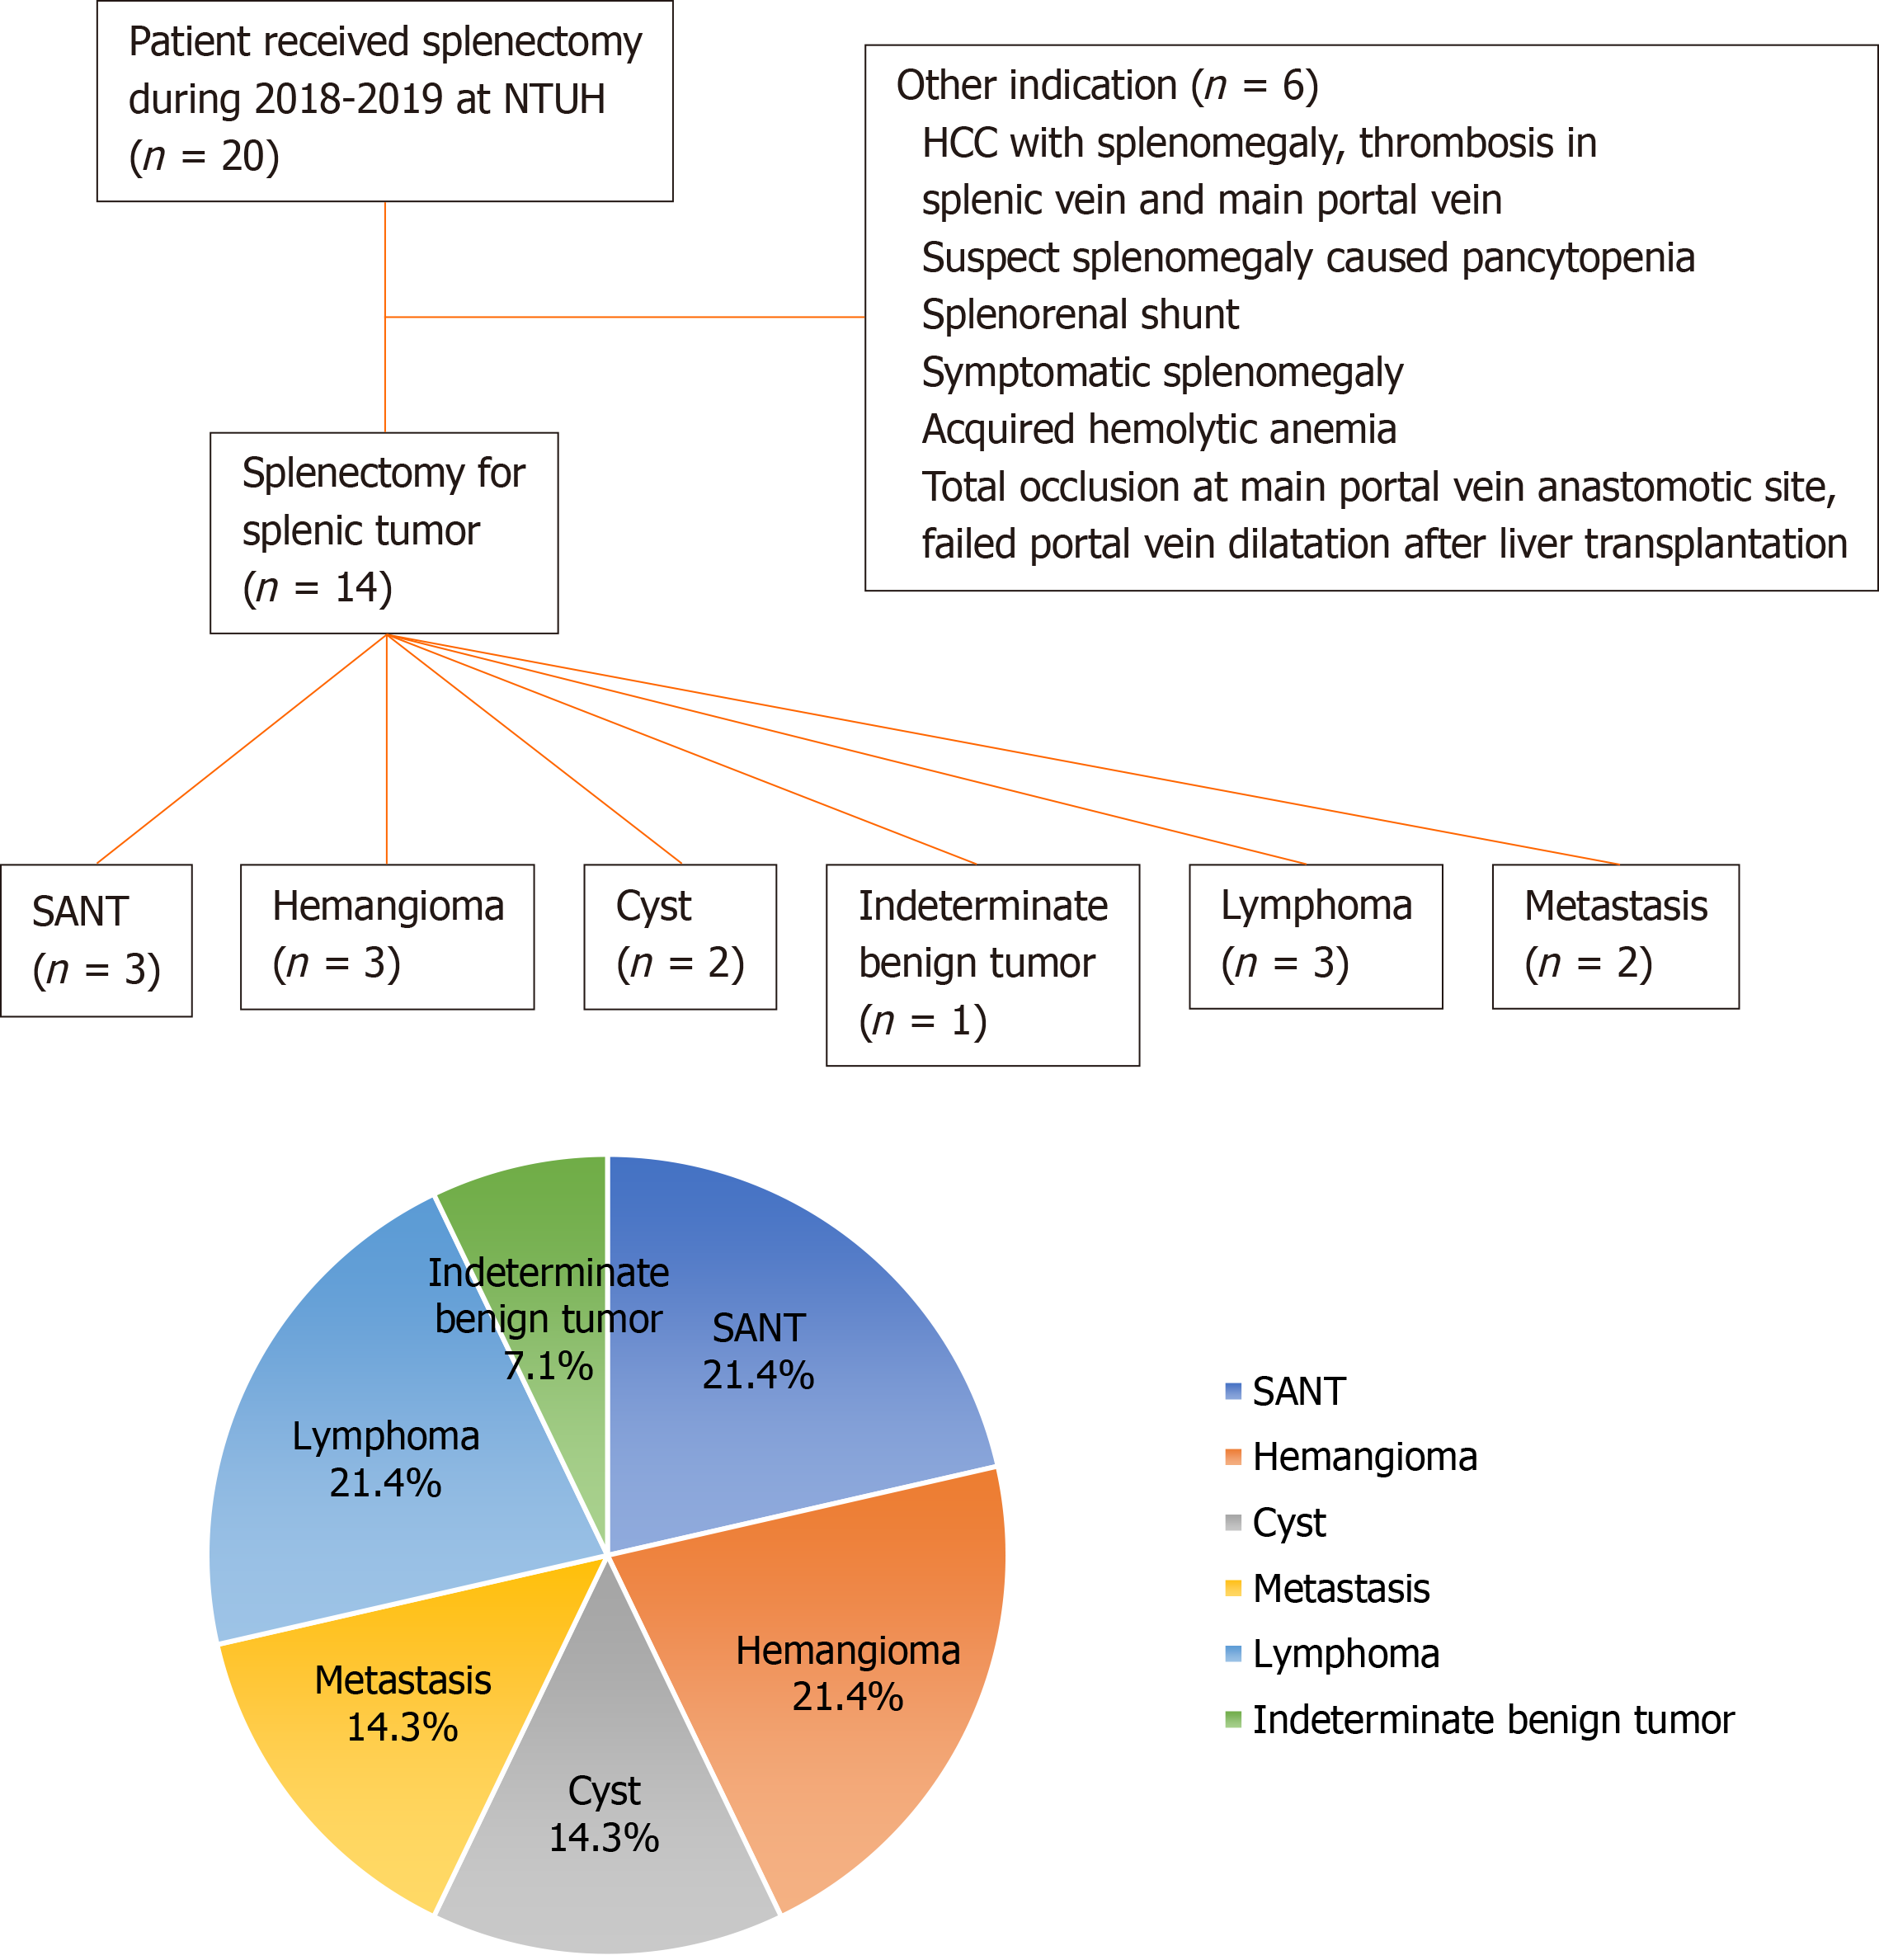
Figure 1 Schema of patient selection process and splenic tumor classification.
SANT: Sclerosing angiomatoid nodular transformation; HCC: Hepatocellular carcinoma; NTUH: National Taiwan University Hospital.
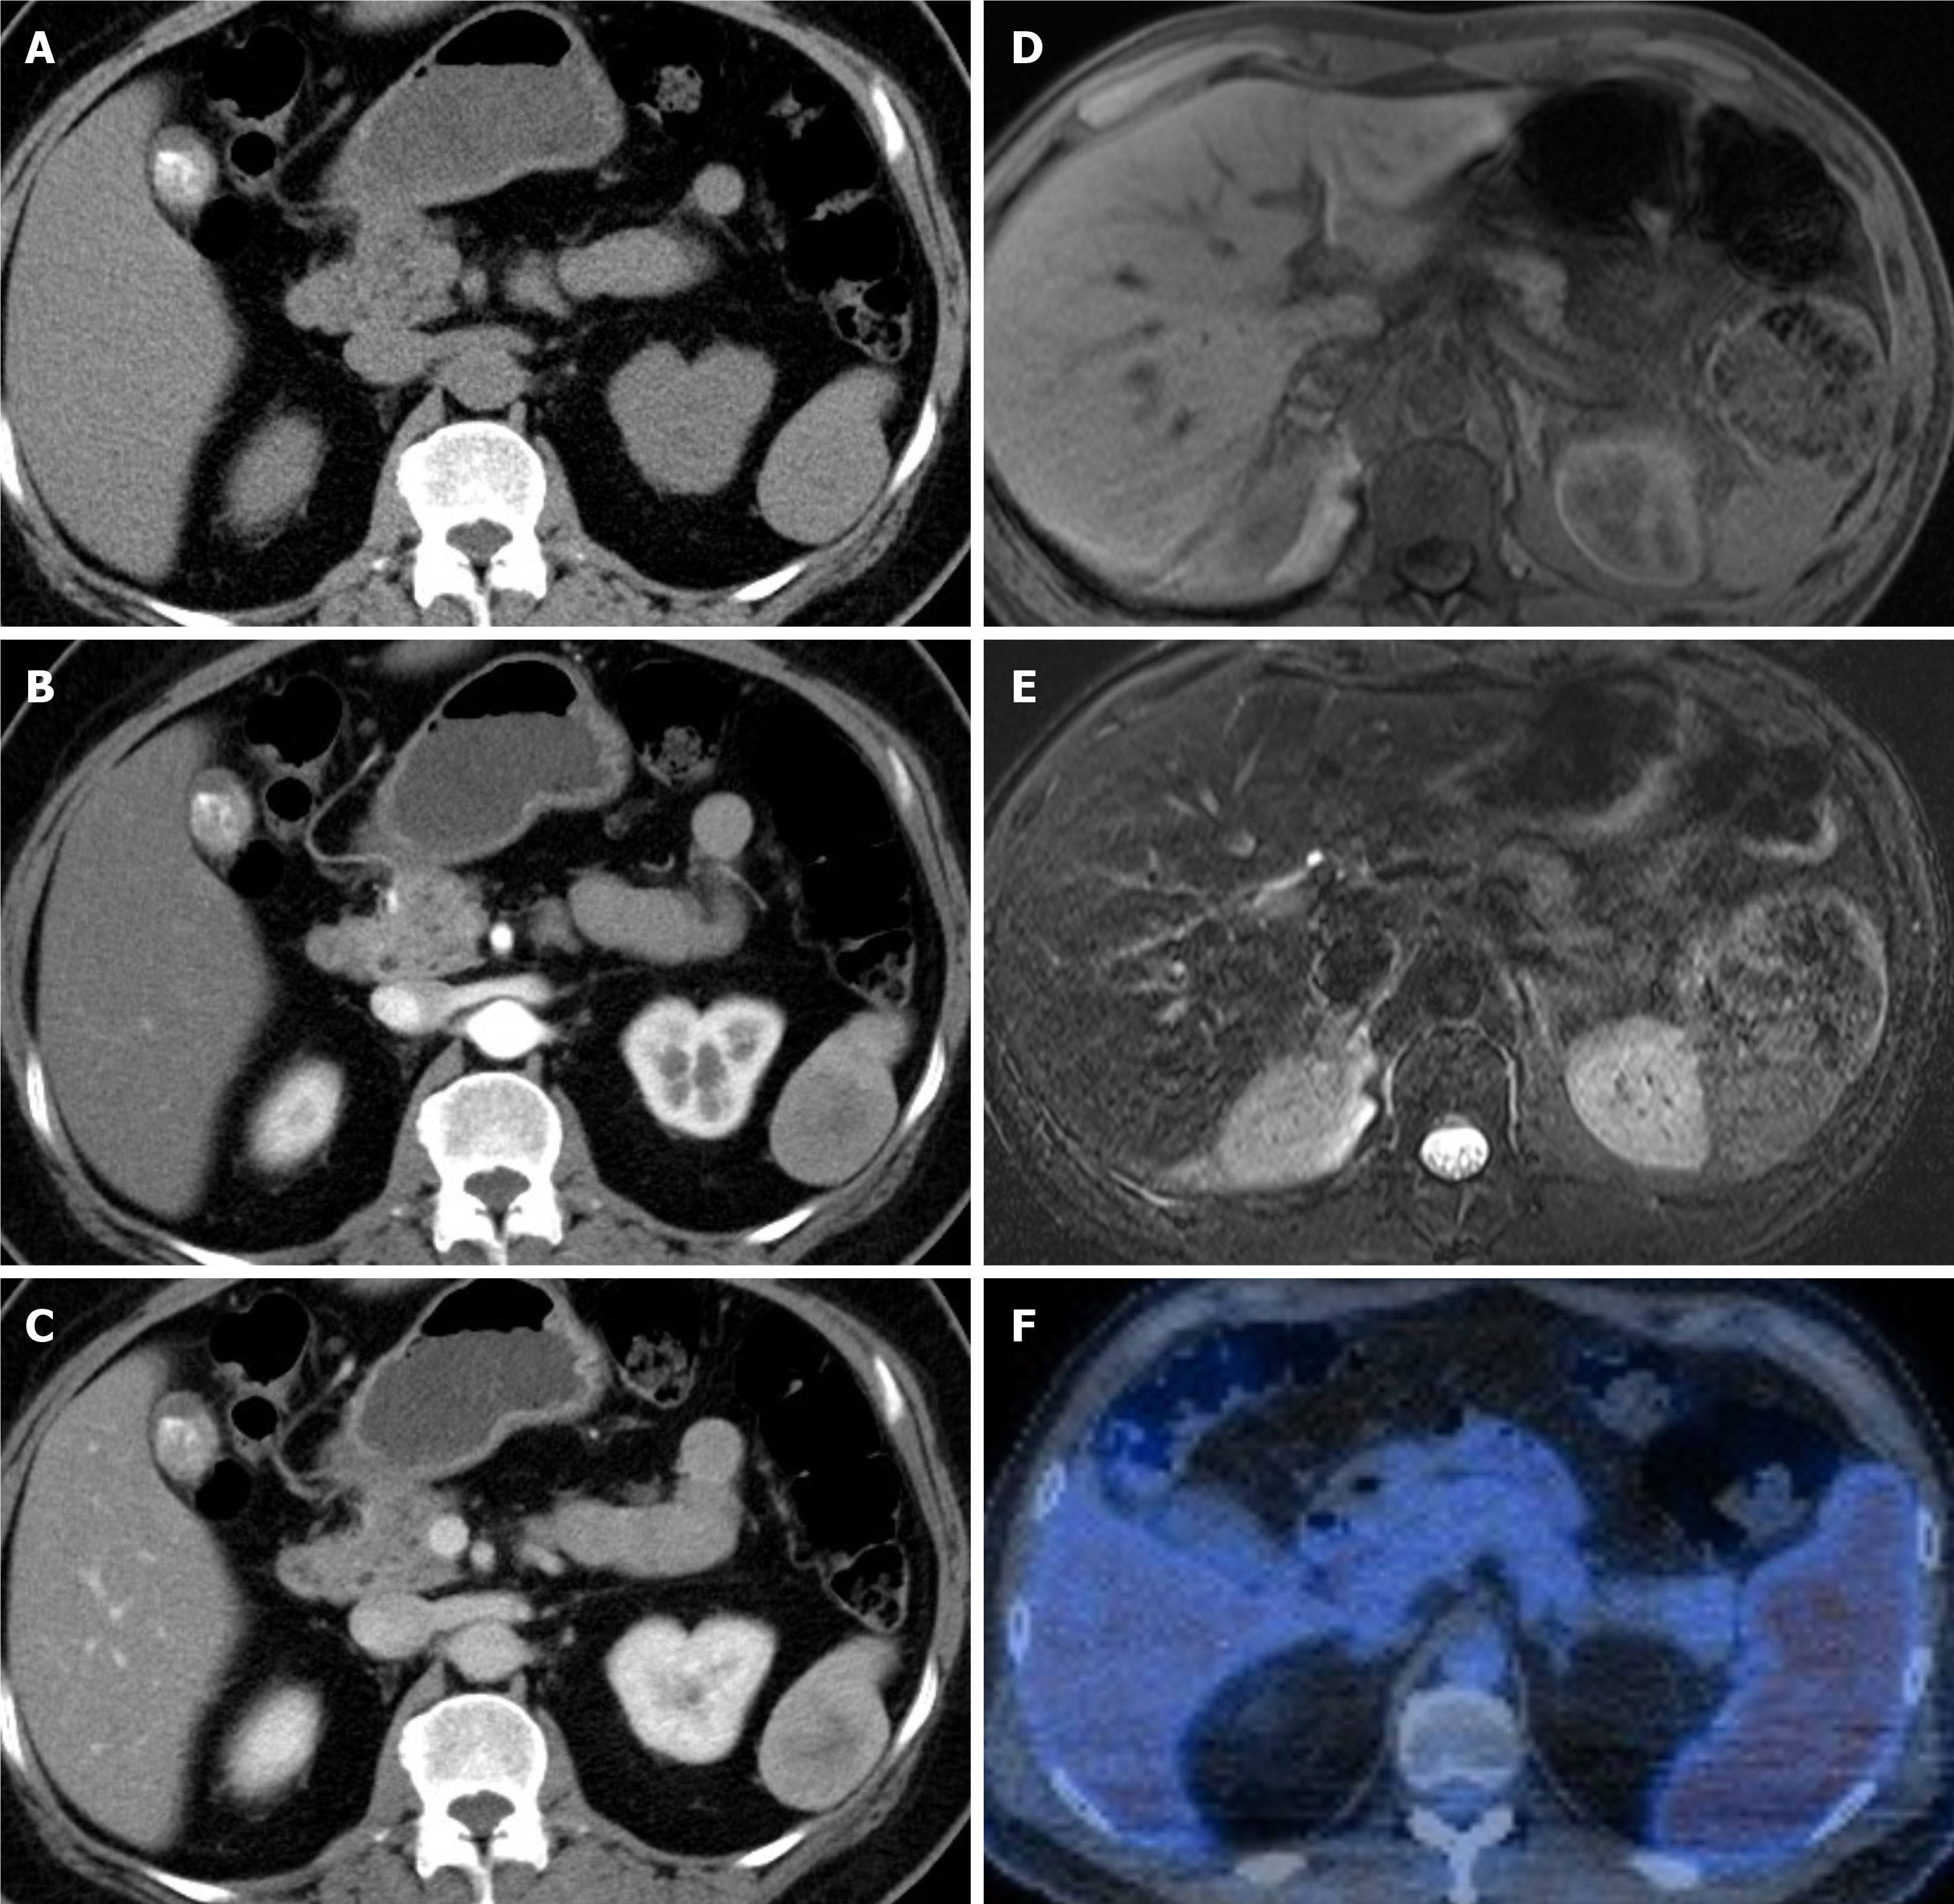
Figure 2 Typical image features of sclerosing angiomatoid nodular transformation.
A-C: Computed tomography (CT), non-contrast (A), arterial phase (B), venous phase (C) (Case 2); D and E: Magnetic resonance imaging (MRI), MRI T1 (D), MRI T2 (E) (Case 1); F: Positron emission tomography-CT (Case 3).
Figure 3 Non-sclerosing angiomatoid nodular transformation tumors compared with sclerosing angiomatoid nodular transformation base on magnetic resonance imaging T2 signals.
A: Sclerosing angiomatoid nodular transformation (hypointensity); B: Hemangioma (hyperintensity); C: Lymphoma (hypointensity); D: Metastasis, central necrosis (hyperintensity).
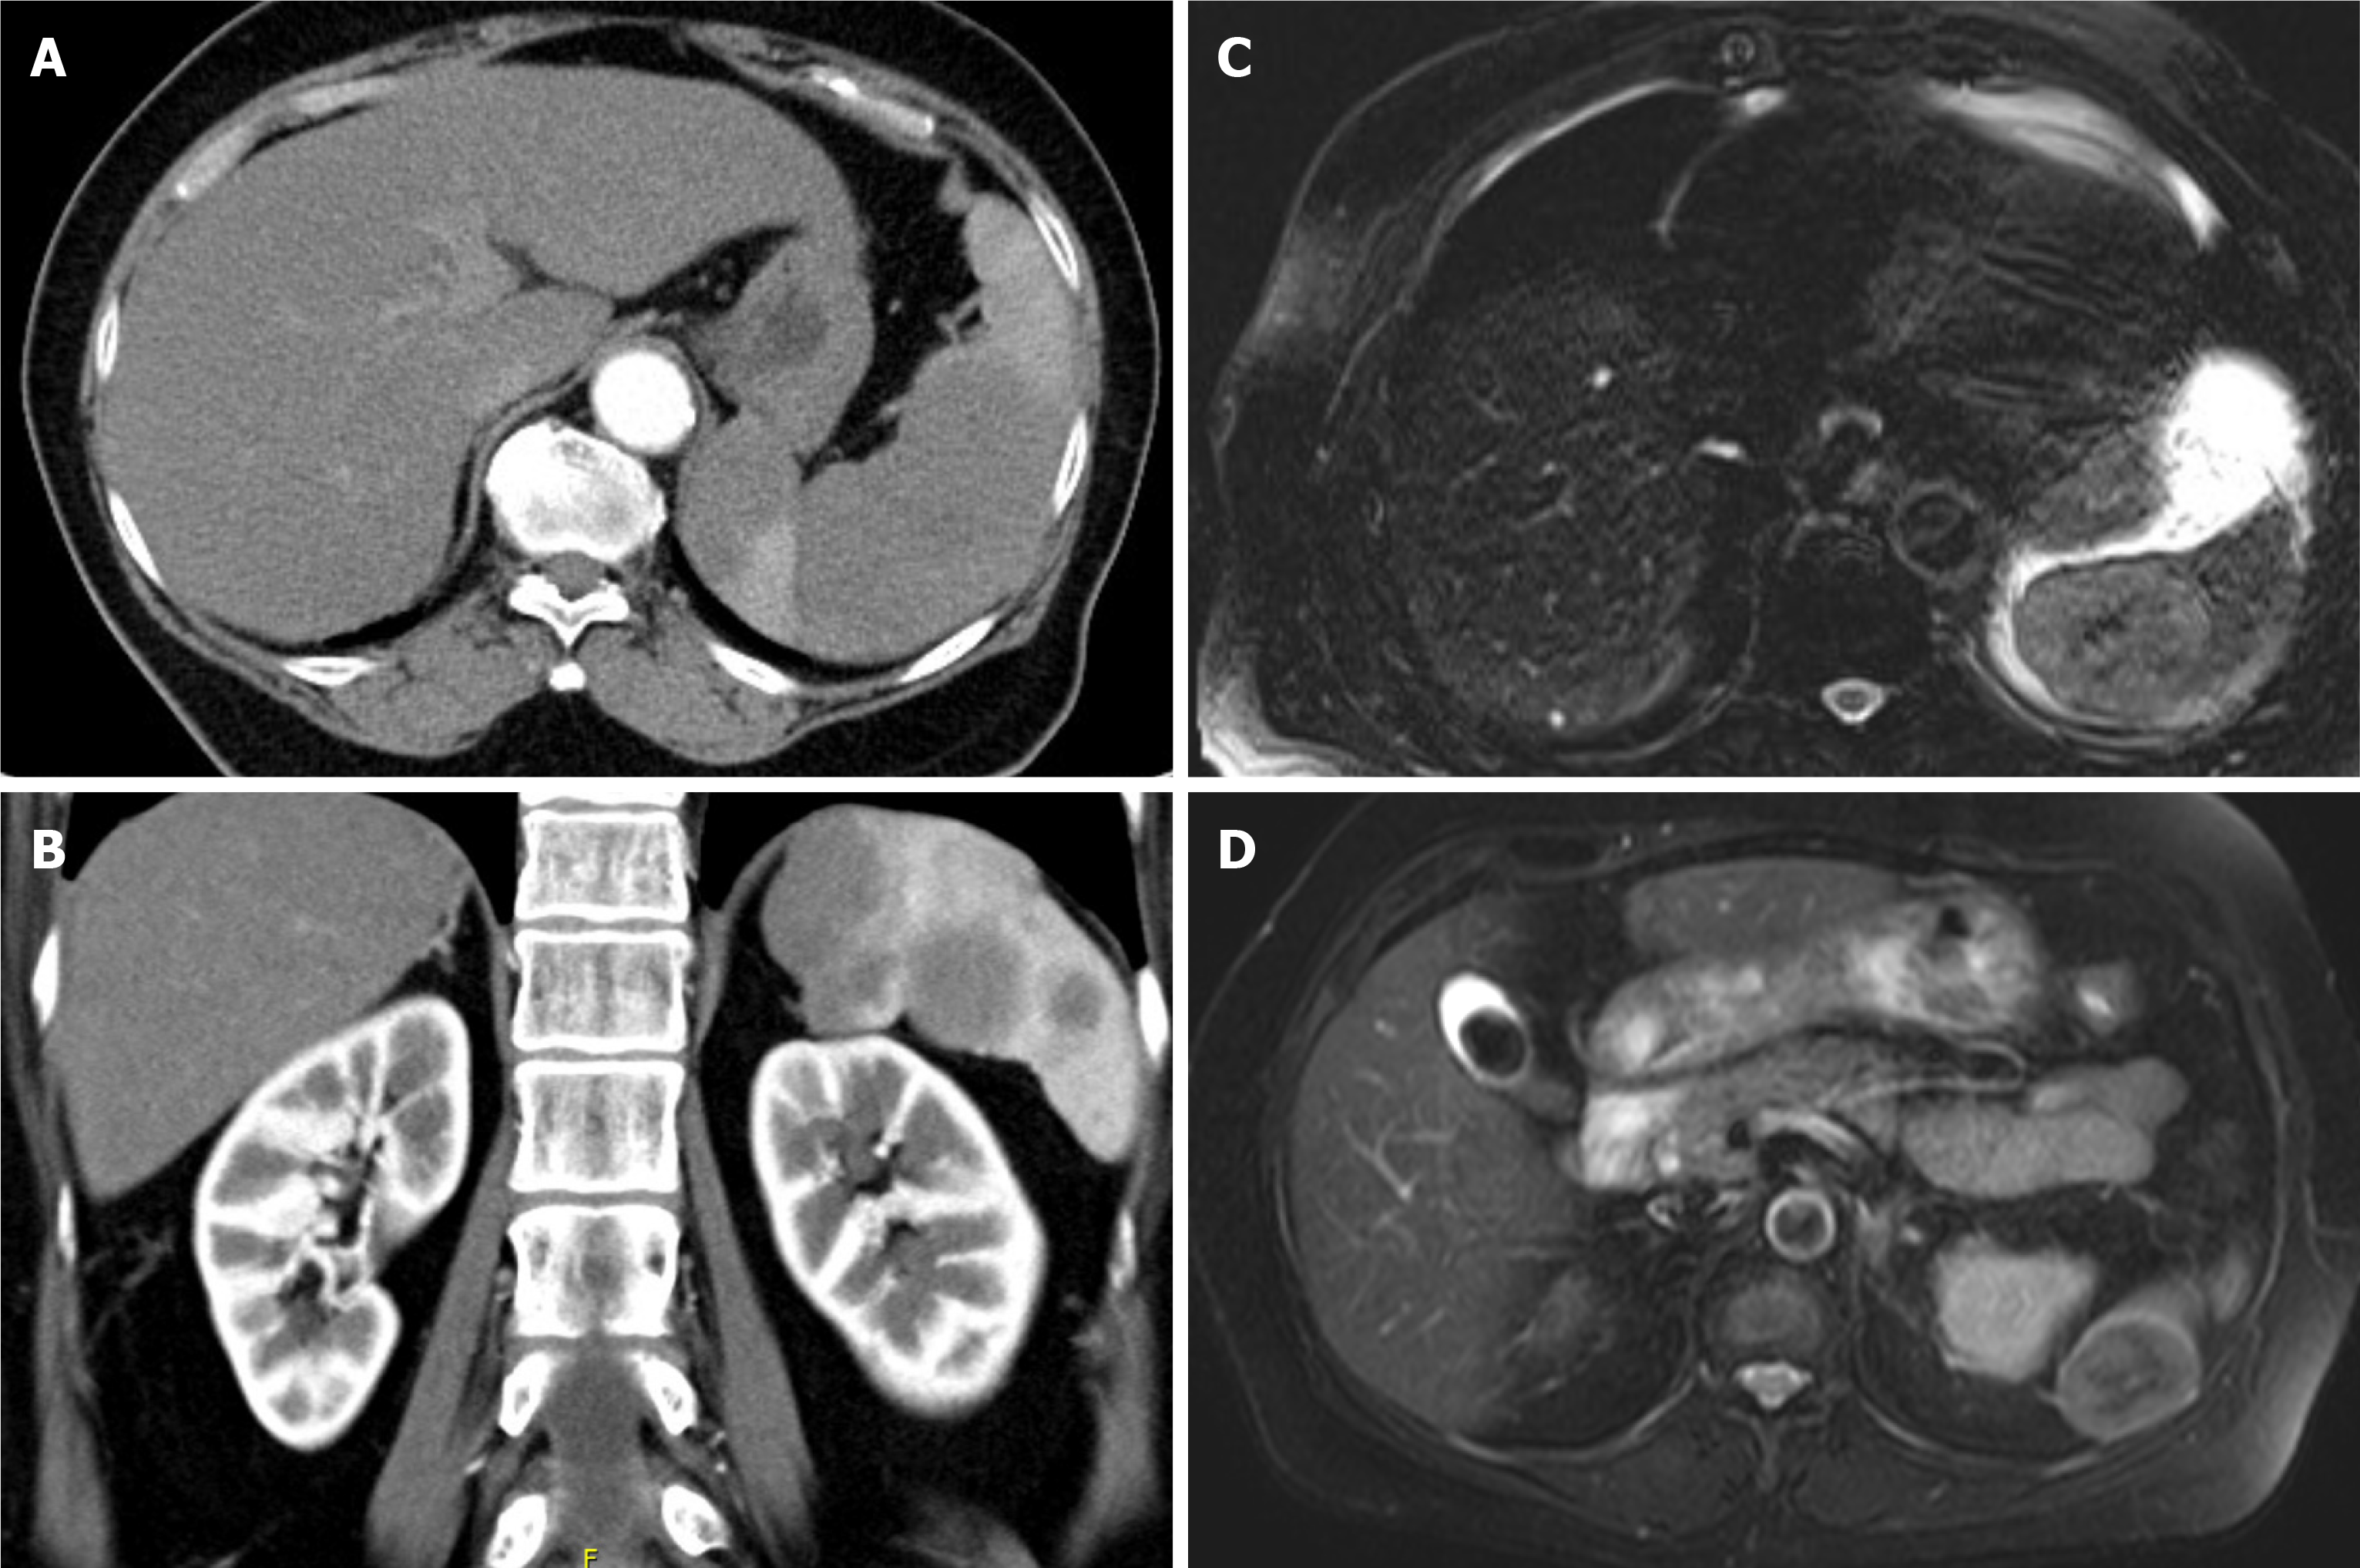
Figure 4 Image comparison between splenic lymphoma and sclerosing angiomatoid nodular transformation.
A: Computed tomography, homogenous splenomegaly; B: Computed tomography, multifocal lesion (splenic lymphoma); C: Magnetic resonance imaging T2, solitary mass with spoke wheel pattern (splenic lymphoma); D: Magnetic resonance imaging T2, solitary mass with spoke wheel pattern (sclerosing angiomatoid nodular transformation).
- Citation: Tseng H, Ho CM, Tien YW. Reappraisal of surgical decision-making in patients with splenic sclerosing angiomatoid nodular transformation: Case series and literature review. World J Gastrointest Surg 2021; 13(8): 848-858
- URL: https://www.wjgnet.com/1948-9366/full/v13/i8/848.htm
- DOI: https://dx.doi.org/10.4240/wjgs.v13.i8.848


