Copyright
©The Author(s) 2021.
World J Gastrointest Surg. Feb 27, 2021; 13(2): 153-163
Published online Feb 27, 2021. doi: 10.4240/wjgs.v13.i2.153
Published online Feb 27, 2021. doi: 10.4240/wjgs.v13.i2.153
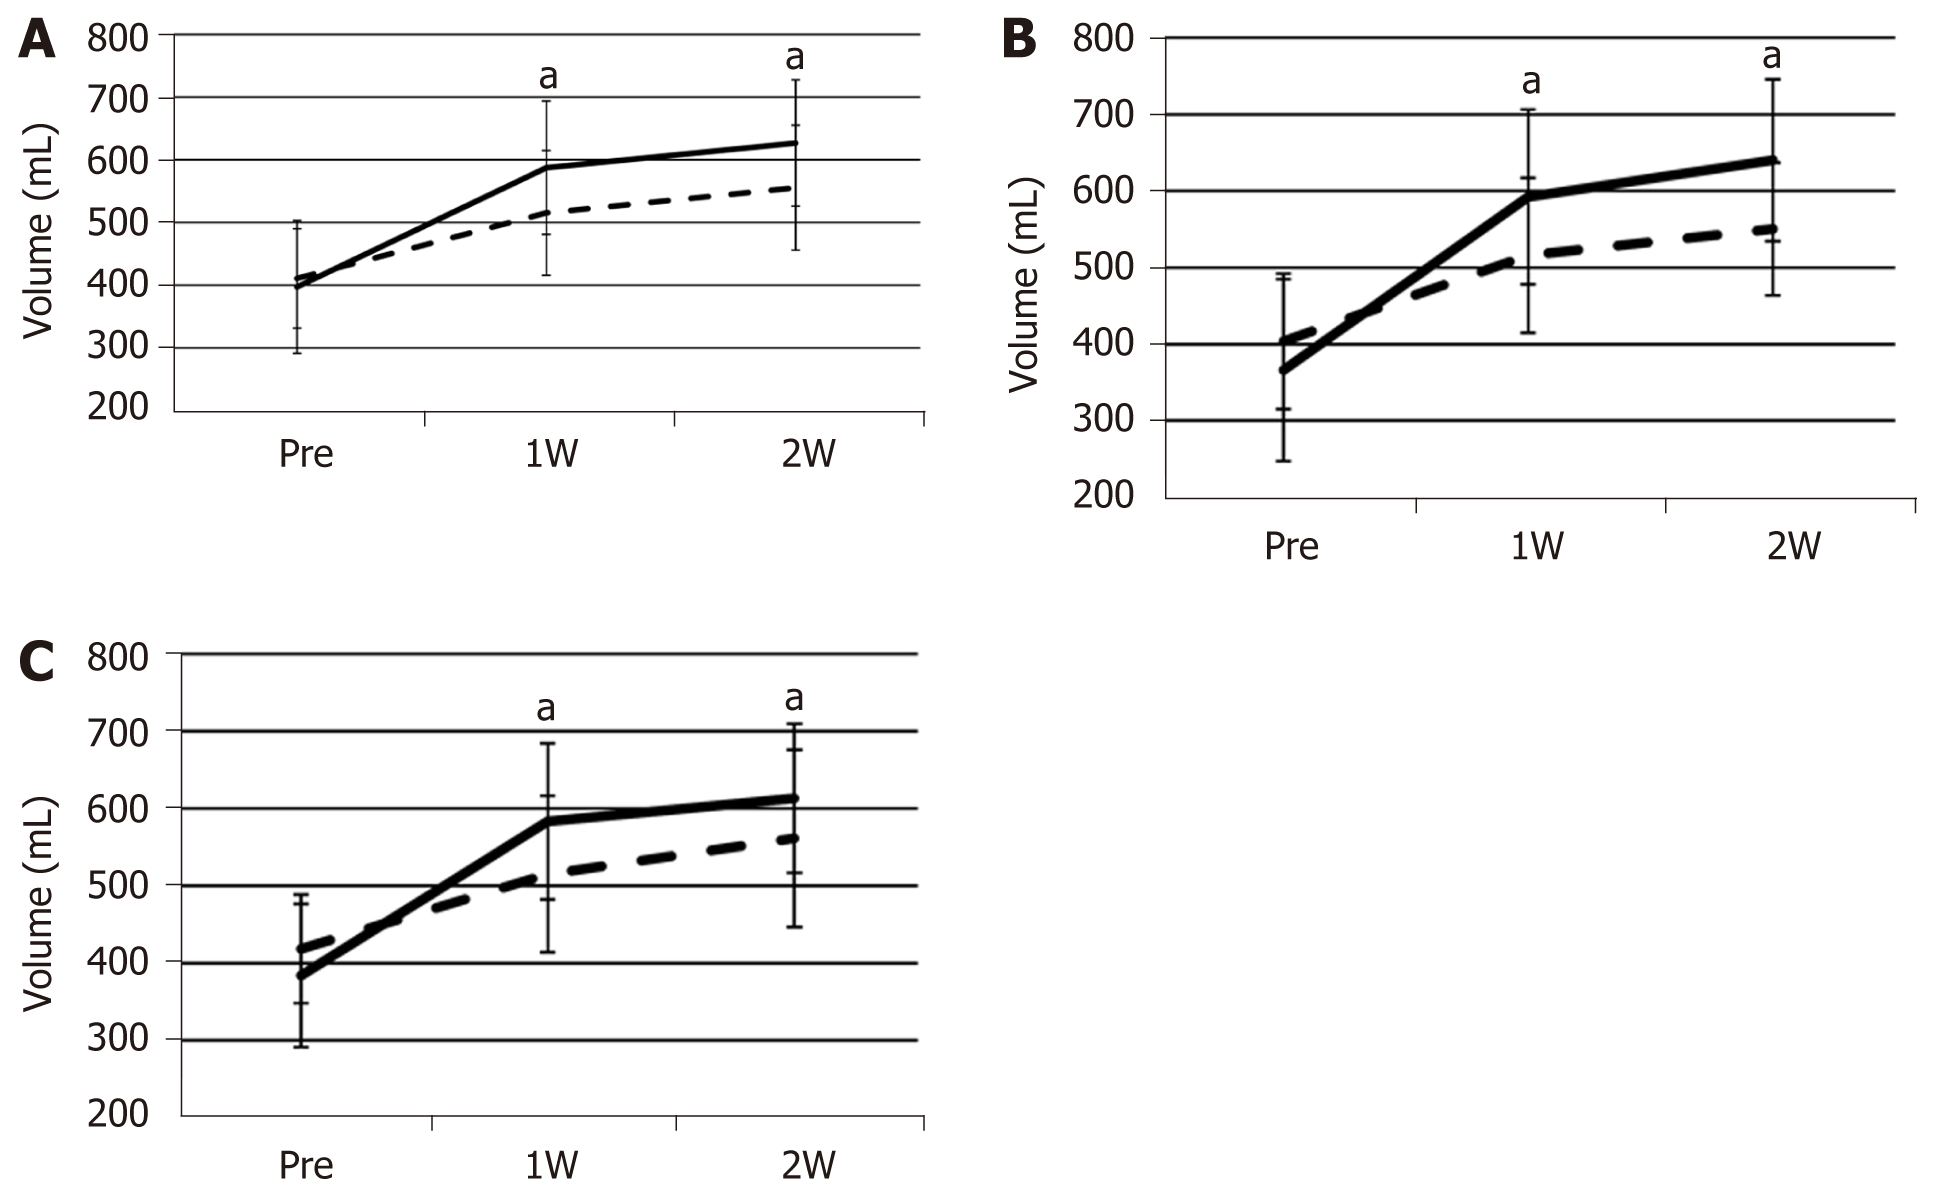
Figure 1 Change in the volume of the future liver remnant after portal vein embolization.
A: Change in the volume of the future liver remnant (FLR) after portal vein embolization in the whole case. FLR volume (FLRV) (dashed line) and functional FLRV (solid line); B: Change in the volume of the FLR after portal vein embolization in the group with preoperative biliary drainage; C: Change in the volume of the FLR after portal vein embolization in the group without preoperative biliary drainage. aP < 0.01. W: Week.
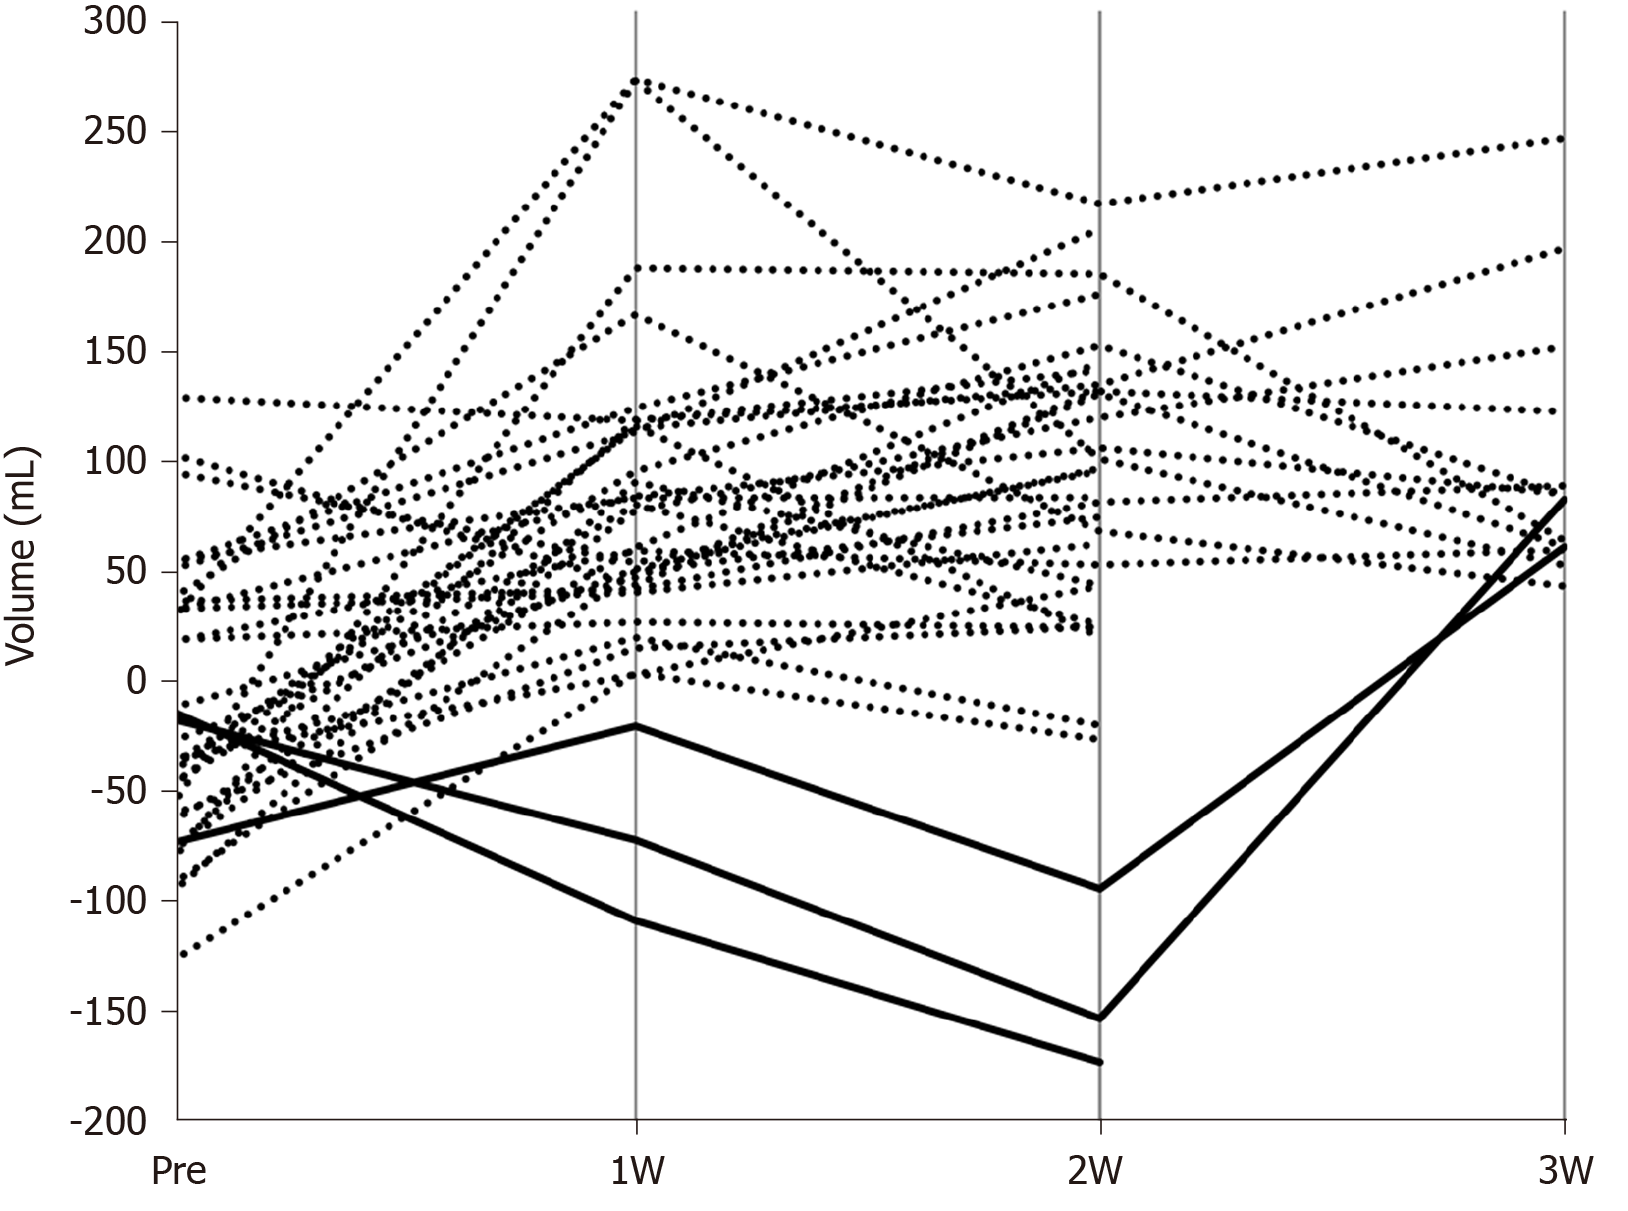
Figure 2 Change in the difference between the future liver remnant volume and the functional future liver remnant volume after portal vein embolization.
In three patients (solid lines), the functional future liver remnant volume became lower than the future liver remnant volume at 2 wk after portal vein embolization. W: Week.
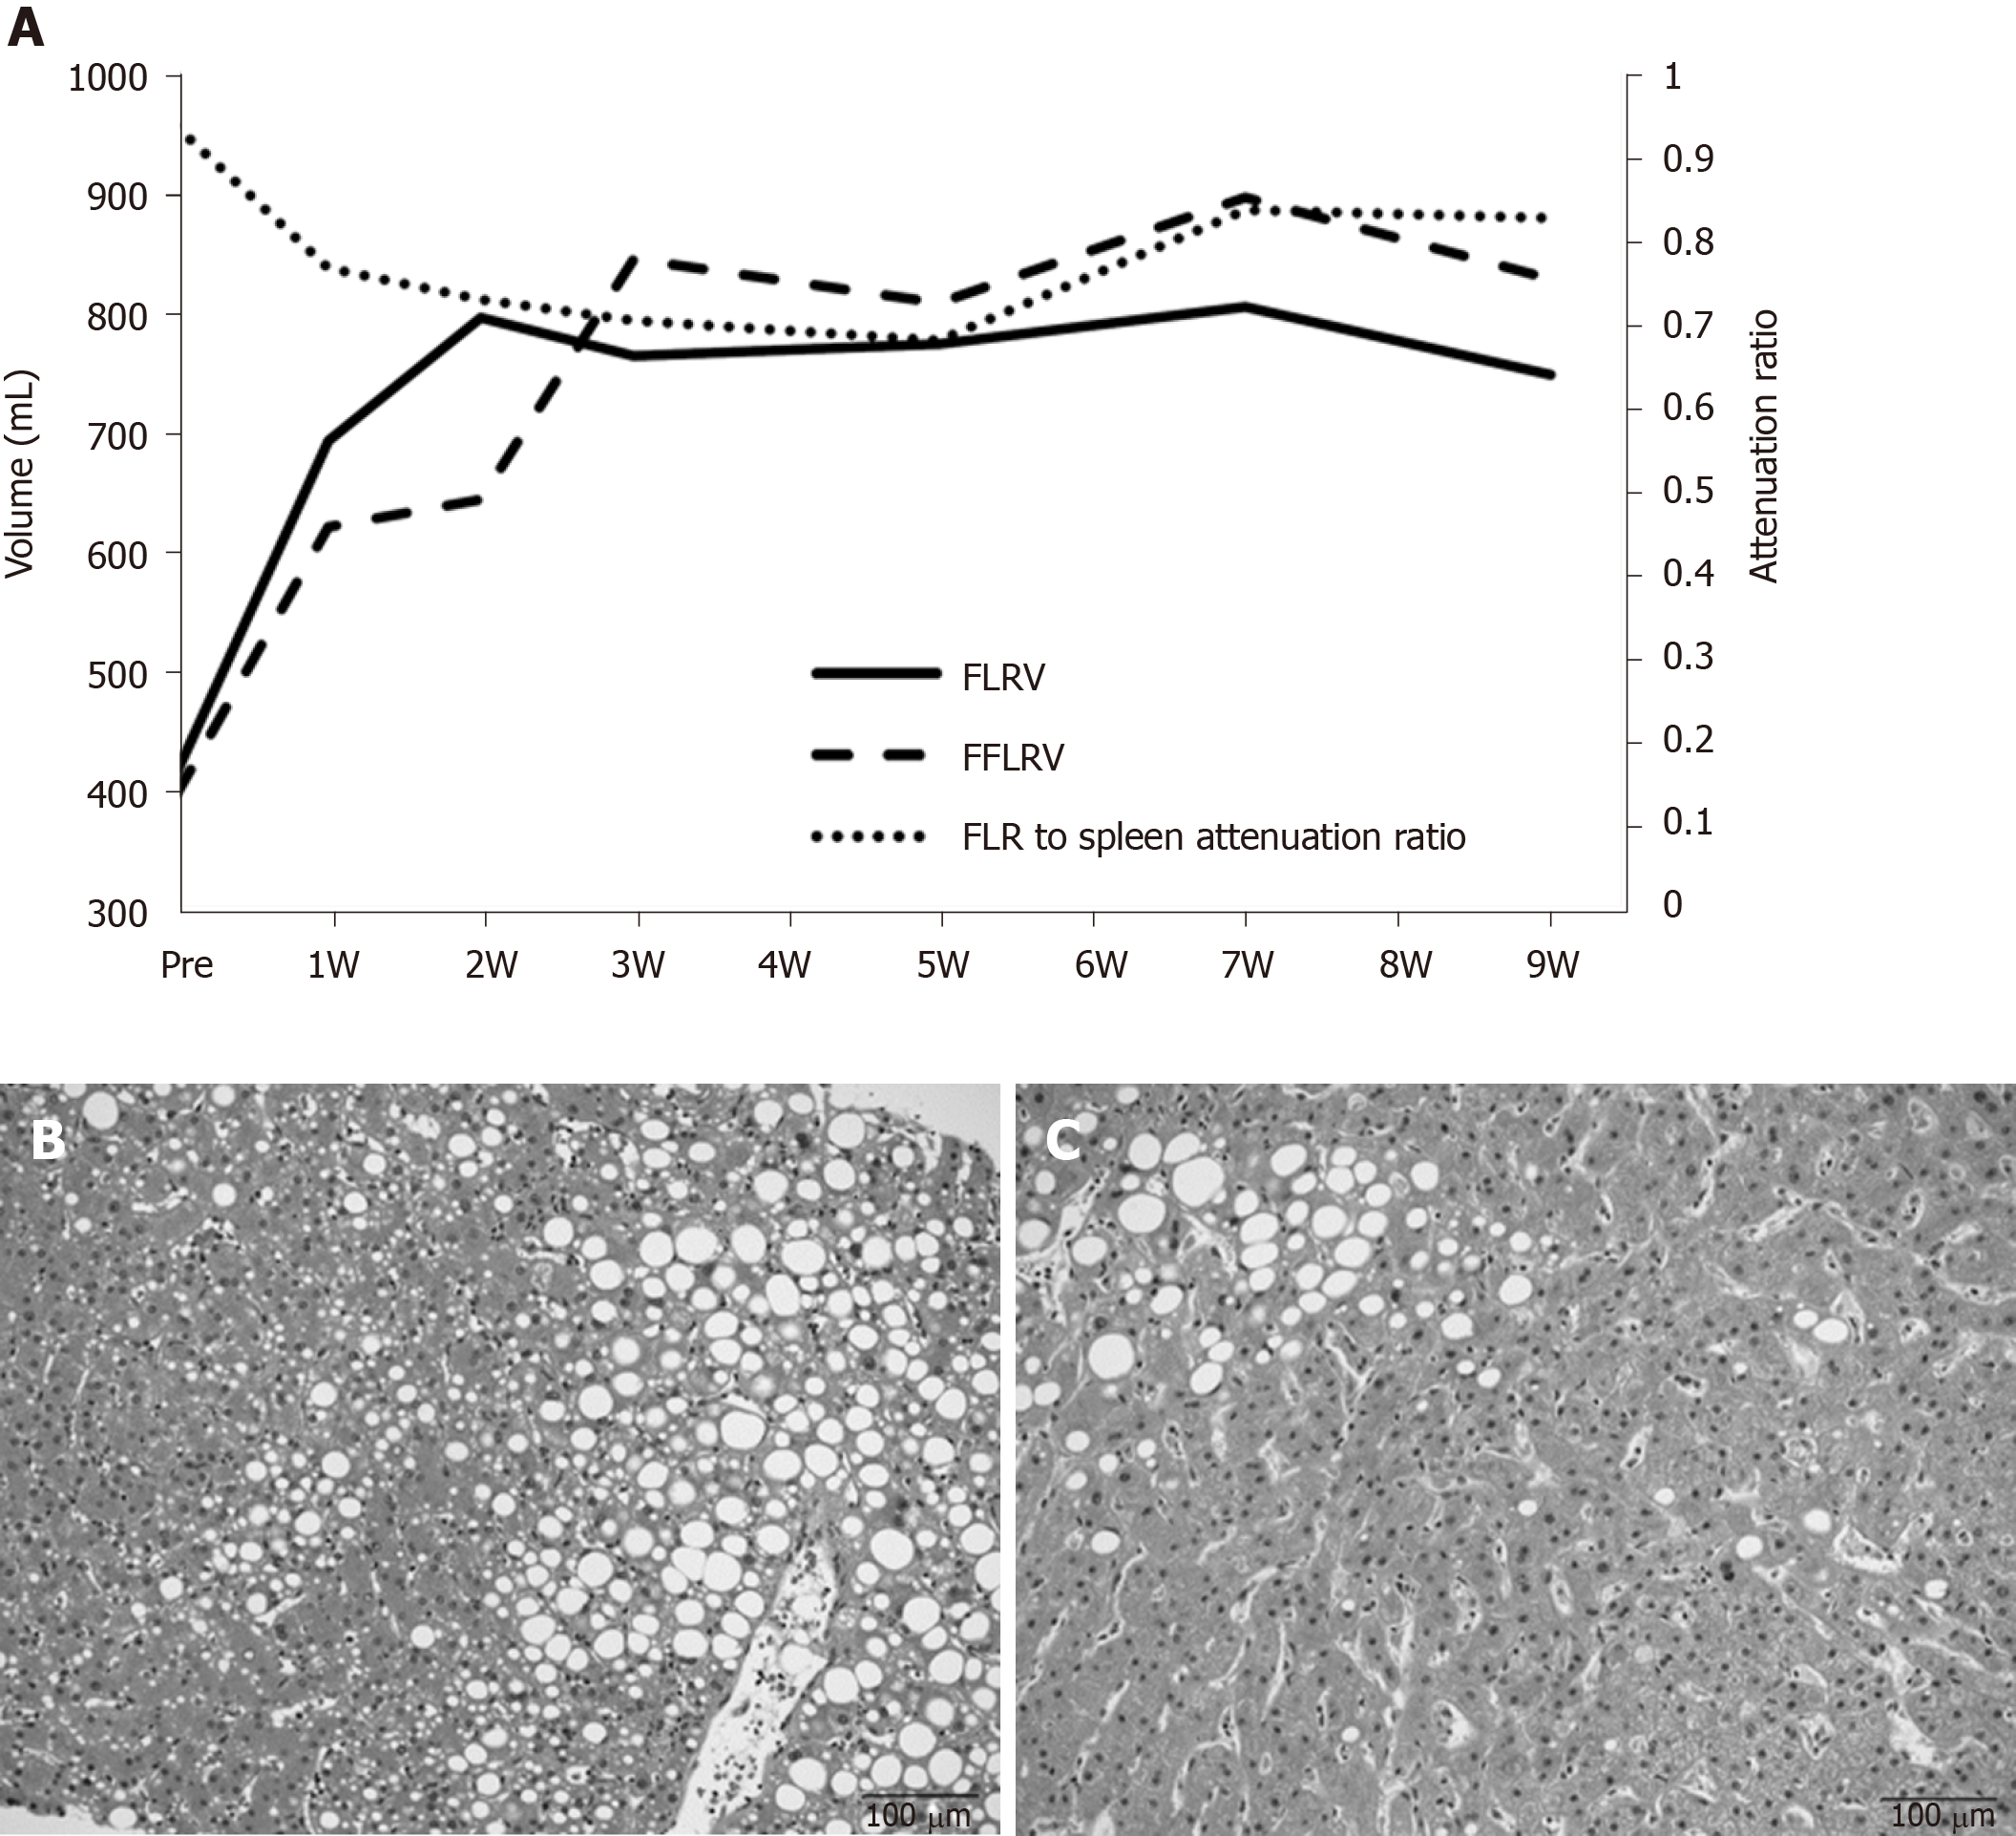
Figure 3 Change in the difference between the future liver remnant volume and the functional future liver remnant volume after portal vein embolization and biopsy findings in patient 1.
A: Change in future liver remnant volume (FLRV), functional FLRV (FFLRV), and future liver remnant (FLR) to spleen computed tomography (CT) attenuation ratio in patient 1. The FFLRV level remained below that of the FLRV at 2 wk after portal vein embolization (PVE). The decrease in the FLR to spleen CT attenuation ratio represents fatty changes in FLR at 5 wk after PVE; B: Biopsy findings in the FLR at 4 wk after PVE. The macro and micro-vesicular steatosis was more than 40%; C: At 13 wk after PVE, the steatosis had improved to approximately 10%. W: Week.
- Citation: Tsuruga Y, Kamiyama T, Kamachi H, Orimo T, Shimada S, Nagatsu A, Asahi Y, Sakamoto Y, Kakisaka T, Taketomi A. Functional transition: Inconsistently parallel to the increase in future liver remnant volume after preoperative portal vein embolization. World J Gastrointest Surg 2021; 13(2): 153-163
- URL: https://www.wjgnet.com/1948-9366/full/v13/i2/153.htm
- DOI: https://dx.doi.org/10.4240/wjgs.v13.i2.153


