Copyright
©The Author(s) 2021.
World J Gastrointest Surg. Feb 27, 2021; 13(2): 127-140
Published online Feb 27, 2021. doi: 10.4240/wjgs.v13.i2.127
Published online Feb 27, 2021. doi: 10.4240/wjgs.v13.i2.127
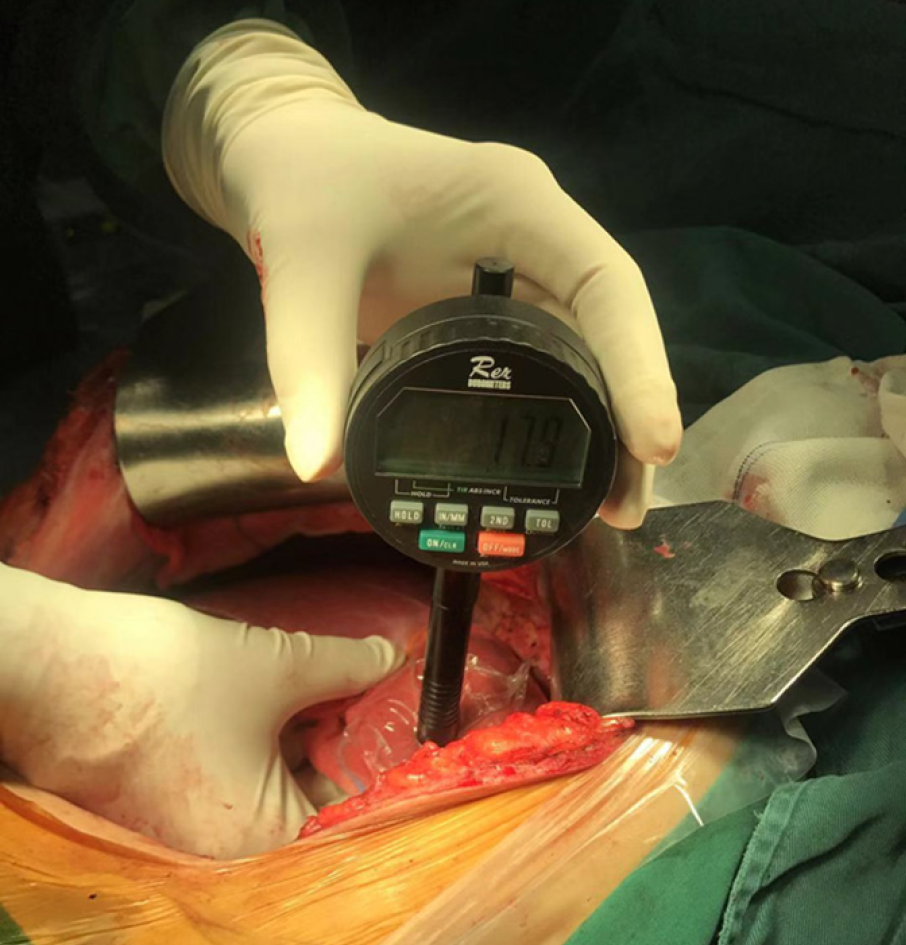
Figure 1 Measurement of liver hardness using a durometer.
Durometer placed perpendicular to the liver surface, avoiding underlying tumors or large vessels.
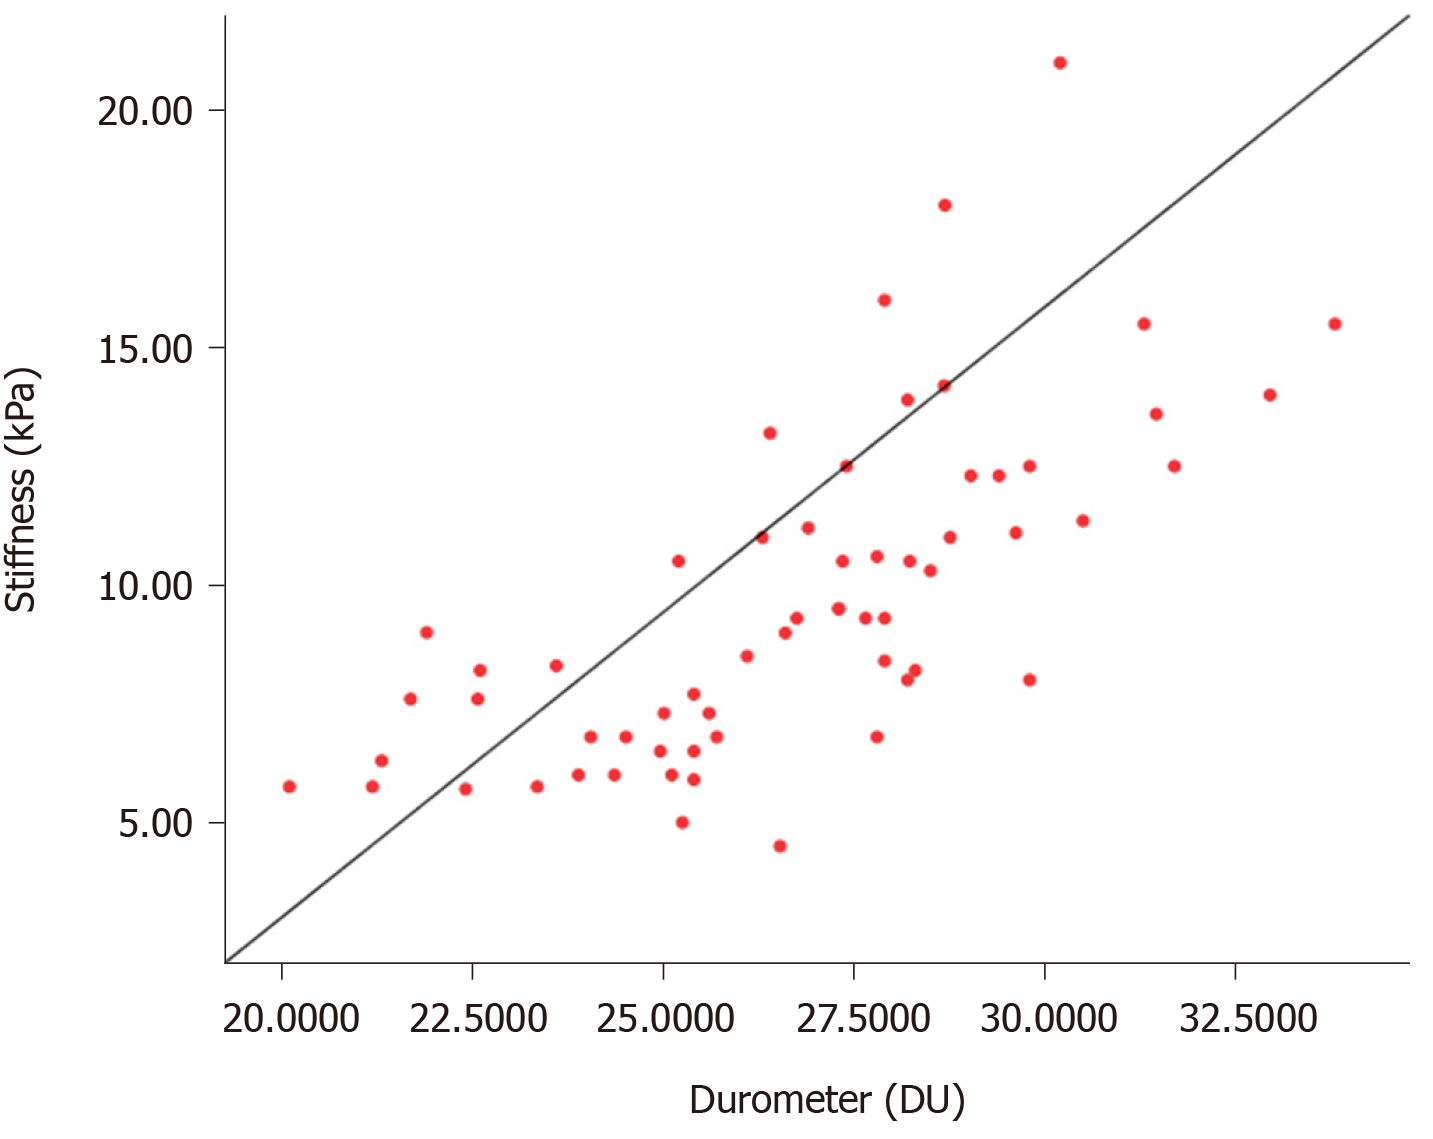
Figure 2 Correlation between liver stiffness and durometer scale.
Pearson rank correlation coefficient R2 values for stiffness-to-durometer is 0.491, P < 0.001.
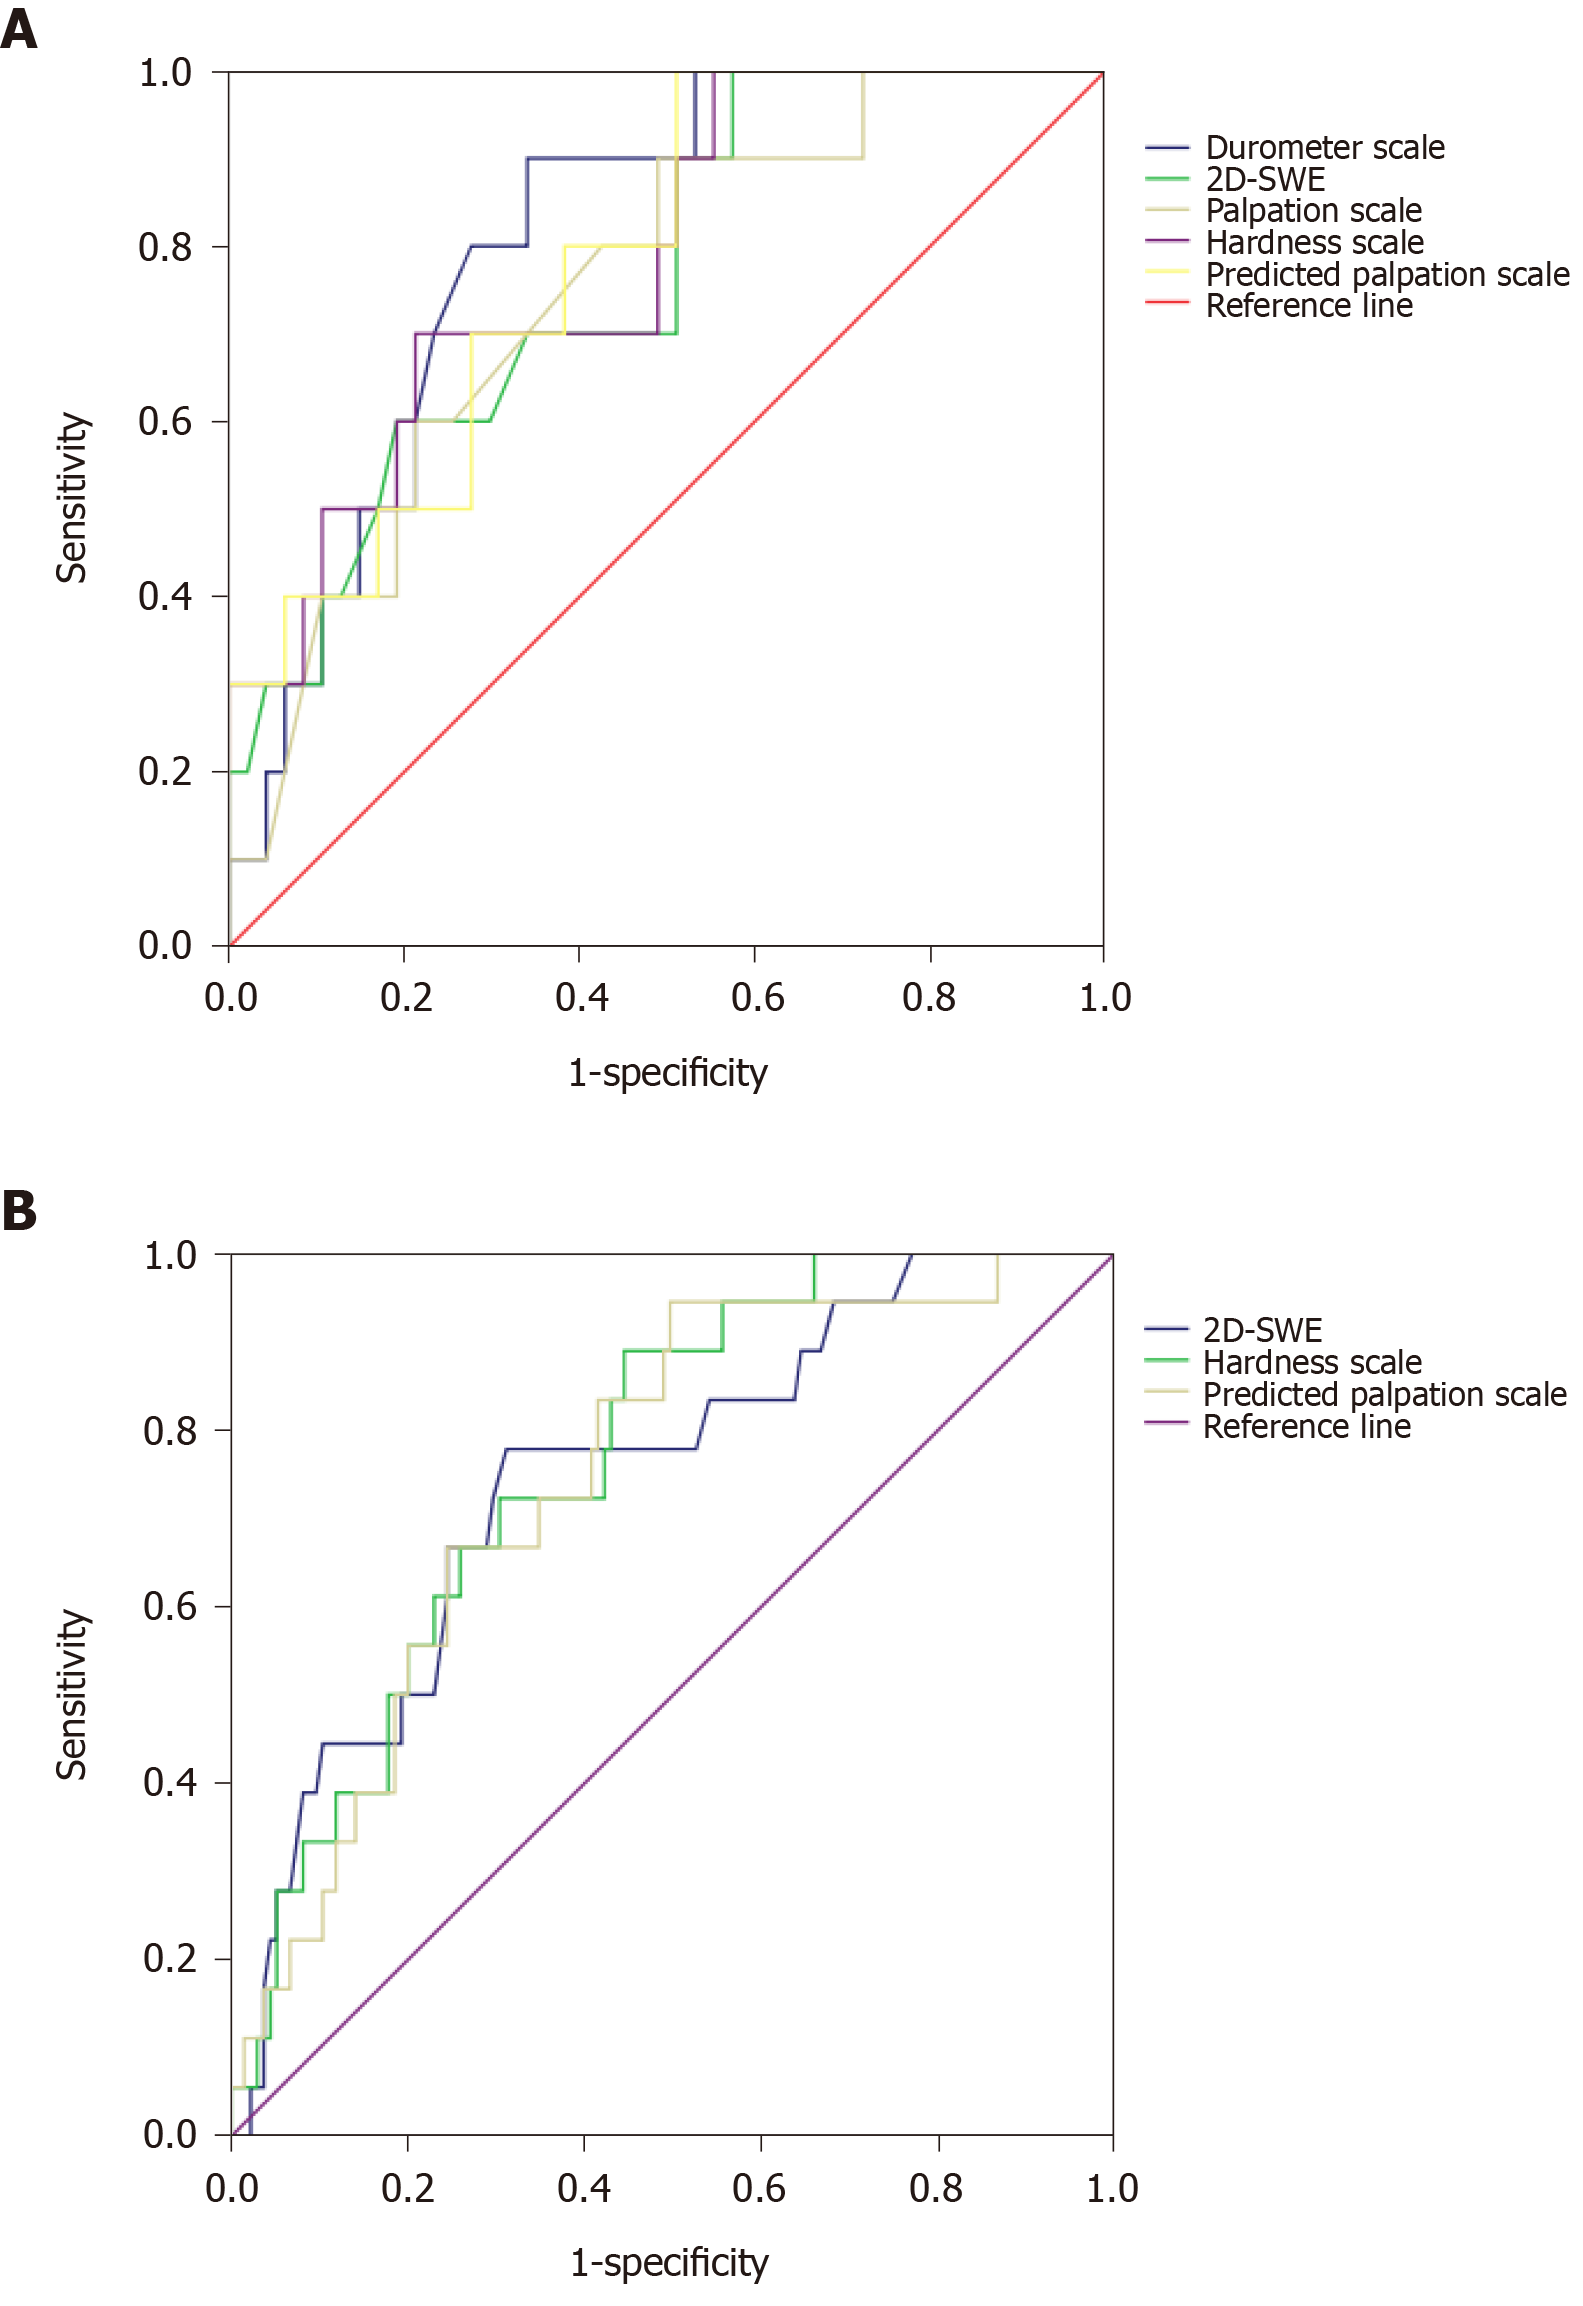
Figure 3 Receiver operating characteristic curve for post-hepatectomy liver failure.
A: Derivation cohort (n = 74); B: Validation cohort (n = 162). The area under receiver operating characteristic curve of hardness scale in A and B are 0.785, P = 0.005, and 0.765, P < 0.001, respectively. 2D-SWE: Two-dimensional shear wave elastography.
- Citation: Ju BJ, Jin M, Tian Y, Zhen X, Kong DX, Wang WL, Yan S. Model for liver hardness using two-dimensional shear wave elastography, durometer, and preoperative biomarkers. World J Gastrointest Surg 2021; 13(2): 127-140
- URL: https://www.wjgnet.com/1948-9366/full/v13/i2/127.htm
- DOI: https://dx.doi.org/10.4240/wjgs.v13.i2.127


