Copyright
©The Author(s) 2021.
World J Gastrointest Surg. Nov 27, 2021; 13(11): 1448-1462
Published online Nov 27, 2021. doi: 10.4240/wjgs.v13.i11.1448
Published online Nov 27, 2021. doi: 10.4240/wjgs.v13.i11.1448
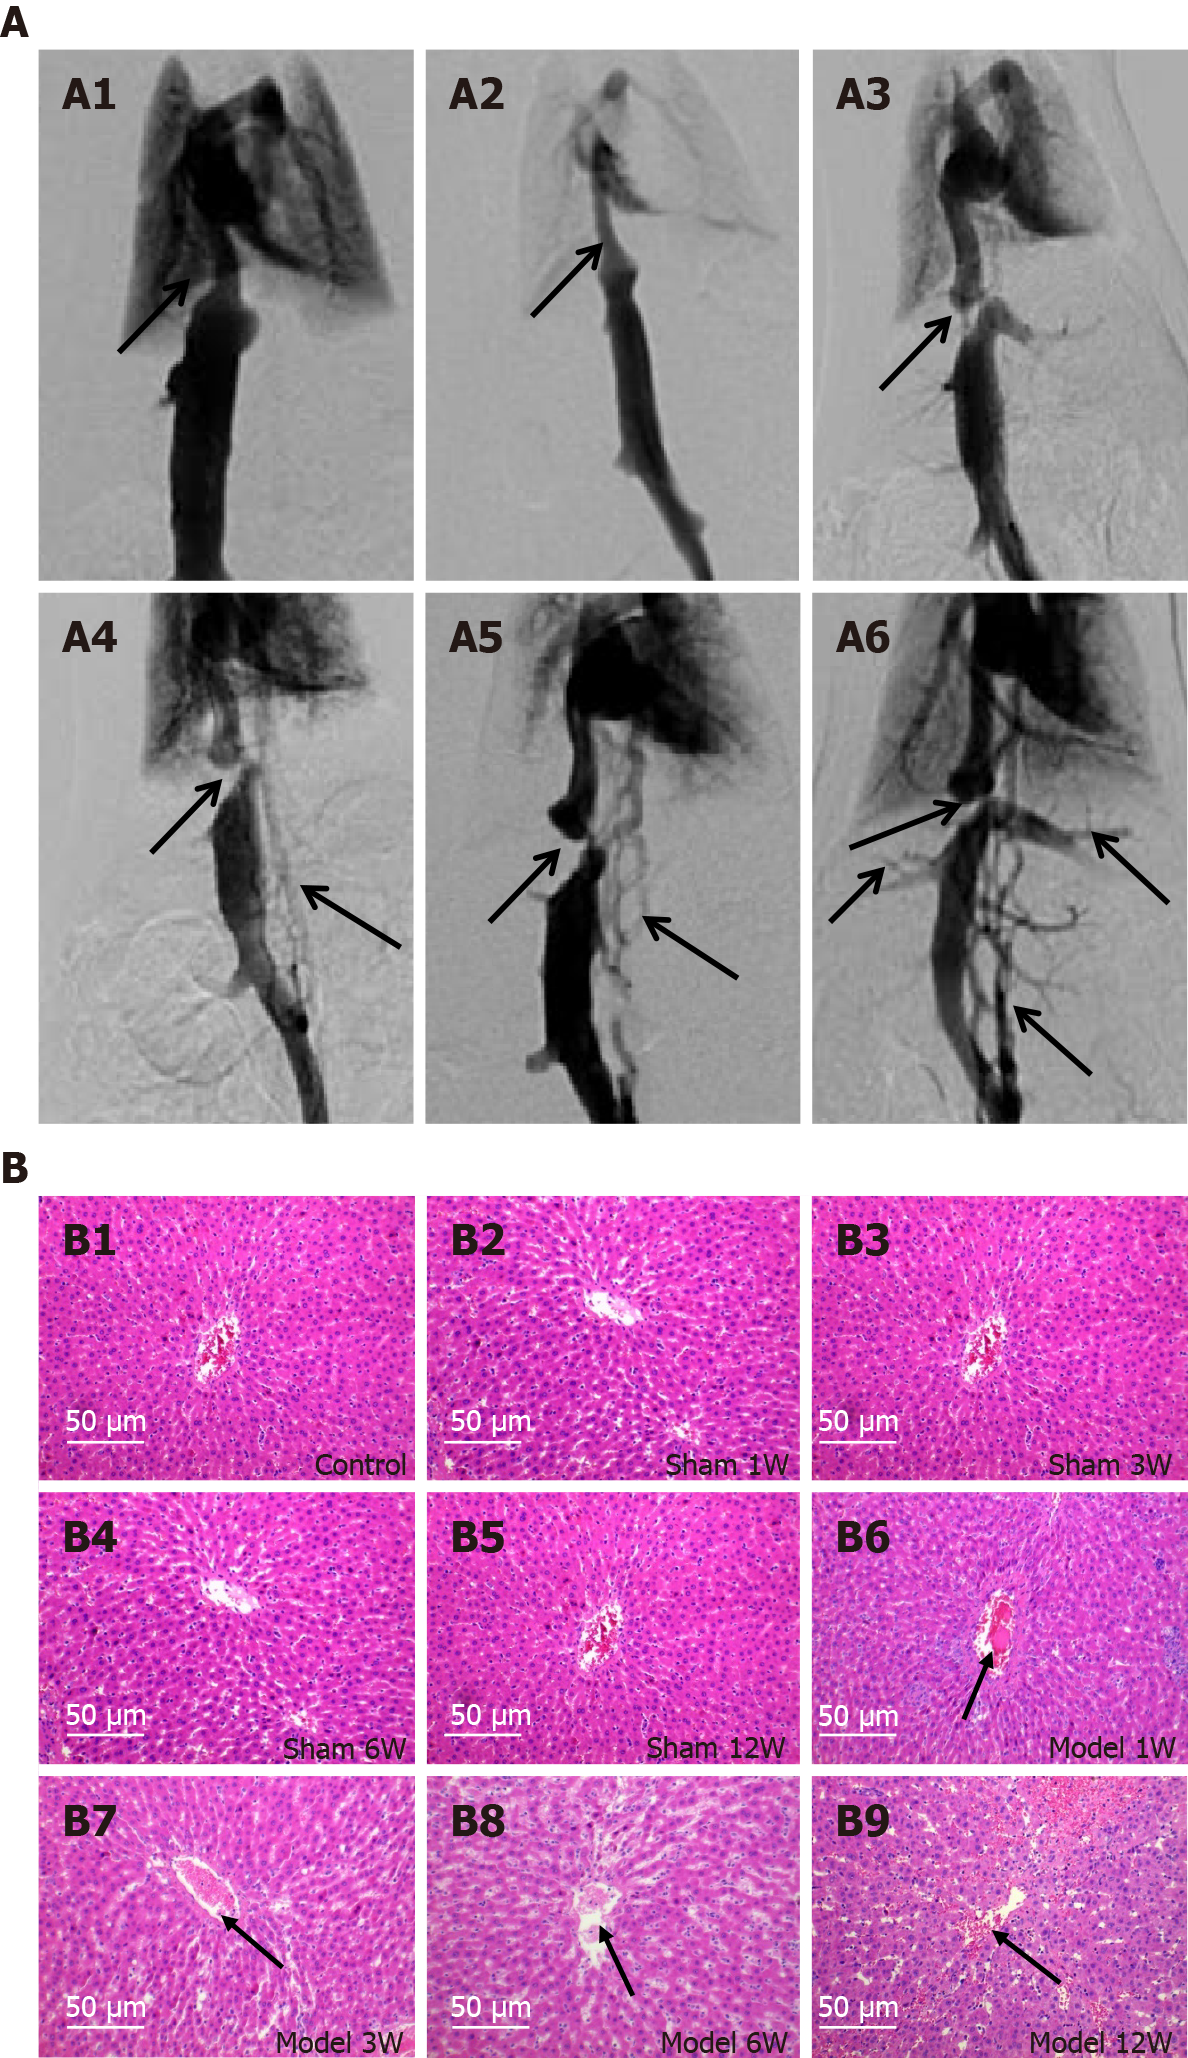
Figure 1 Digital subtraction angiography images and hematoxylin-eosin staining images in the rat model of Budd-Chiari syndrome.
A: A1: Control group; A2: The sham operation group. Two groups showed that the inferior vena cava (IVC) blood flow was smooth, but no stenosis or occlusion of the IVC and hepatic vein (HV) (black arrow); A3: In the 1 model group 1W, IVC stenosis above the opening of the HV could be seen, and the contrast agent passed through in a line, without obvious collateral vessel formation (black arrow); A4: In the model group 3W, a small amount of collateral vessel formation around the IVC (black arrow); A5: In the model group 6W, a large number of collateral vessels around the IVC (black arrow); A6: In the model group 12W, the collateral vessels around the IVC were further increased and thickened (black arrow); B: B1: Control group; B2-B5: Four groups of sham operation group, 1W (B2), 3W (B3), 6W (B4) and 12W (B5). Hepatocytes were arranged in a single row radially centered on the central vein, with no change in hepatocytes and hepatic sinusoids (B1–B5); B6: Model group 1W. Hyaline degeneration of rat hepatocytes and no obvious dilation and stagnation of red blood cells in hepatic sinusoids (black arrow); B7: Model group 3W. The hyaline degeneration of rat hepatocytes was aggravated, the hepatocytes around the central vein were necrotic, and the hepatic sinusoids were dilated with a small amount of stasis red blood cells (black arrow); B8: Model group 6W. Large sheet necrosis of liver cells around the central vein, further expansion of liver sinusoids, more stasis of red blood cells in the expanded liver sinusoids (black arrow); B9: Model group 12W. The arrangement of liver cells was disordered, the normal hepatocyte cord disappeared, the hepatic sinusoids were significantly expanded and there was a large number of erythrocytes (black arrow). Original magnification × 200. Bar = 50 μm.
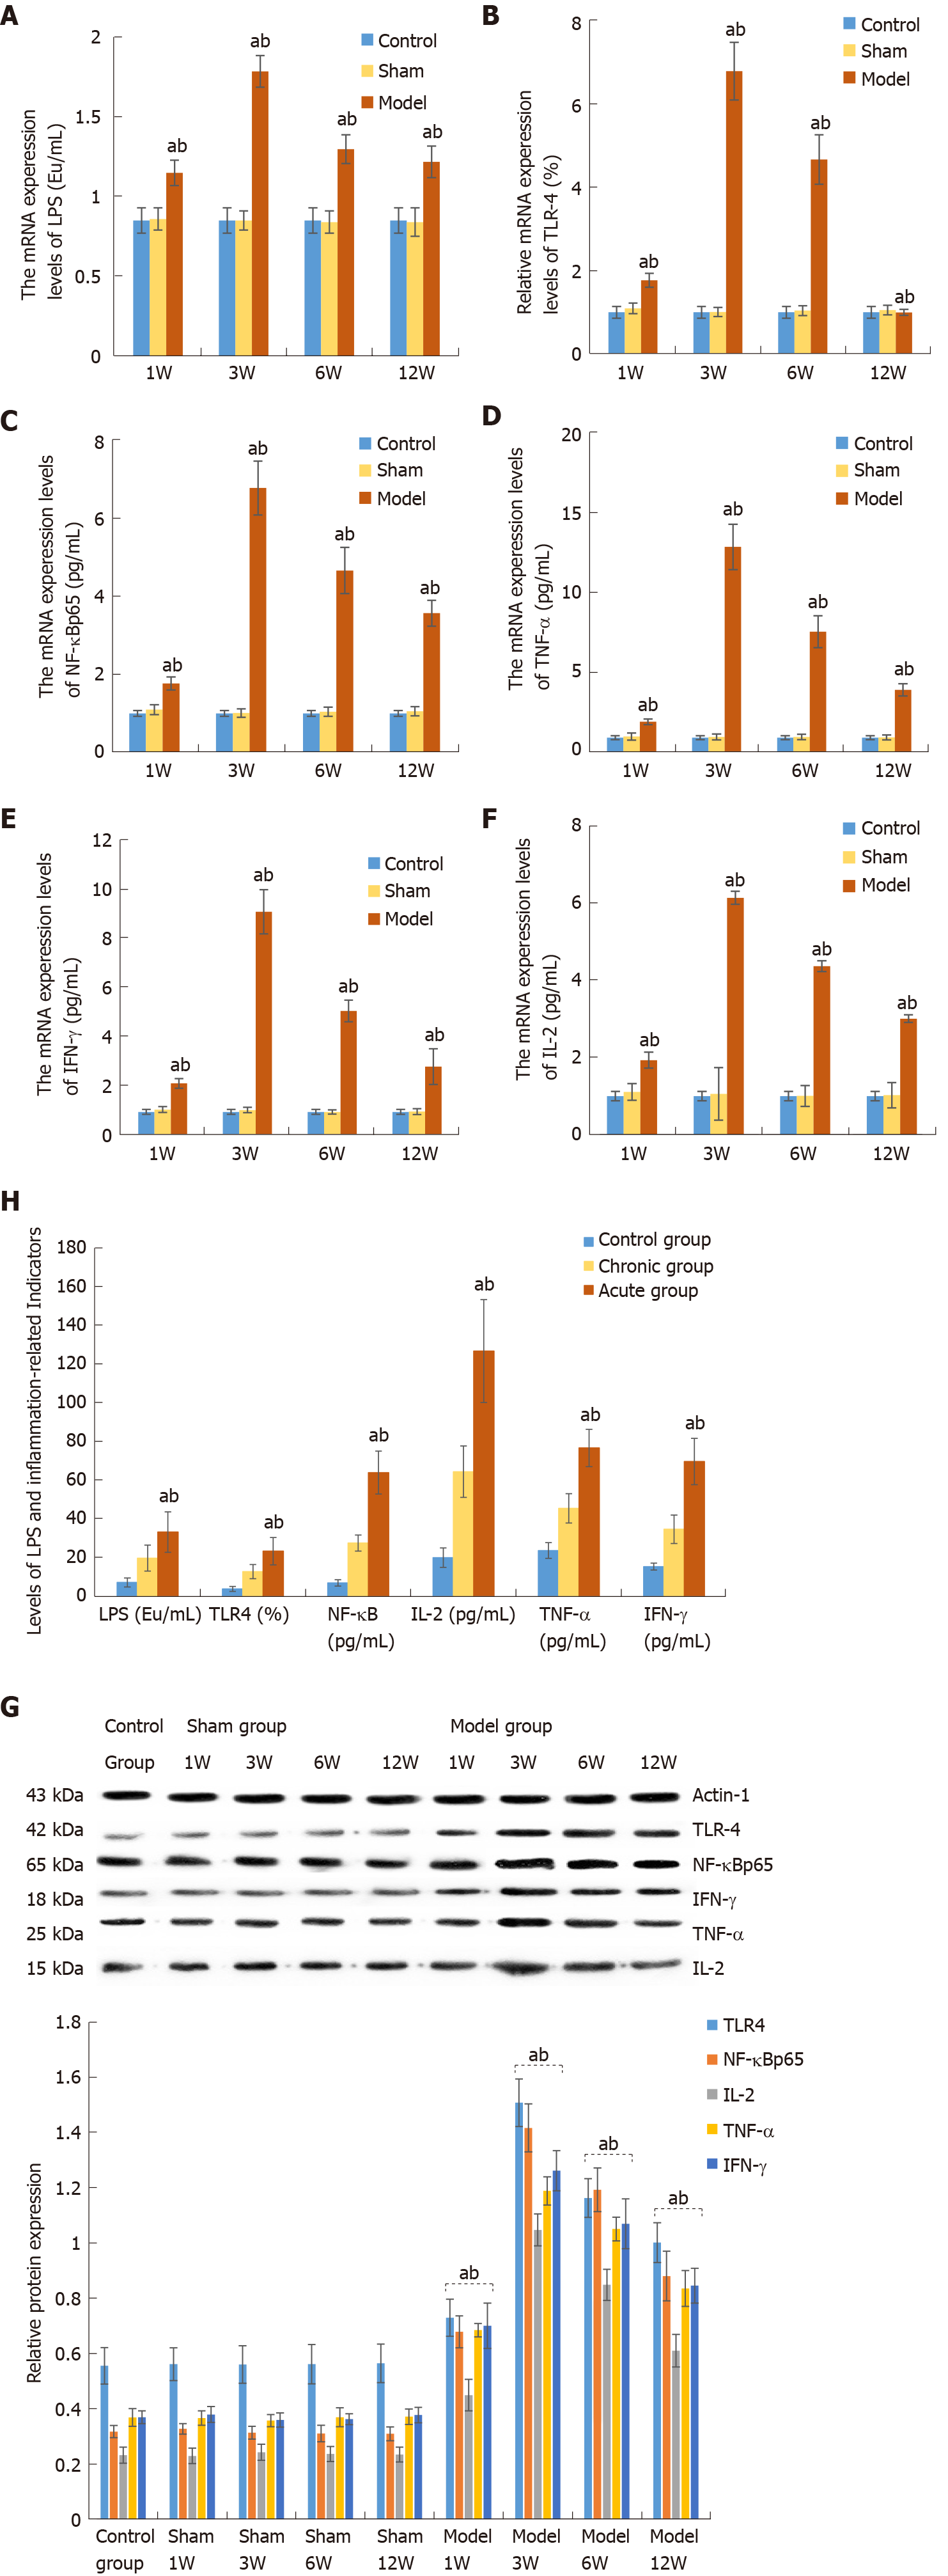
Figure 2 Hepatic mRNA and protein expression levels of lipopolysaccharide and various factors in rats and humans.
A: The expression levels of lipopolysaccharide (LPS) in each group; B: TLR4 expression in each group; C: Nuclear factor-kappa B p65 expression in each group; D: Tumor necrosis factor-α expression in each group; E: Interferon-γ expression in each group; F: Interleukin-2 expression in each group; G: Western blot analysis of protein express levels of various factors in the rat liver tissues; H: Levels of LPS and TLR4/NF-κB mediated inflammation-related indicators in the blood samples from human subjects. LPS: Lipopolysaccharide; TLR4: Toll-like receptor 4; NF-κB: Nuclear factor-kappa B; TNF-α: Tumor necrosis factor-α; IL-2: Interleukin-2; IFN-γ: Interferon-γ. aP < 0.05 comparisons between subgroups. bP < 0.05 comparisons between model subgroups.
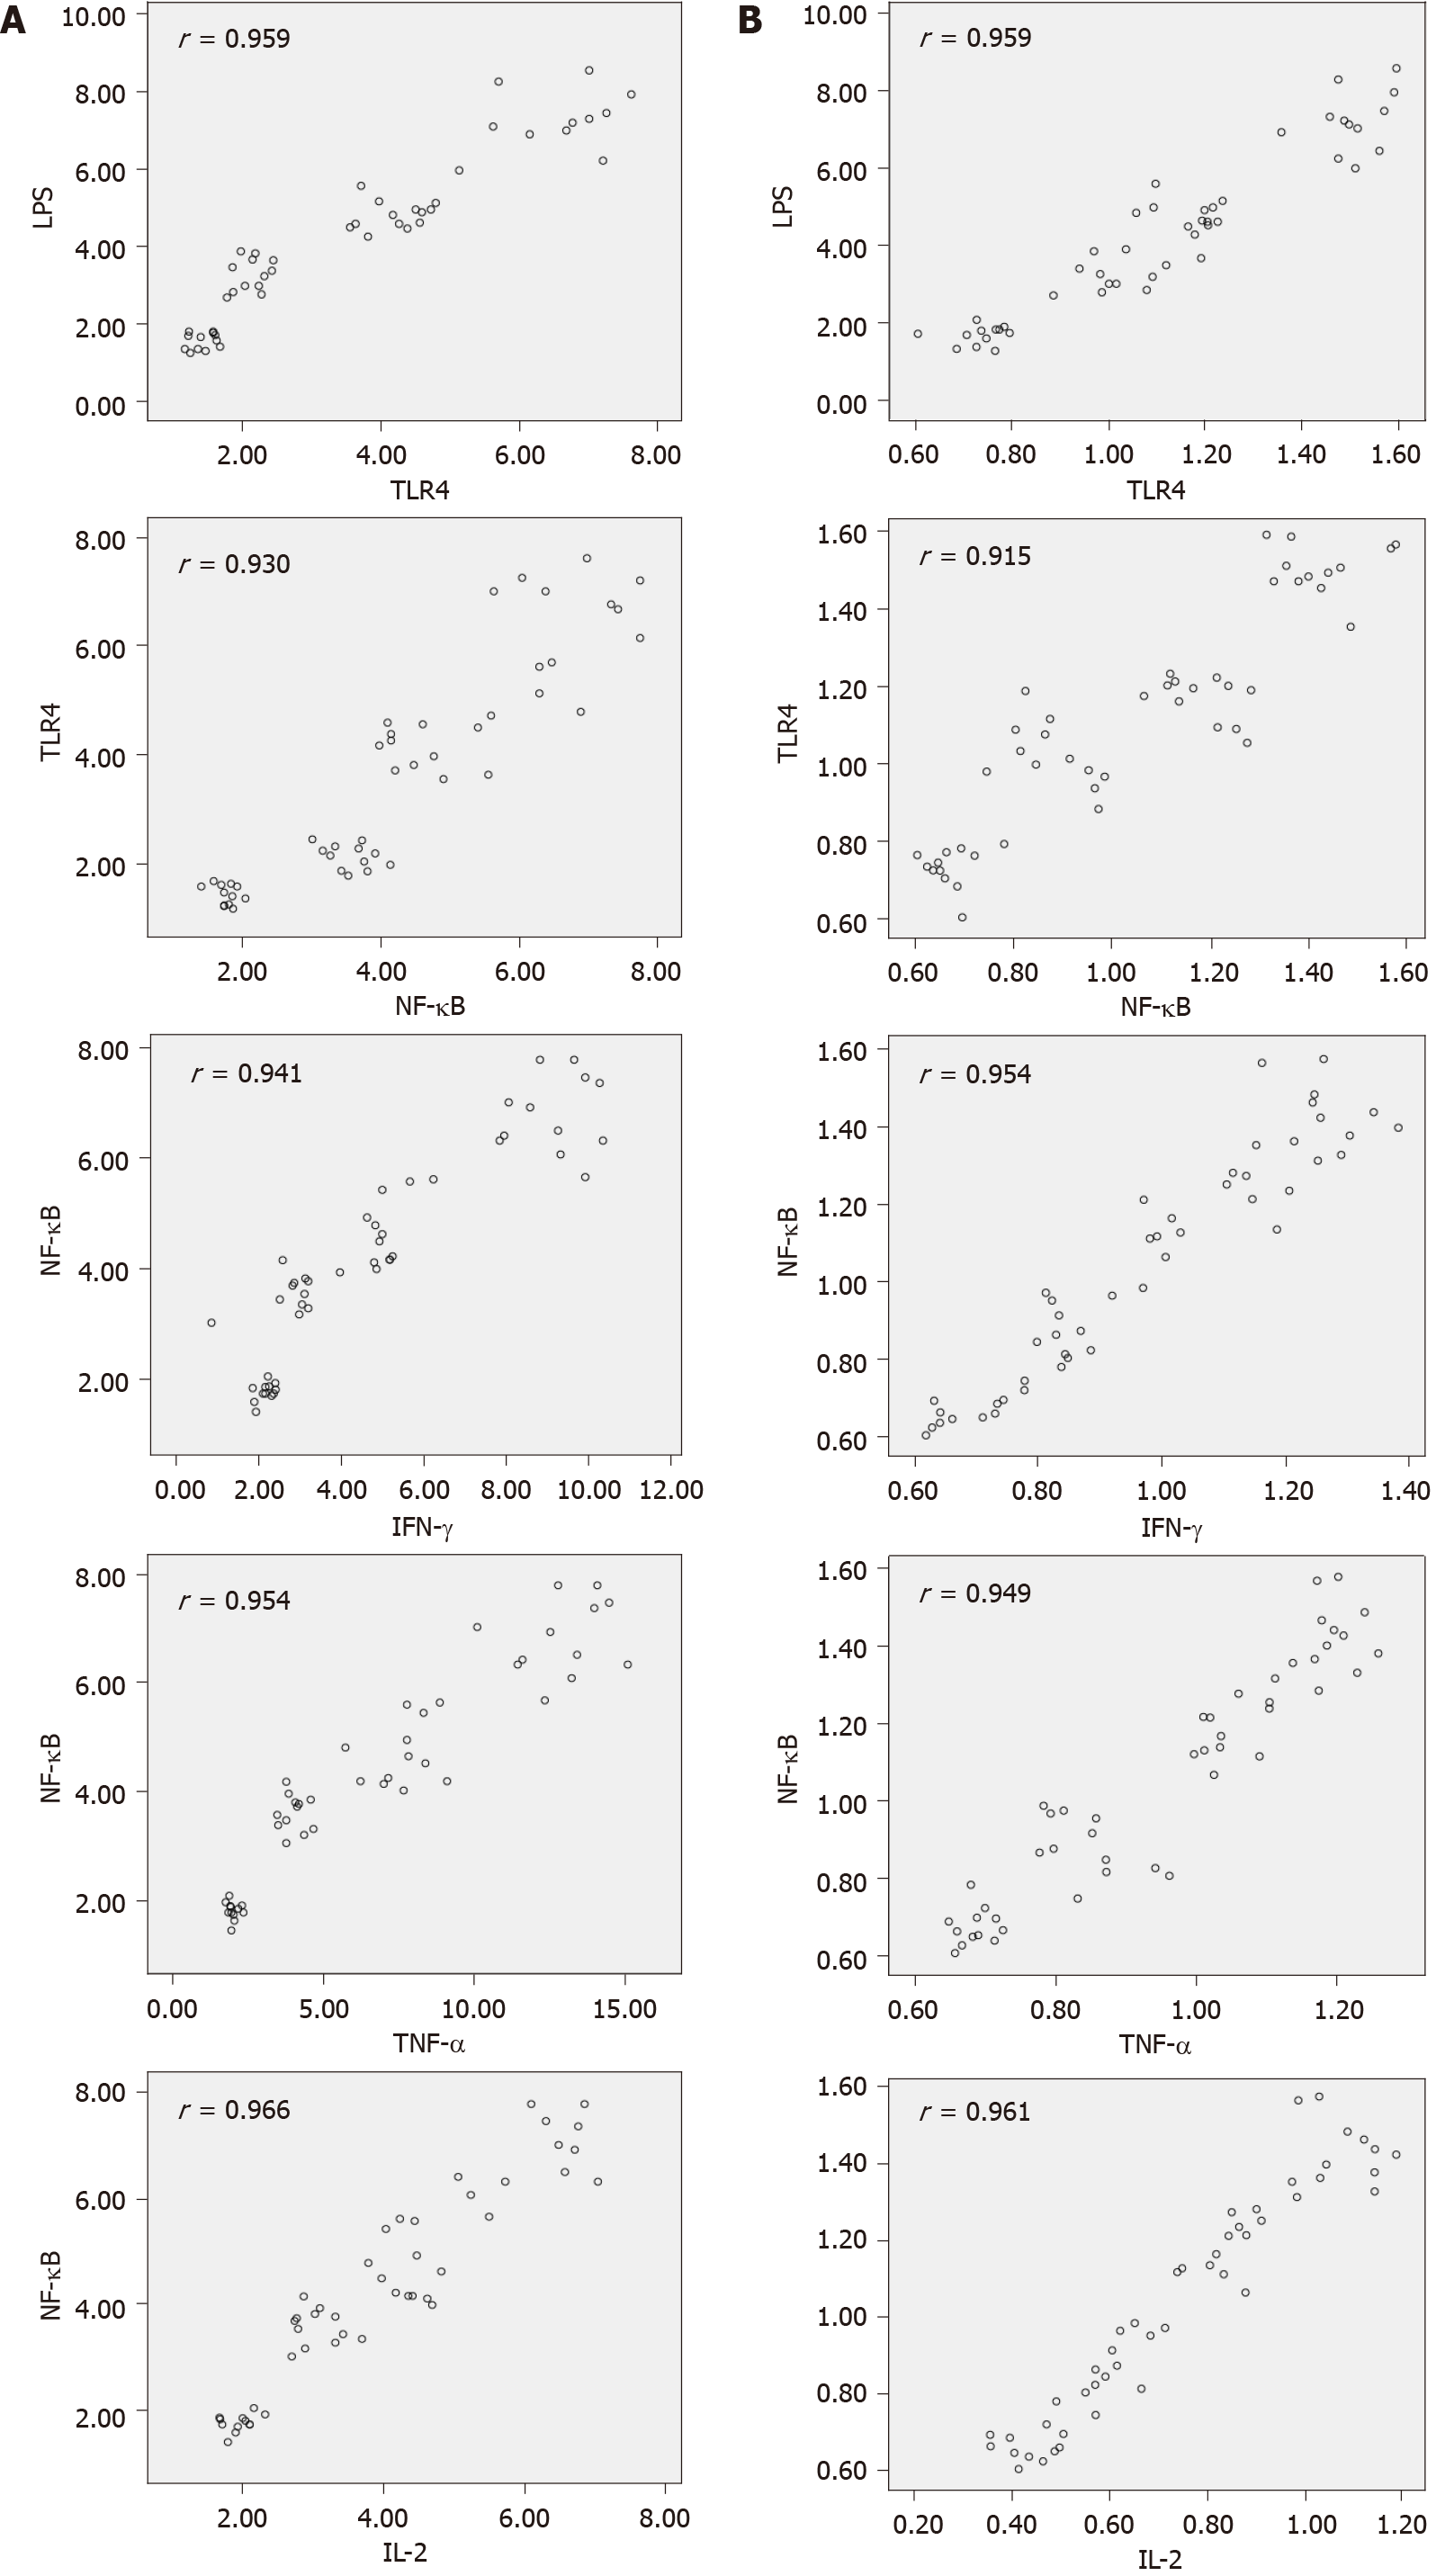
Figure 3 Scatter diagram of lipopolysaccharide and nuclear factor-κB-mediated inflammation-related factors.
A: mRNA level; B: Protein level. LPS: Lipopolysaccharide; TLR4: Toll-like receptor 4; NF-κB: Nuclear factor-κB; TNF-α: Tumor necrosis factor-α; IL-2: Interleukin-2; IFN-γ: Interferon-γ.
- Citation: Li J, Chen XM, Zhou CZ, Fang WW, Lv WF, Cheng DL. Novel roles of lipopolysaccharide and TLR4/NF-κB signaling pathway in inflammatory response to liver injury in Budd-Chiari syndrome. World J Gastrointest Surg 2021; 13(11): 1448-1462
- URL: https://www.wjgnet.com/1948-9366/full/v13/i11/1448.htm
- DOI: https://dx.doi.org/10.4240/wjgs.v13.i11.1448


