Copyright
©The Author(s) 2021.
World J Gastrointest Surg. Nov 27, 2021; 13(11): 1361-1371
Published online Nov 27, 2021. doi: 10.4240/wjgs.v13.i11.1361
Published online Nov 27, 2021. doi: 10.4240/wjgs.v13.i11.1361
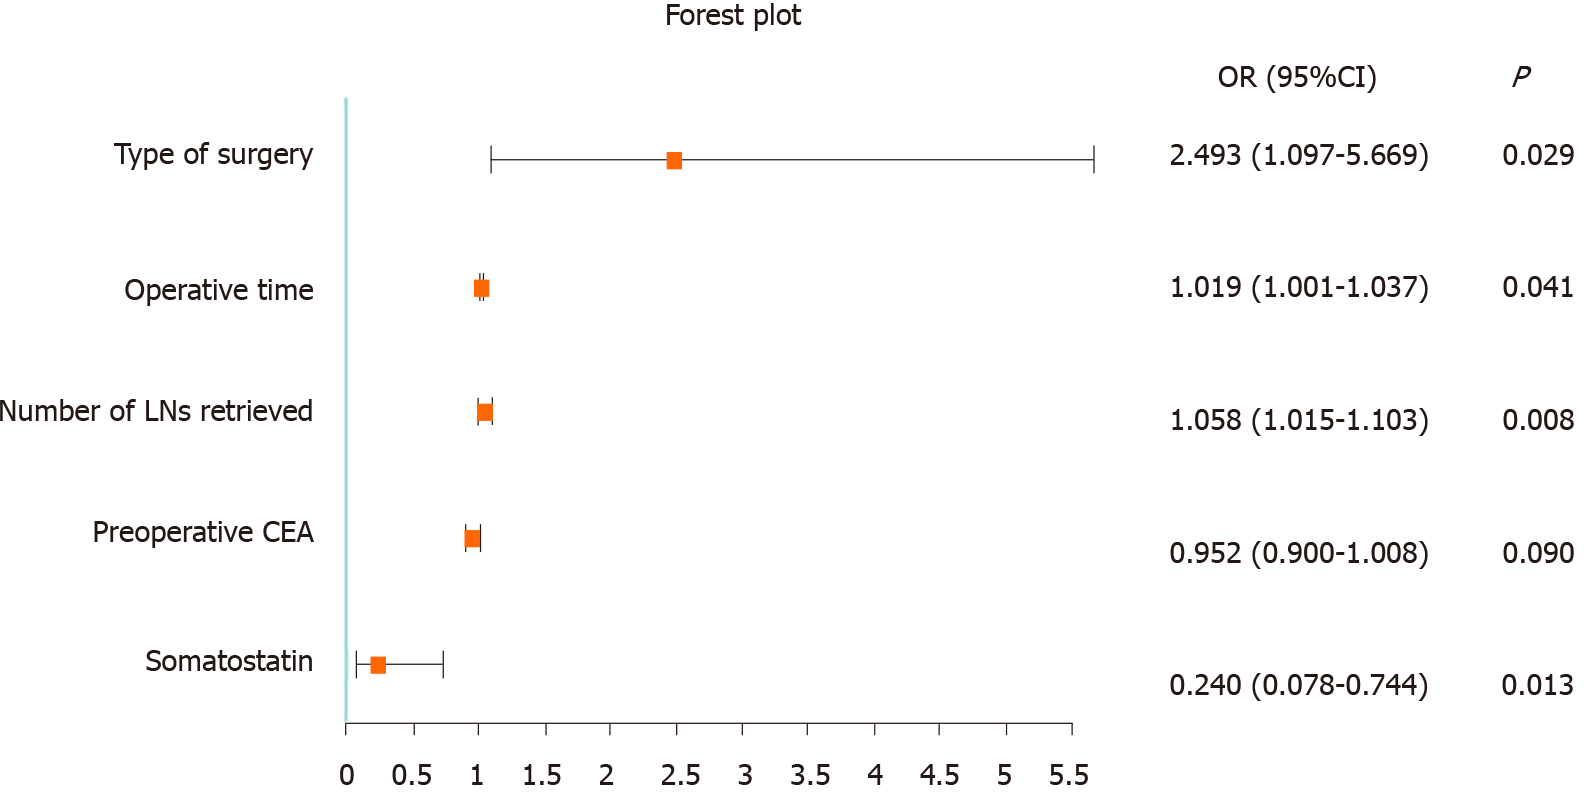
Figure 1 Forest plot.
LNs: Lymph nodes; CEA: Carcinoembryonic antigen.
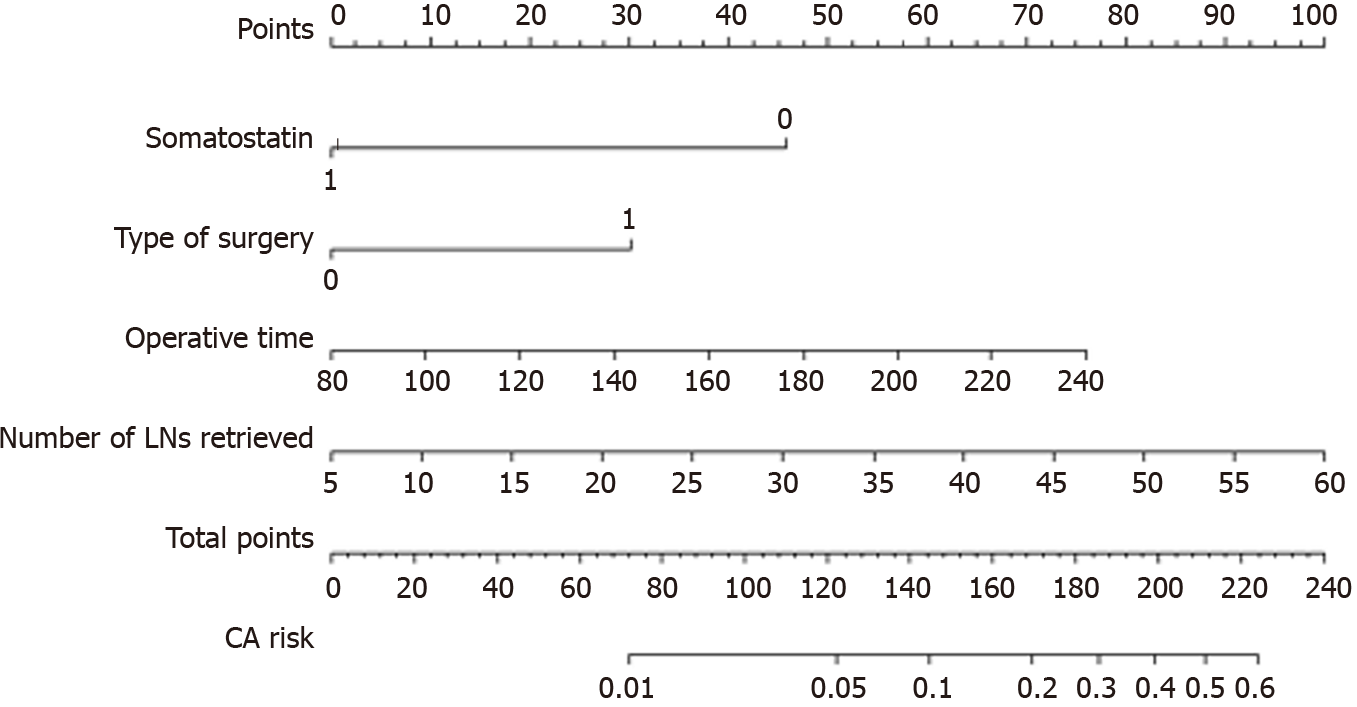
Figure 2 Nomogram for predicting chylous ascites after right colectomy.
The nomogram to predict the incidence of chylous ascites (CA) was created based on four independent risk factors, including somatostatin administration, type of surgery, operative time and number of lymph nodes retrieved. The “Nomogram for CA” section of the article provides a detailed description of the nomogram. LNs: Lymph nodes; CA: Chylous ascites.
Figure 3 Validation of the nomogram.
A: receiver operating characteristic (ROC) curve for the nomogram. C statistic/ area under the receiver operating characteristic curve (AUC) = 0.770 (95%Cl: 0.706-0.834); B: Nomogram calibration curve. The y-axis represents the actual probability of chylous ascites. The x-axis represents estimated probability. The ideal line represents a perfect prediction model. The apparent line represents the performance of the nomogram, and a close fit to the ideal line represents a good prediction.
- Citation: Zheng HD, Liu YR, Chen ZZ, Sun YF, Xu CH, Xu JH. Nomogram for predicting chylous ascites after right colectomy. World J Gastrointest Surg 2021; 13(11): 1361-1371
- URL: https://www.wjgnet.com/1948-9366/full/v13/i11/1361.htm
- DOI: https://dx.doi.org/10.4240/wjgs.v13.i11.1361


