Copyright
©The Author(s) 2020.
World J Gastrointest Surg. Aug 27, 2020; 12(8): 355-368
Published online Aug 27, 2020. doi: 10.4240/wjgs.v12.i8.355
Published online Aug 27, 2020. doi: 10.4240/wjgs.v12.i8.355
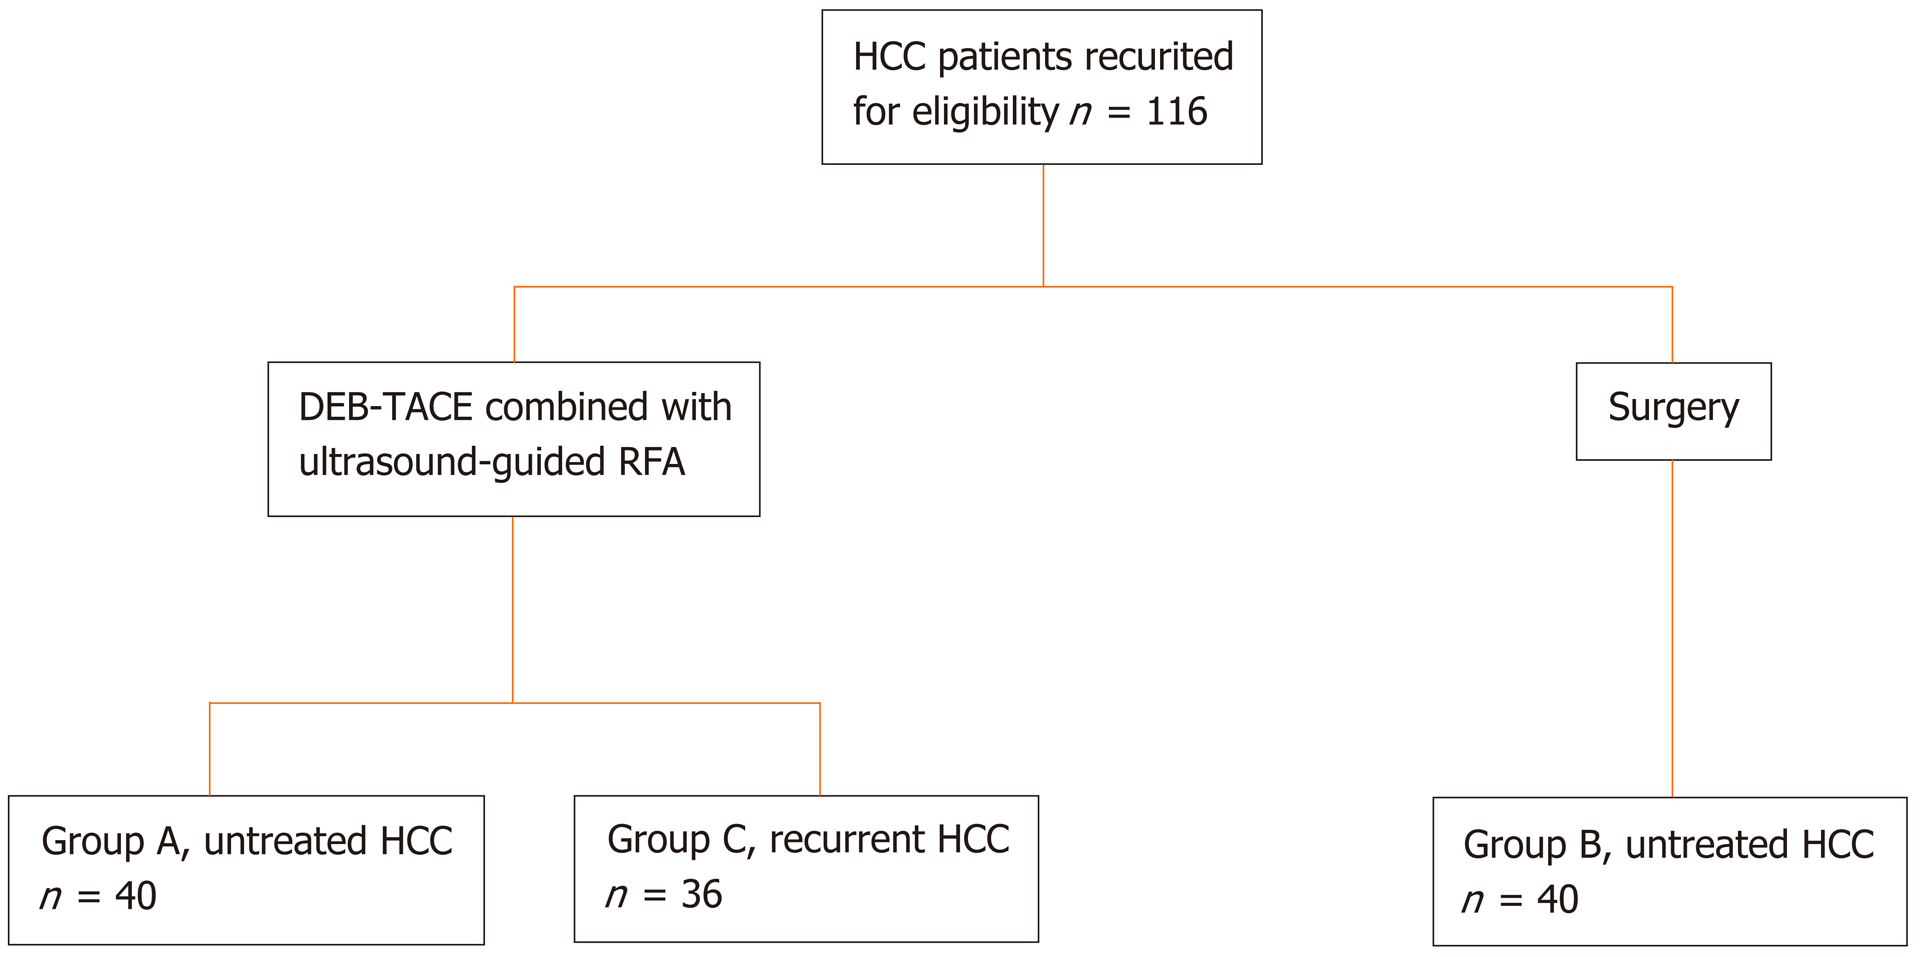
Figure 1 Flow diagram of patient grouping.
DEB-TACE: Drug-eluting beads transarterial chemoem-bolization; HCC: Hepatocellular carcinoma; RFA: Radiofrequency ablation.
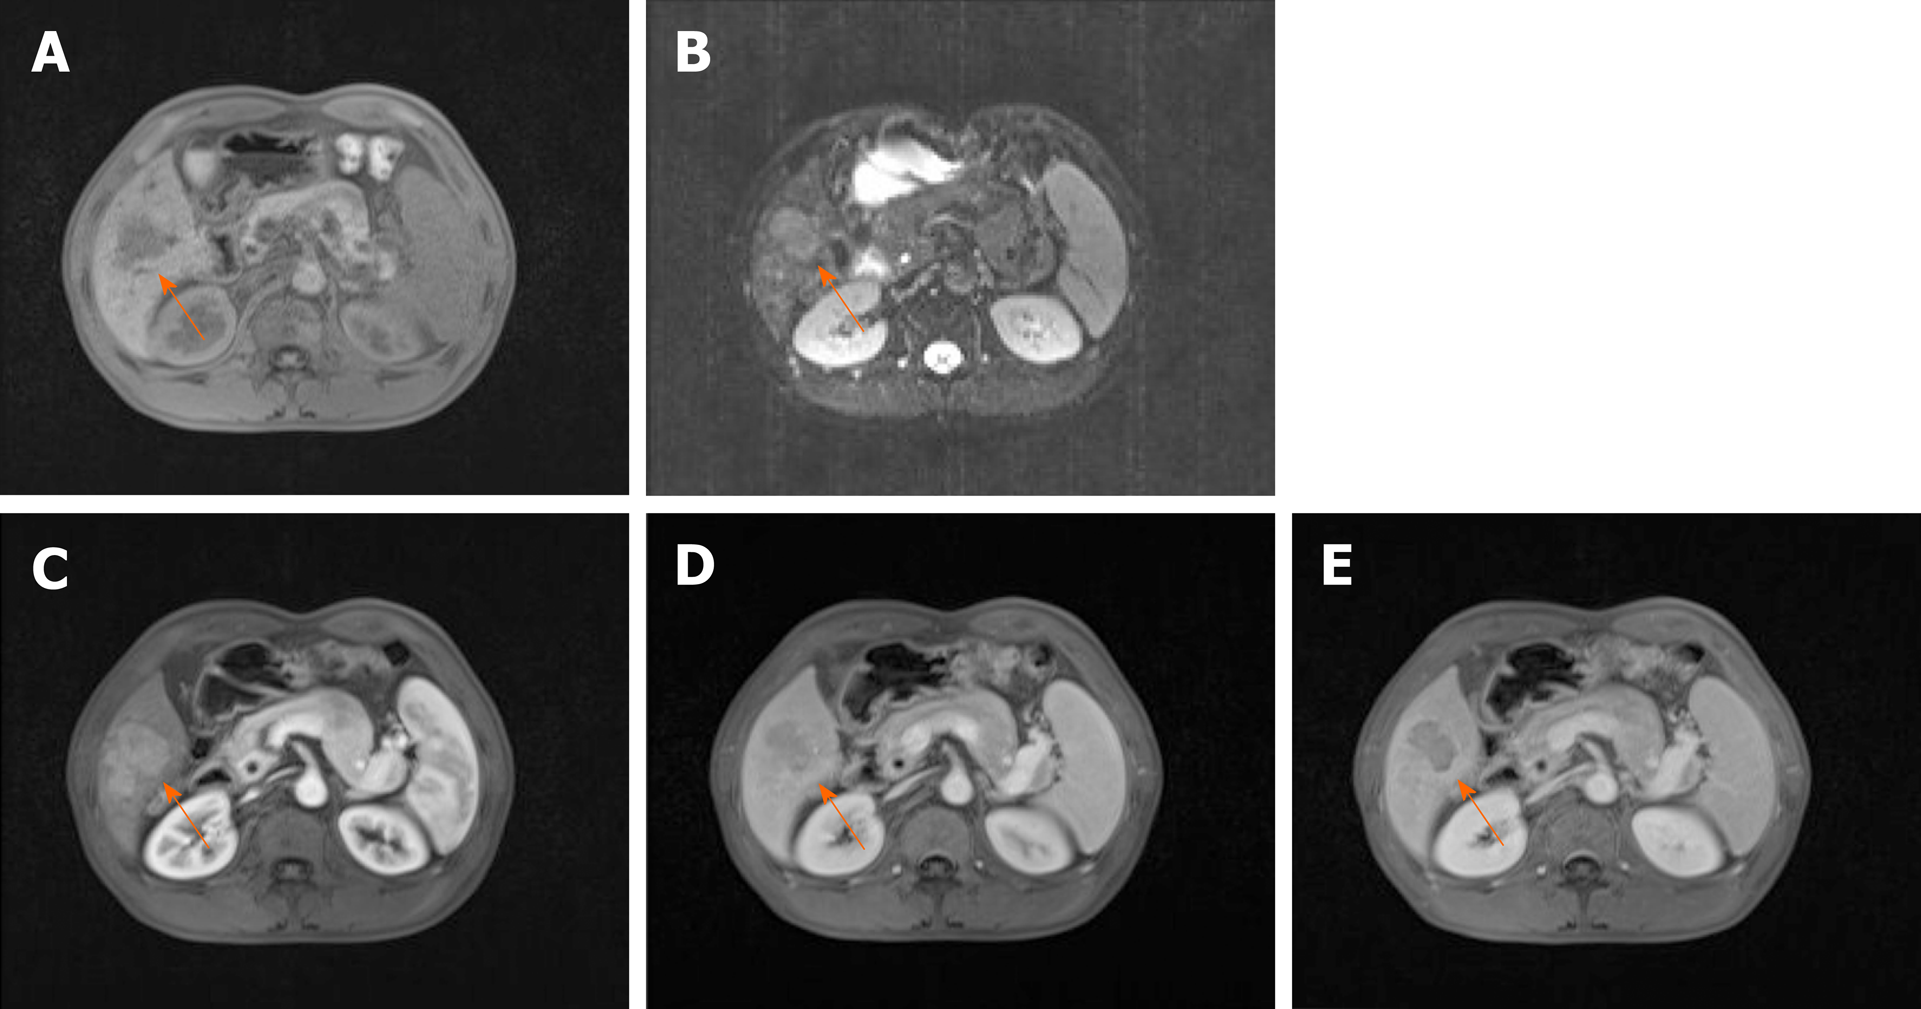
Figure 2 Preoperative magnetic resonance imaging plain and enhanced scans of the upper abdomen.
The location of liver tumor in each figure was marked by the arrow. A: T1-weighted image; B: T2-weighted image; C: Enhanced scan of hepatic arterial phase; D: Enhanced scan of hepatic portal vein phase; E: Enhanced scan of hepatic parenchymal phase.
Figure 3 Post-treatment computed tomography enhanced examination of the upper abdomen.
The location of liver tumor in each figure was marked by the arrow. A: Enhanced scan of hepatic arterial phase; B: Enhanced scan of hepatic portal vein phase; C: Enhanced scan of hepatic parenchymal phase.
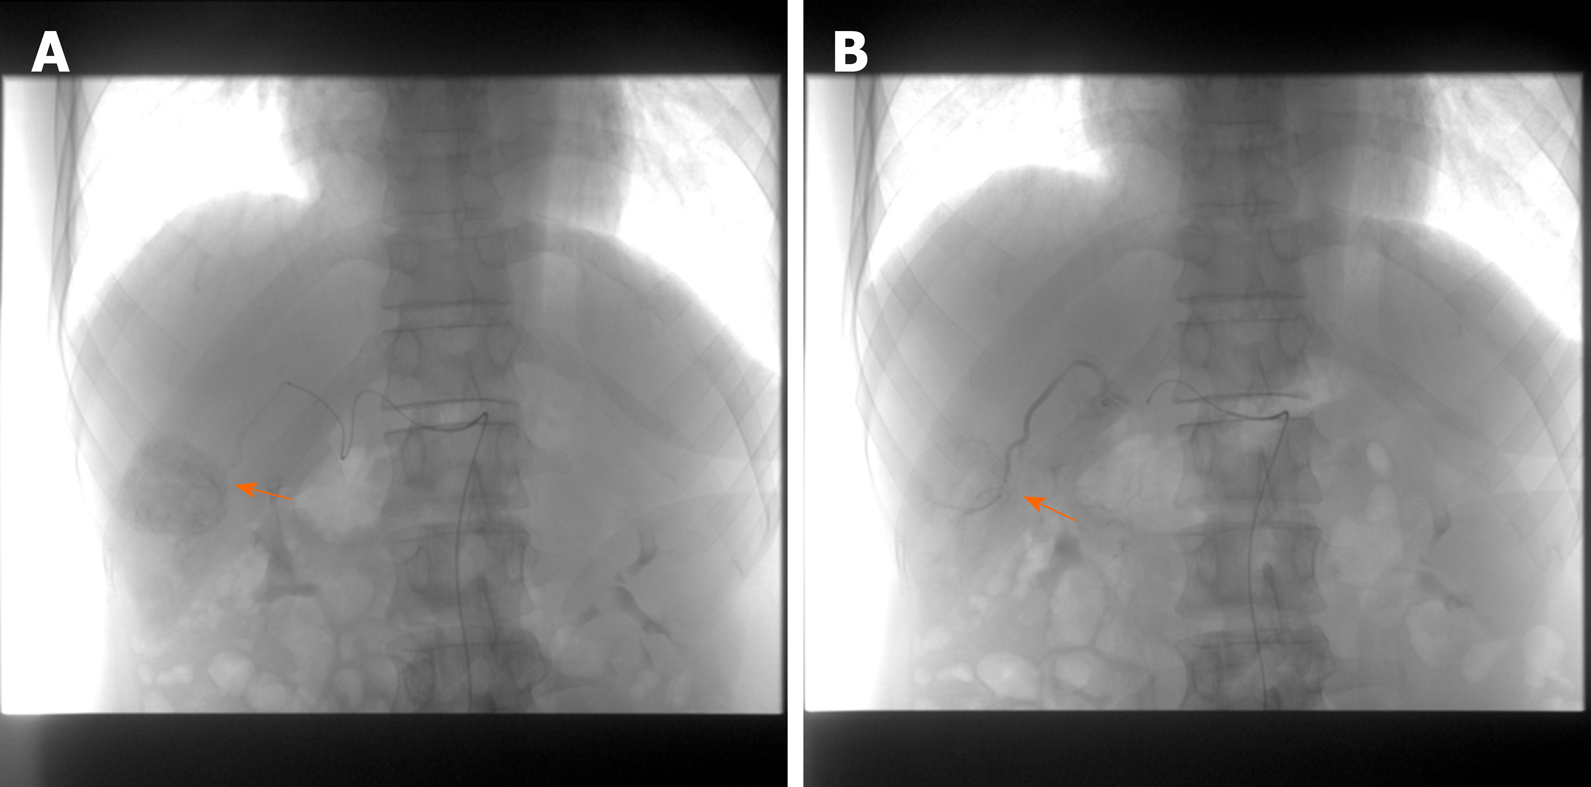
Figure 4 The drug-eluting beads transarterial chemoembolization process of hepatocellular carcinoma.
The location of liver tumor in each figure was marked by the arrow. A: Tumor shown in hepatic arteriography before drug-eluting beads transarterial chemoembolization (DEB-TACE); B: Tumor disappeared in hepatic arteriography after DEB-TACE.
Figure 5 The process of ultrasound-guided radiofrequency ablation after drug-eluting beads transarterial chemoembolization.
The location of liver tumor in each figure was marked by the arrow. A: Needle placement during radiofrequency ablation (RFA); B: Ablation during RFA.
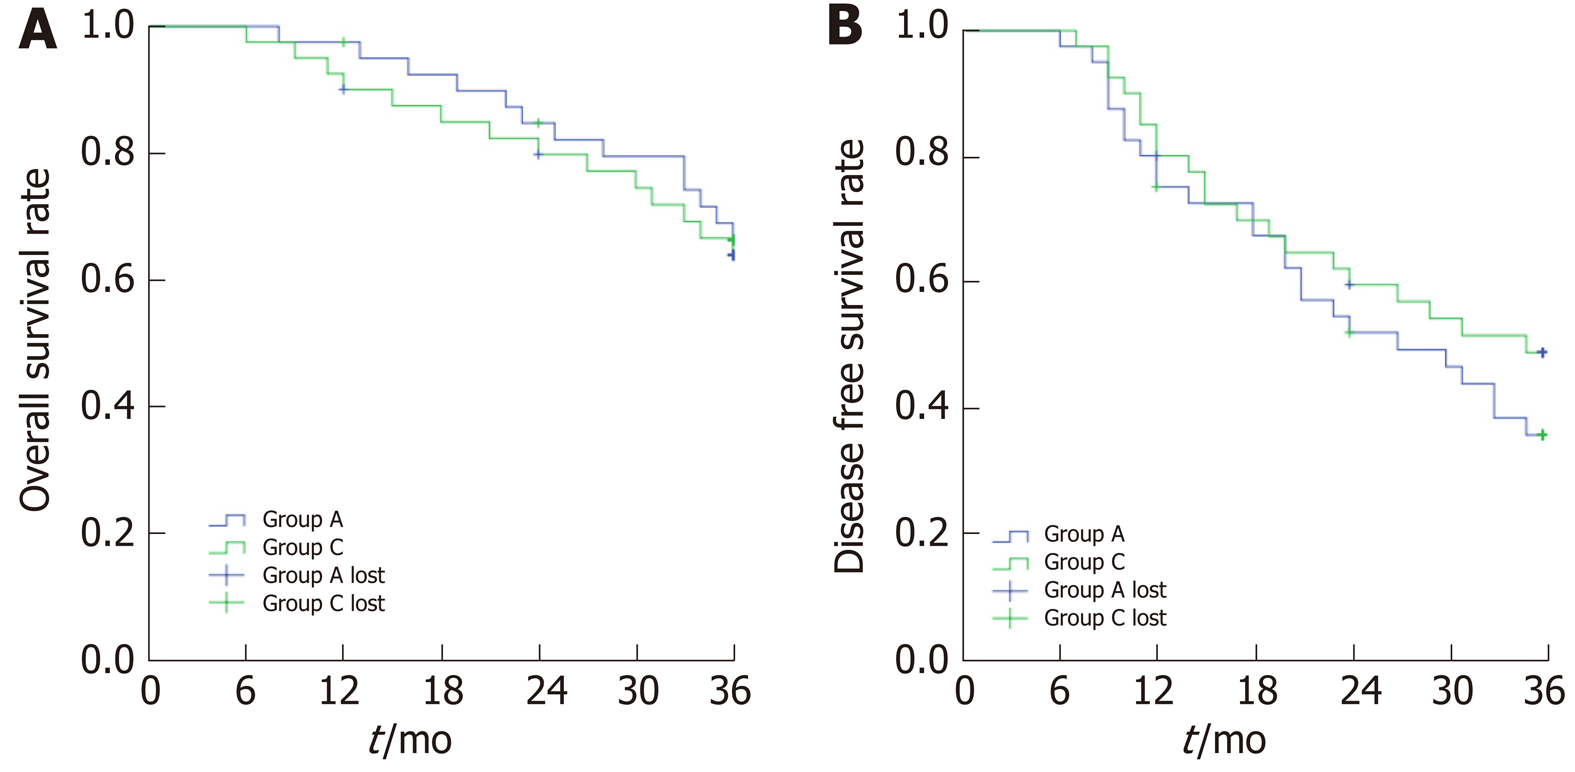
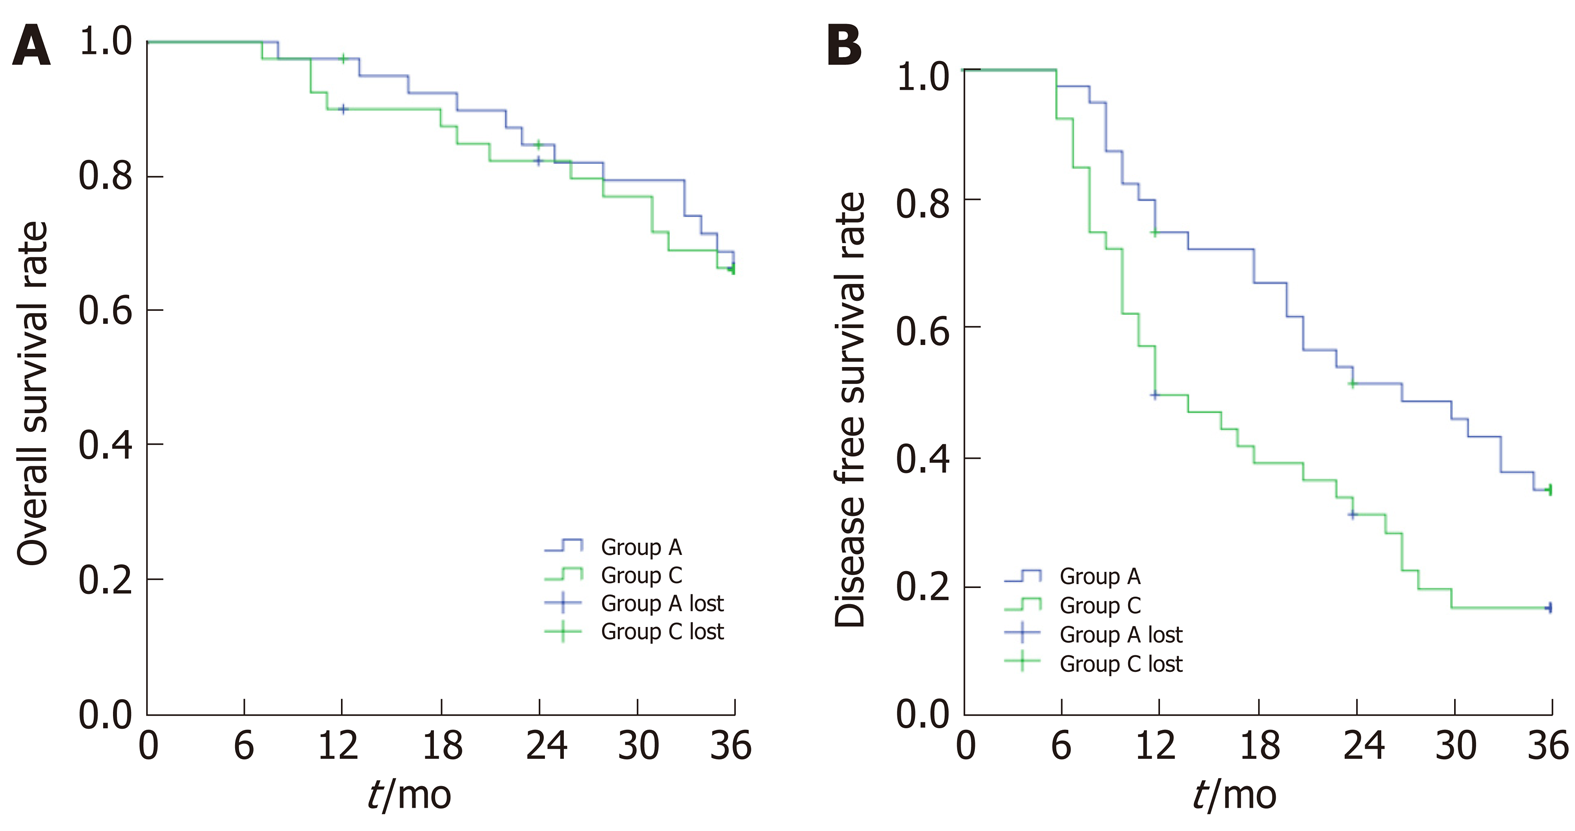
Figure 6 Kaplan-Meier survival analysis of overall survival and disease-free survival of Group A and Group C.
A: Overall survival rate analysis. The difference of Group A and Group C was not statistically significant (Log Rank = 0.121, P = 0.728); B: Disease-free survival rate analysis. The difference of Group A and Group C was not statistically significant (Log Rank = 1.042, P = 0.307).
Figure 7 Kaplan-Meier survival analysis of overall survival and disease-free survival of Group A and Group B.
A: Overall survival rate analysis. The difference of Group A and Group B was not statistically significant (Log Rank = 0.017, P = 0.897); B: Disease-free survival (DFS rate analysis). The DFS rate of Group B was lower than that of Group A (Log Rank = 6.123, P = 0.013).
- Citation: Zhang Y, Zhang MW, Fan XX, Mao DF, Ding QH, Zhuang LH, Lv SY. Drug-eluting beads transarterial chemoembolization sequentially combined with radiofrequency ablation in the treatment of untreated and recurrent hepatocellular carcinoma. World J Gastrointest Surg 2020; 12(8): 355-368
- URL: https://www.wjgnet.com/1948-9366/full/v12/i8/355.htm
- DOI: https://dx.doi.org/10.4240/wjgs.v12.i8.355


