Copyright
©The Author(s) 2019.
World J Gastrointest Surg. Aug 27, 2019; 11(8): 348-357
Published online Aug 27, 2019. doi: 10.4240/wjgs.v11.i8.348
Published online Aug 27, 2019. doi: 10.4240/wjgs.v11.i8.348
Figure 1 Abdominal computed tomography displaying the left liver mass.
A: Arterial phase. B: Portal phase. C: Coronal view.
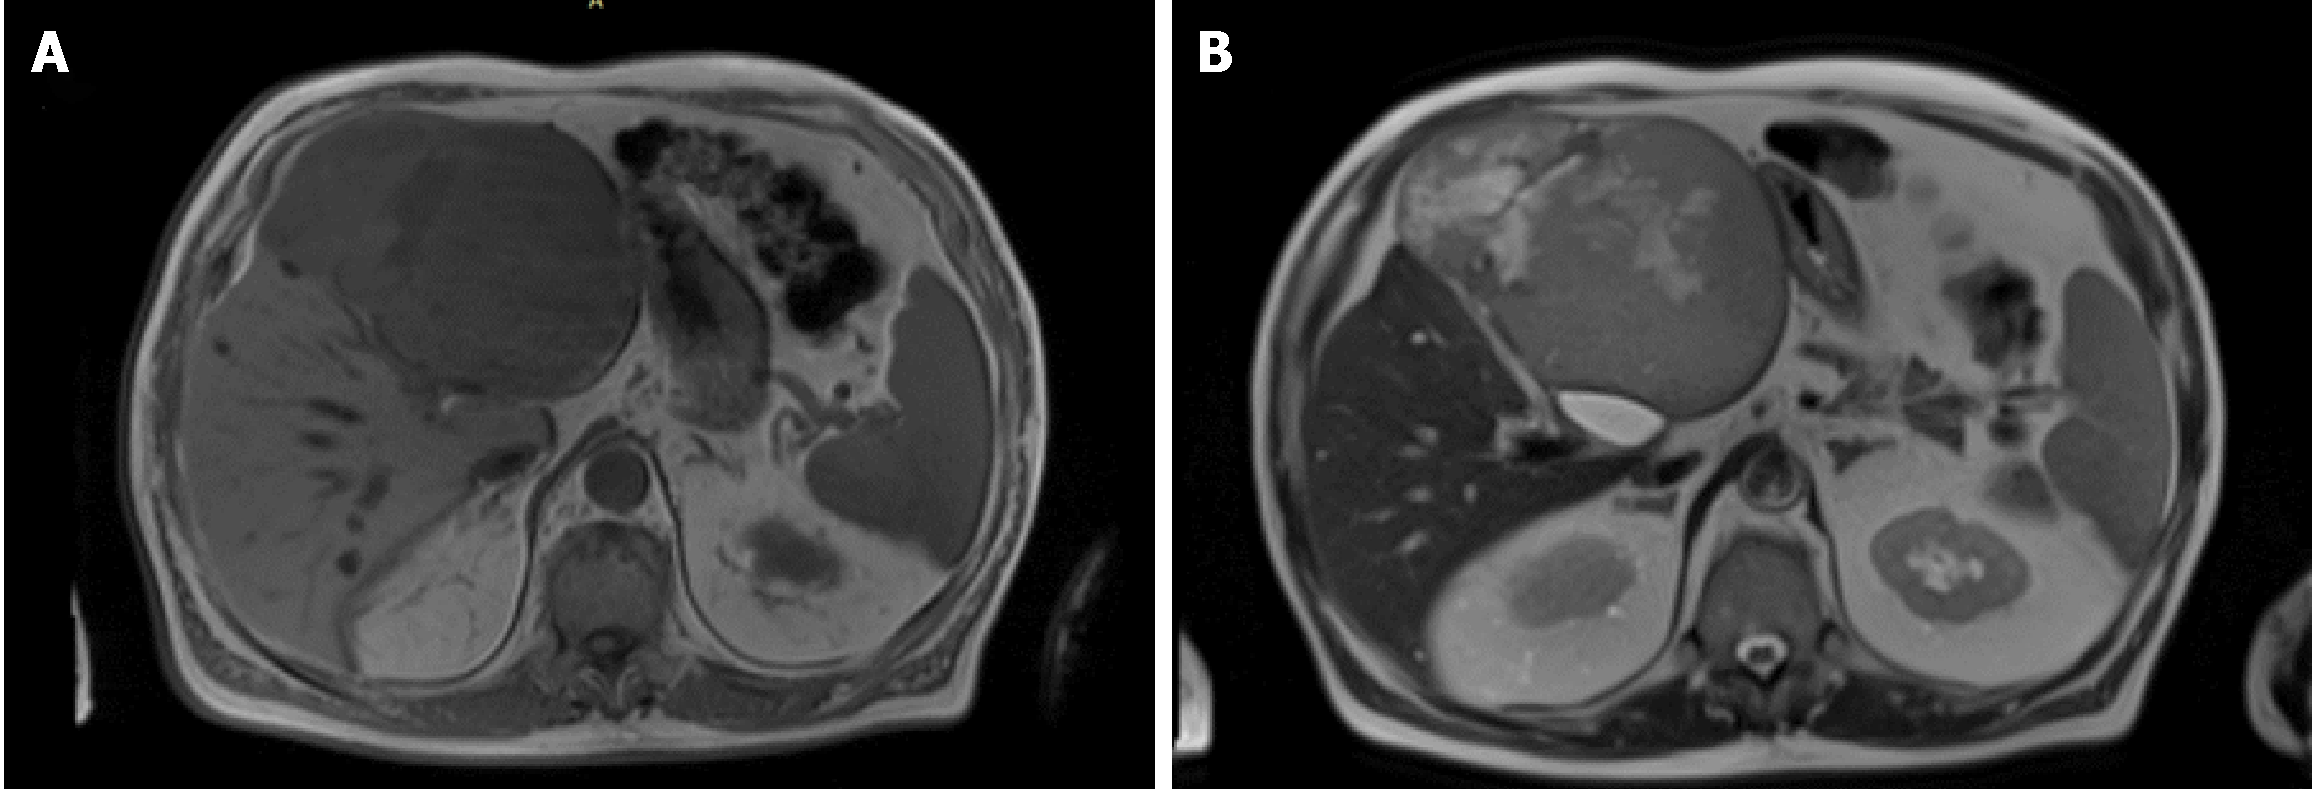
Figure 2 Abdominal magnetic resonance imaging displaying the left liver mass.
A: T1. B: T2.
Figure 3 Macroscopic aspect of solitary fibrous tumor liver.
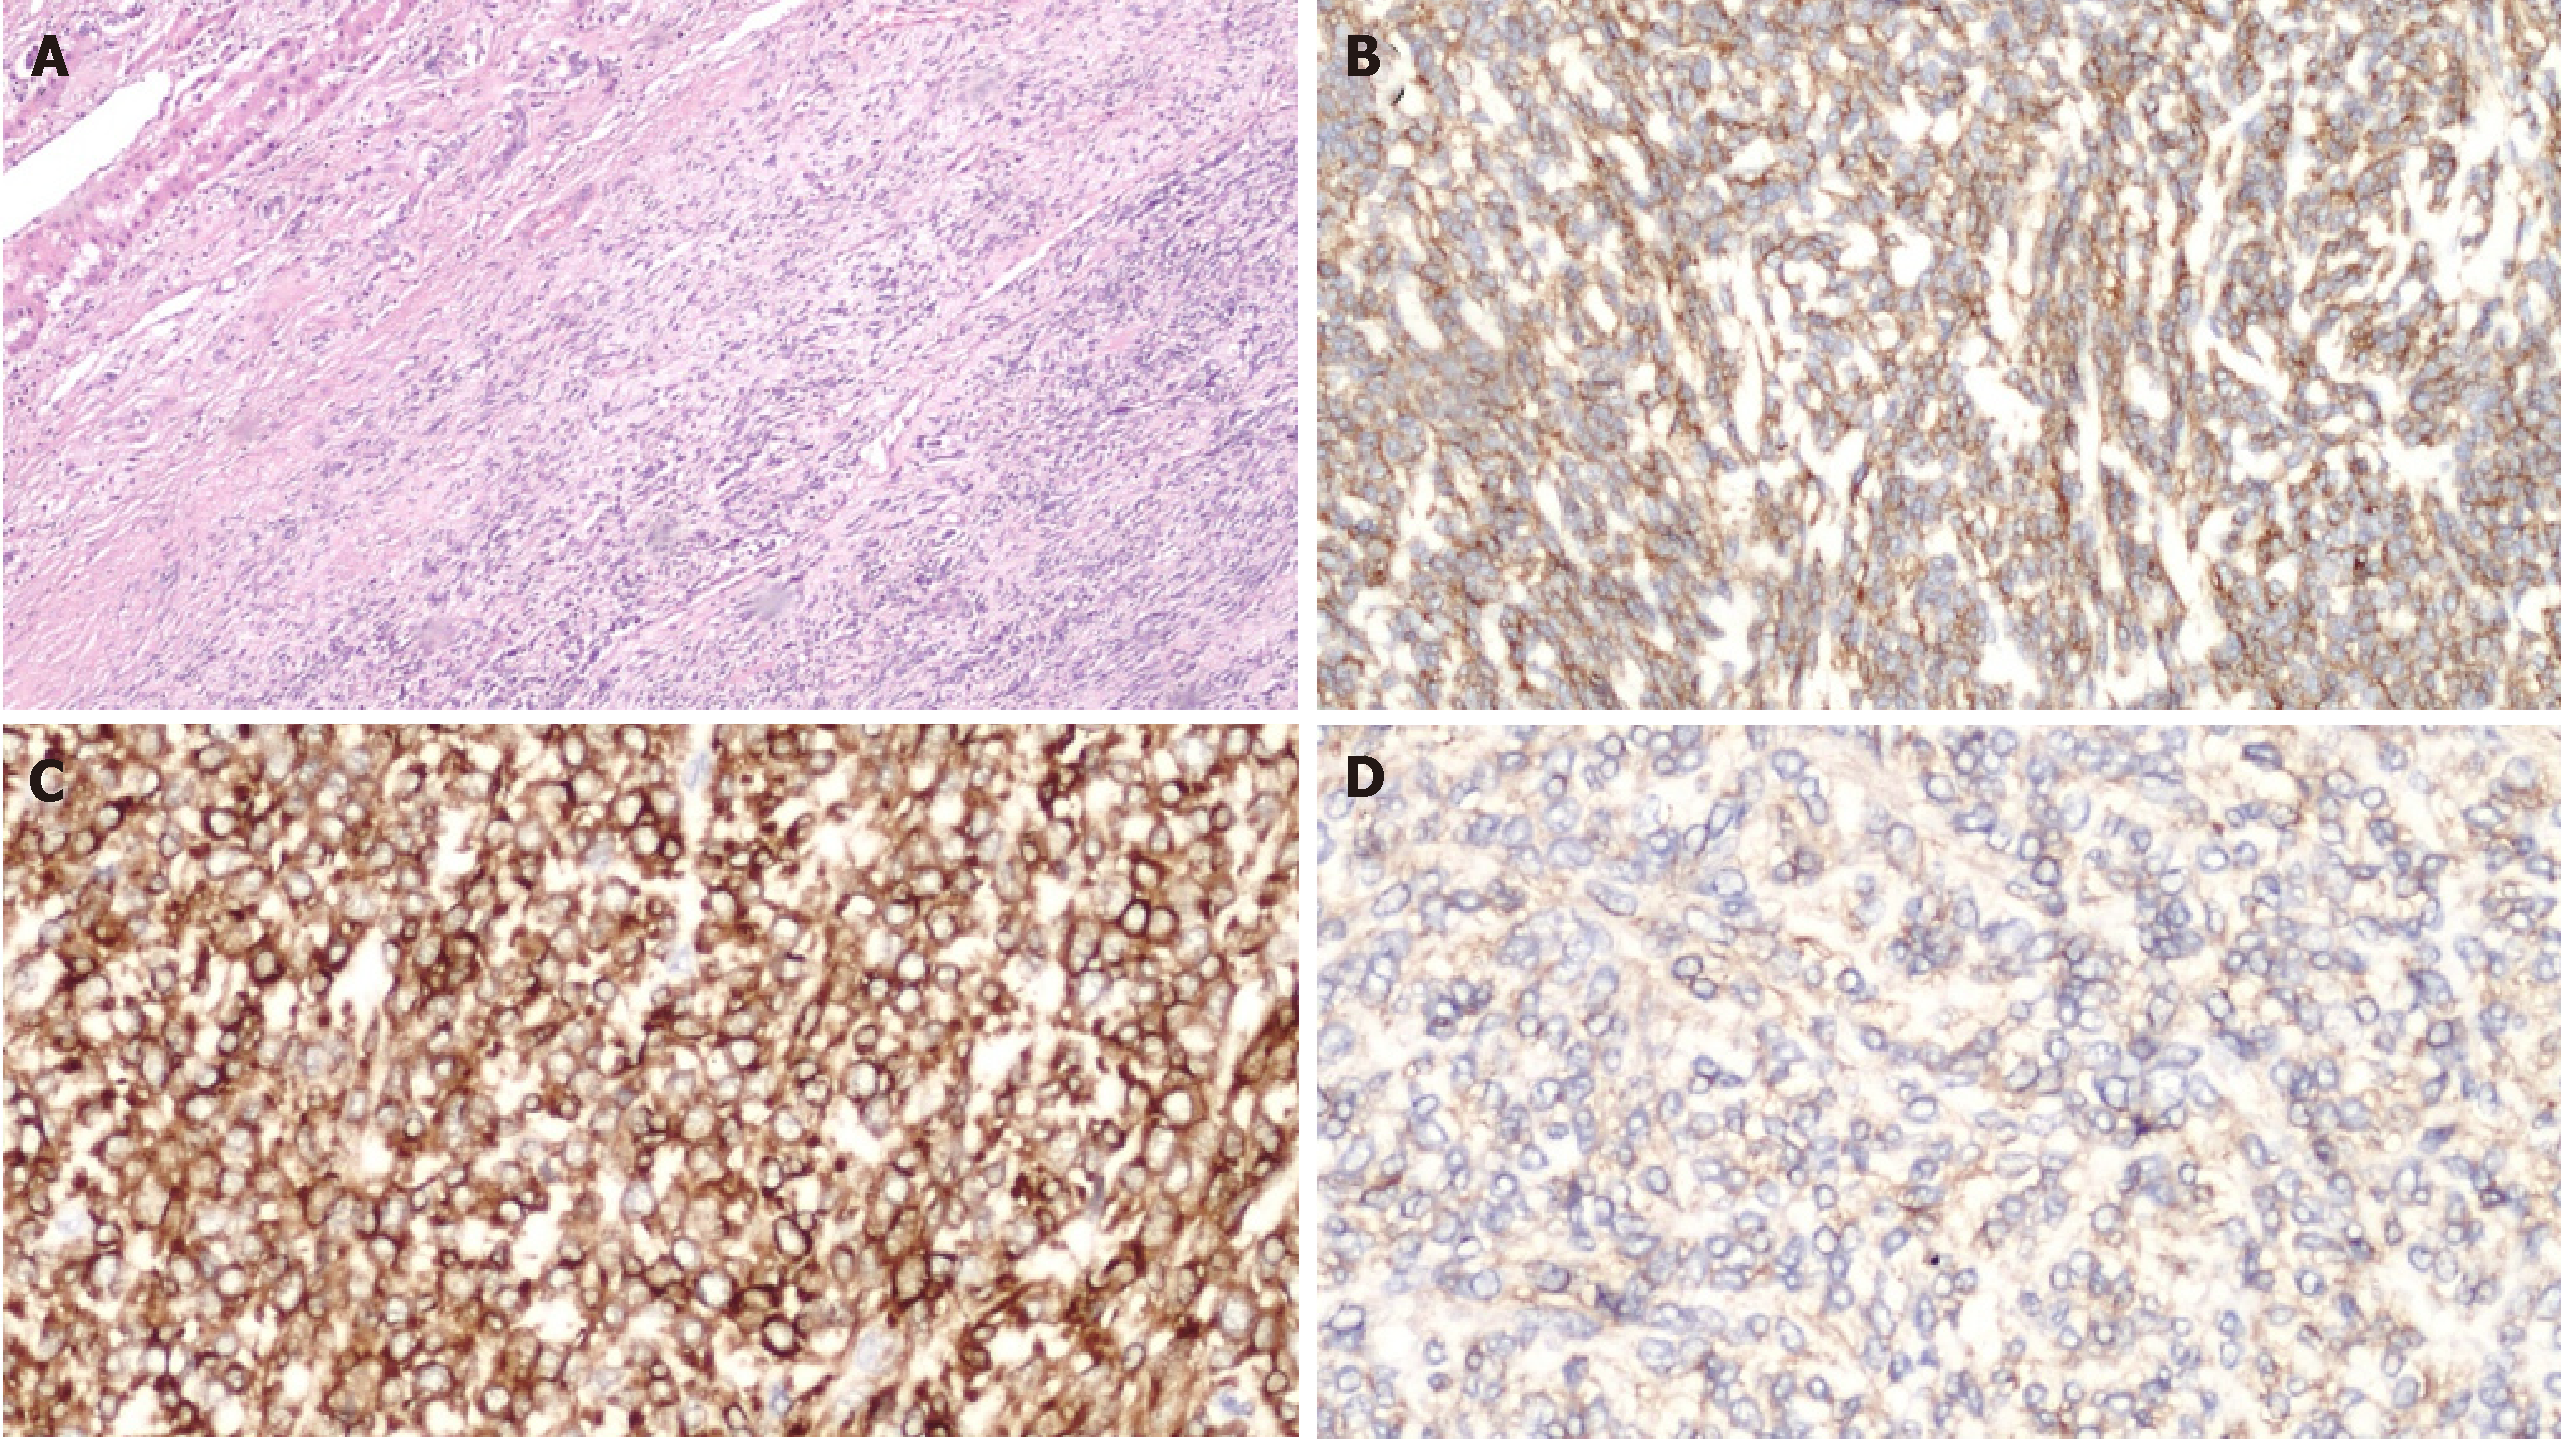
Figure 4 Microscopic findings of solitary fibrous tumor liver.
A: Microscopically, the tumours tissue showed a proliferation of spindle cells with infiltrative pattern of hepatic parenchyma. Immunohistochemically, the tumour cells were strongly positive for CD34 (B) and for BCL2 (C). Weakly positive for CD99 (D).
- Citation: Delvecchio A, Duda L, Conticchio M, Fiore F, Lafranceschina S, Riccelli U, Cristofano A, Pascazio B, Colagrande A, Resta L, Memeo R. Doege-Potter syndrome by malignant solitary fibrous tumor of the liver: A case report and review of literature. World J Gastrointest Surg 2019; 11(8): 348-357
- URL: https://www.wjgnet.com/1948-9366/full/v11/i8/348.htm
- DOI: https://dx.doi.org/10.4240/wjgs.v11.i8.348


