Copyright
©The Author(s) 2019.
World J Gastrointest Surg. Jul 27, 2019; 11(7): 322-332
Published online Jul 27, 2019. doi: 10.4240/wjgs.v11.i7.322
Published online Jul 27, 2019. doi: 10.4240/wjgs.v11.i7.322
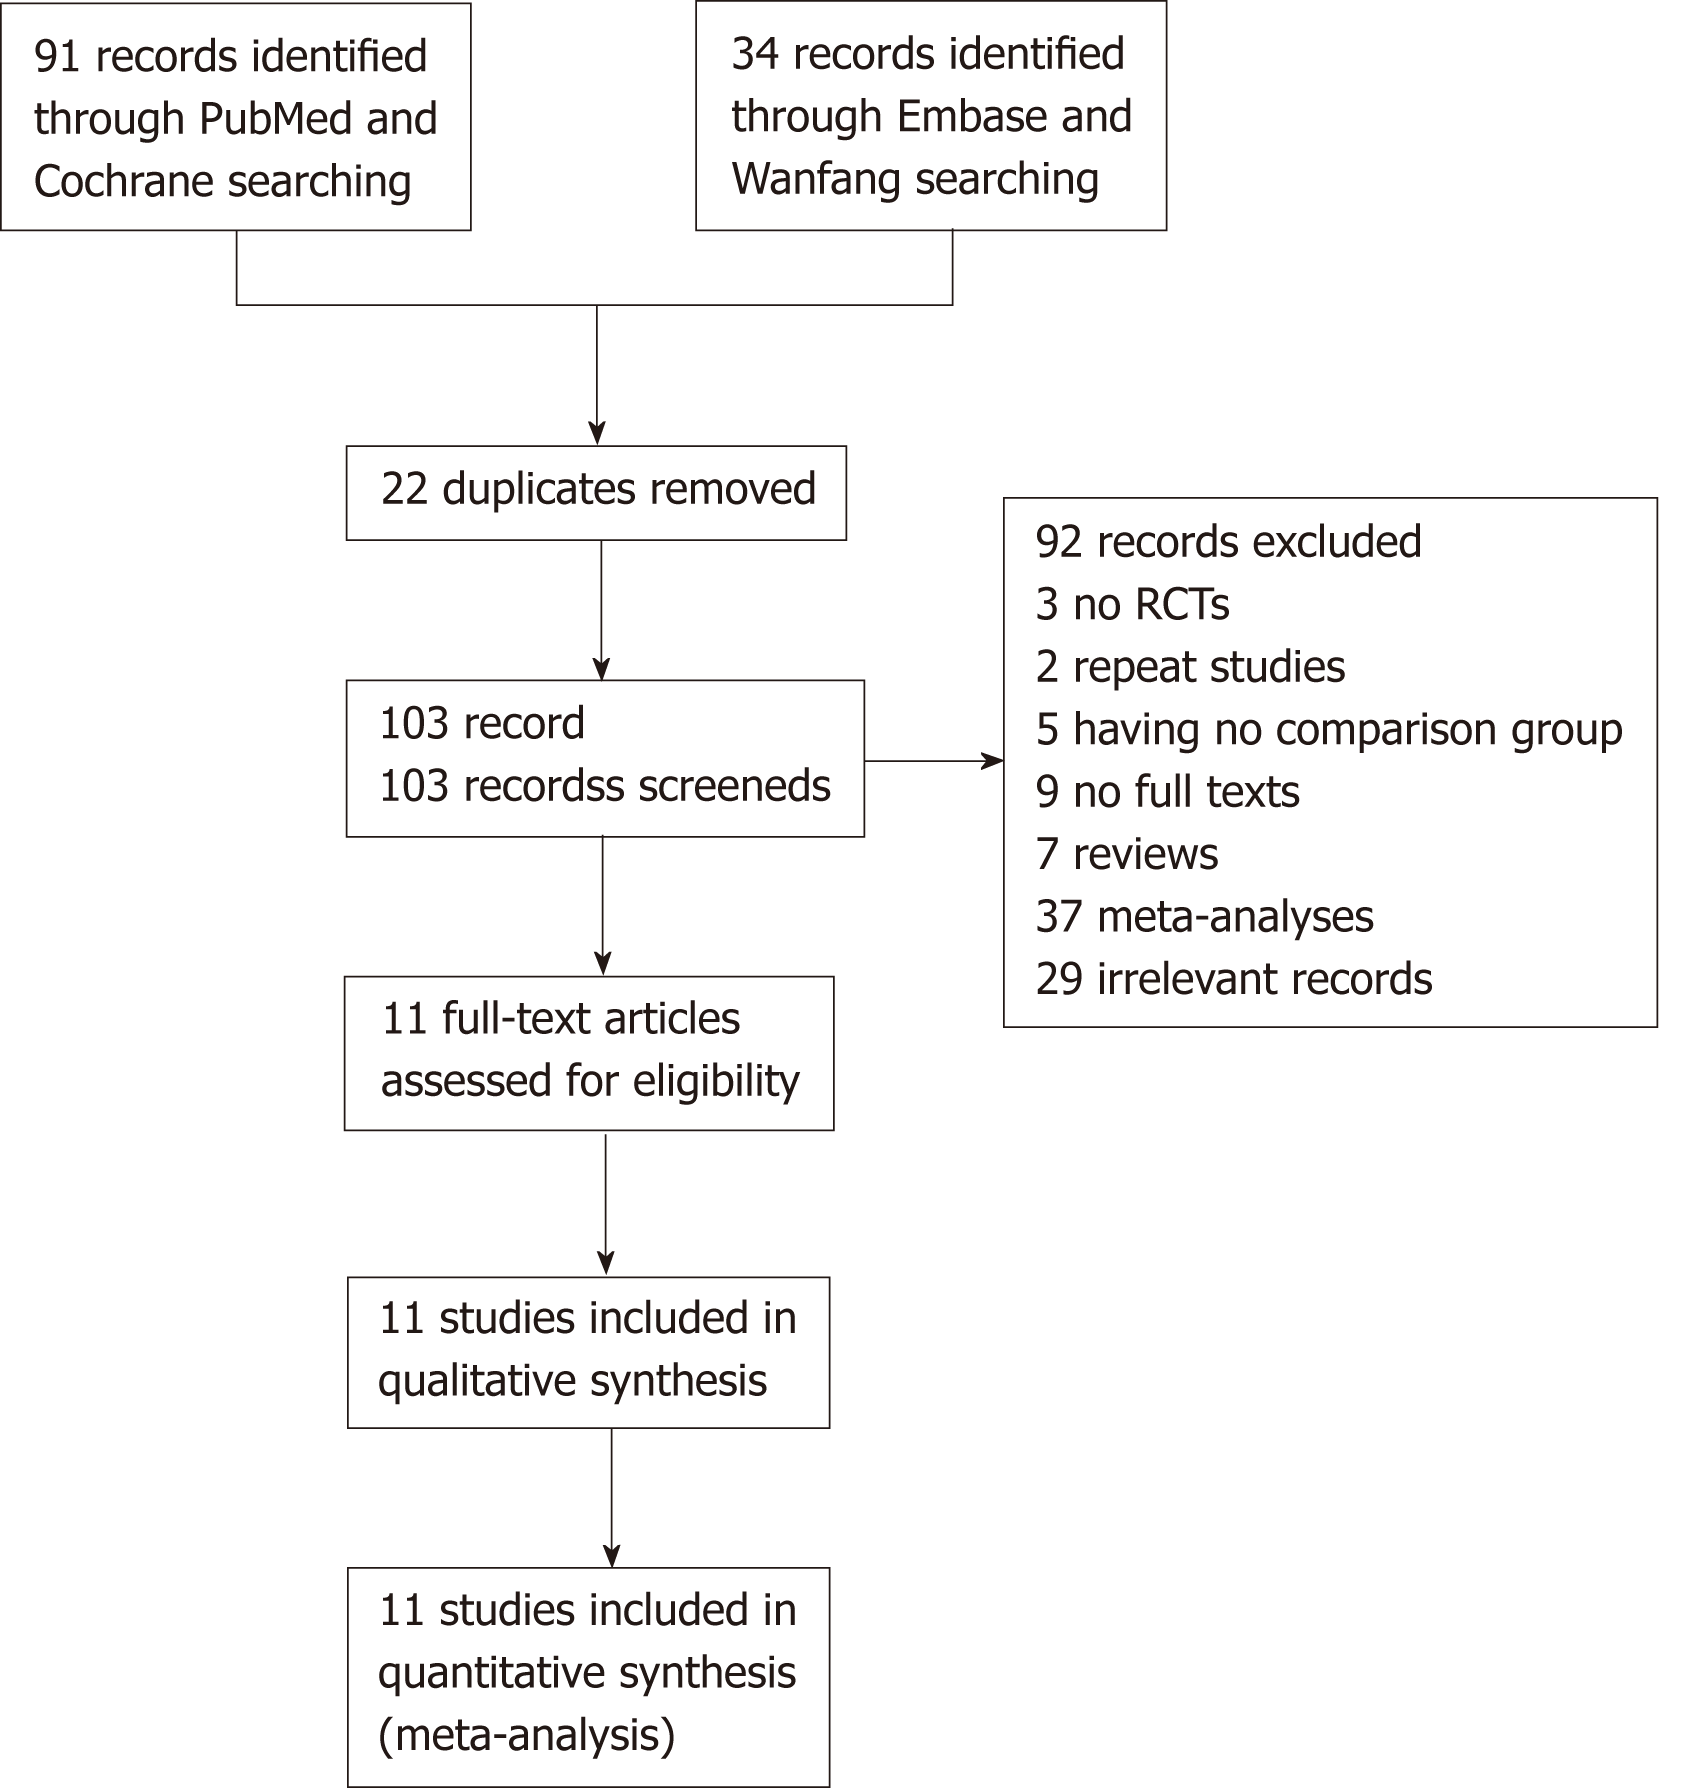
Figure 1 Study flow diagram.
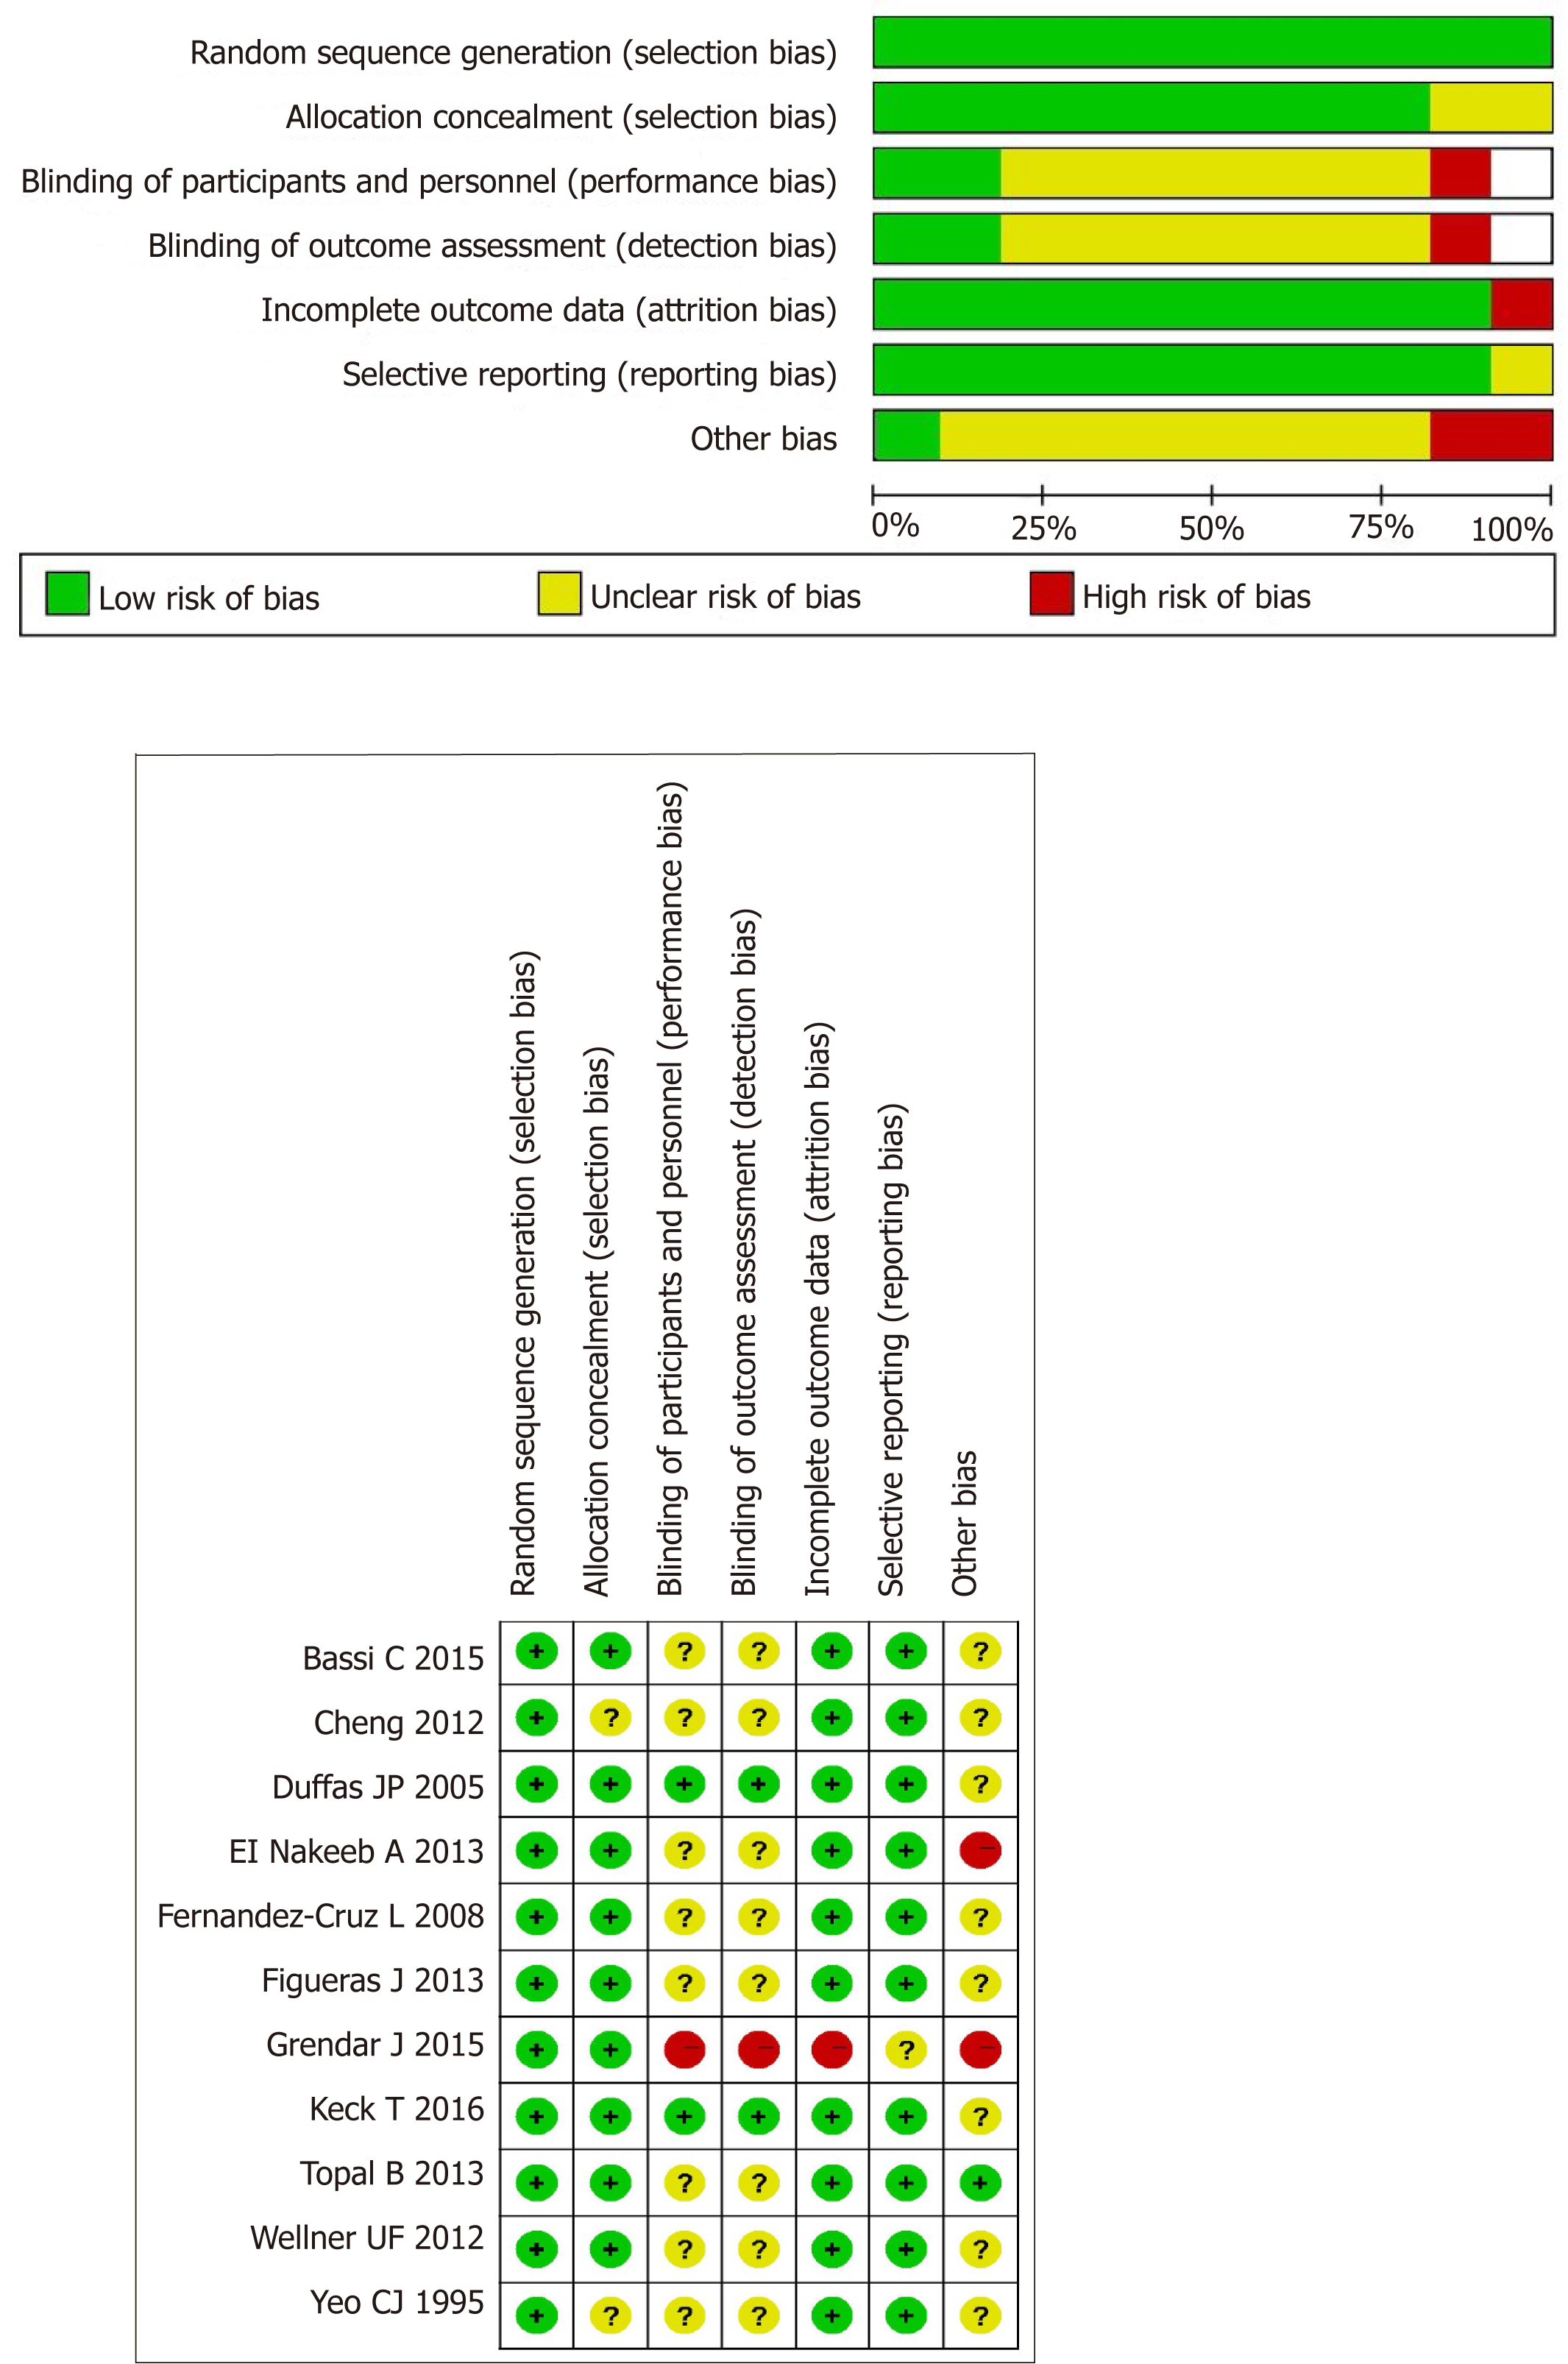
Figure 2 Quality of the included trials.
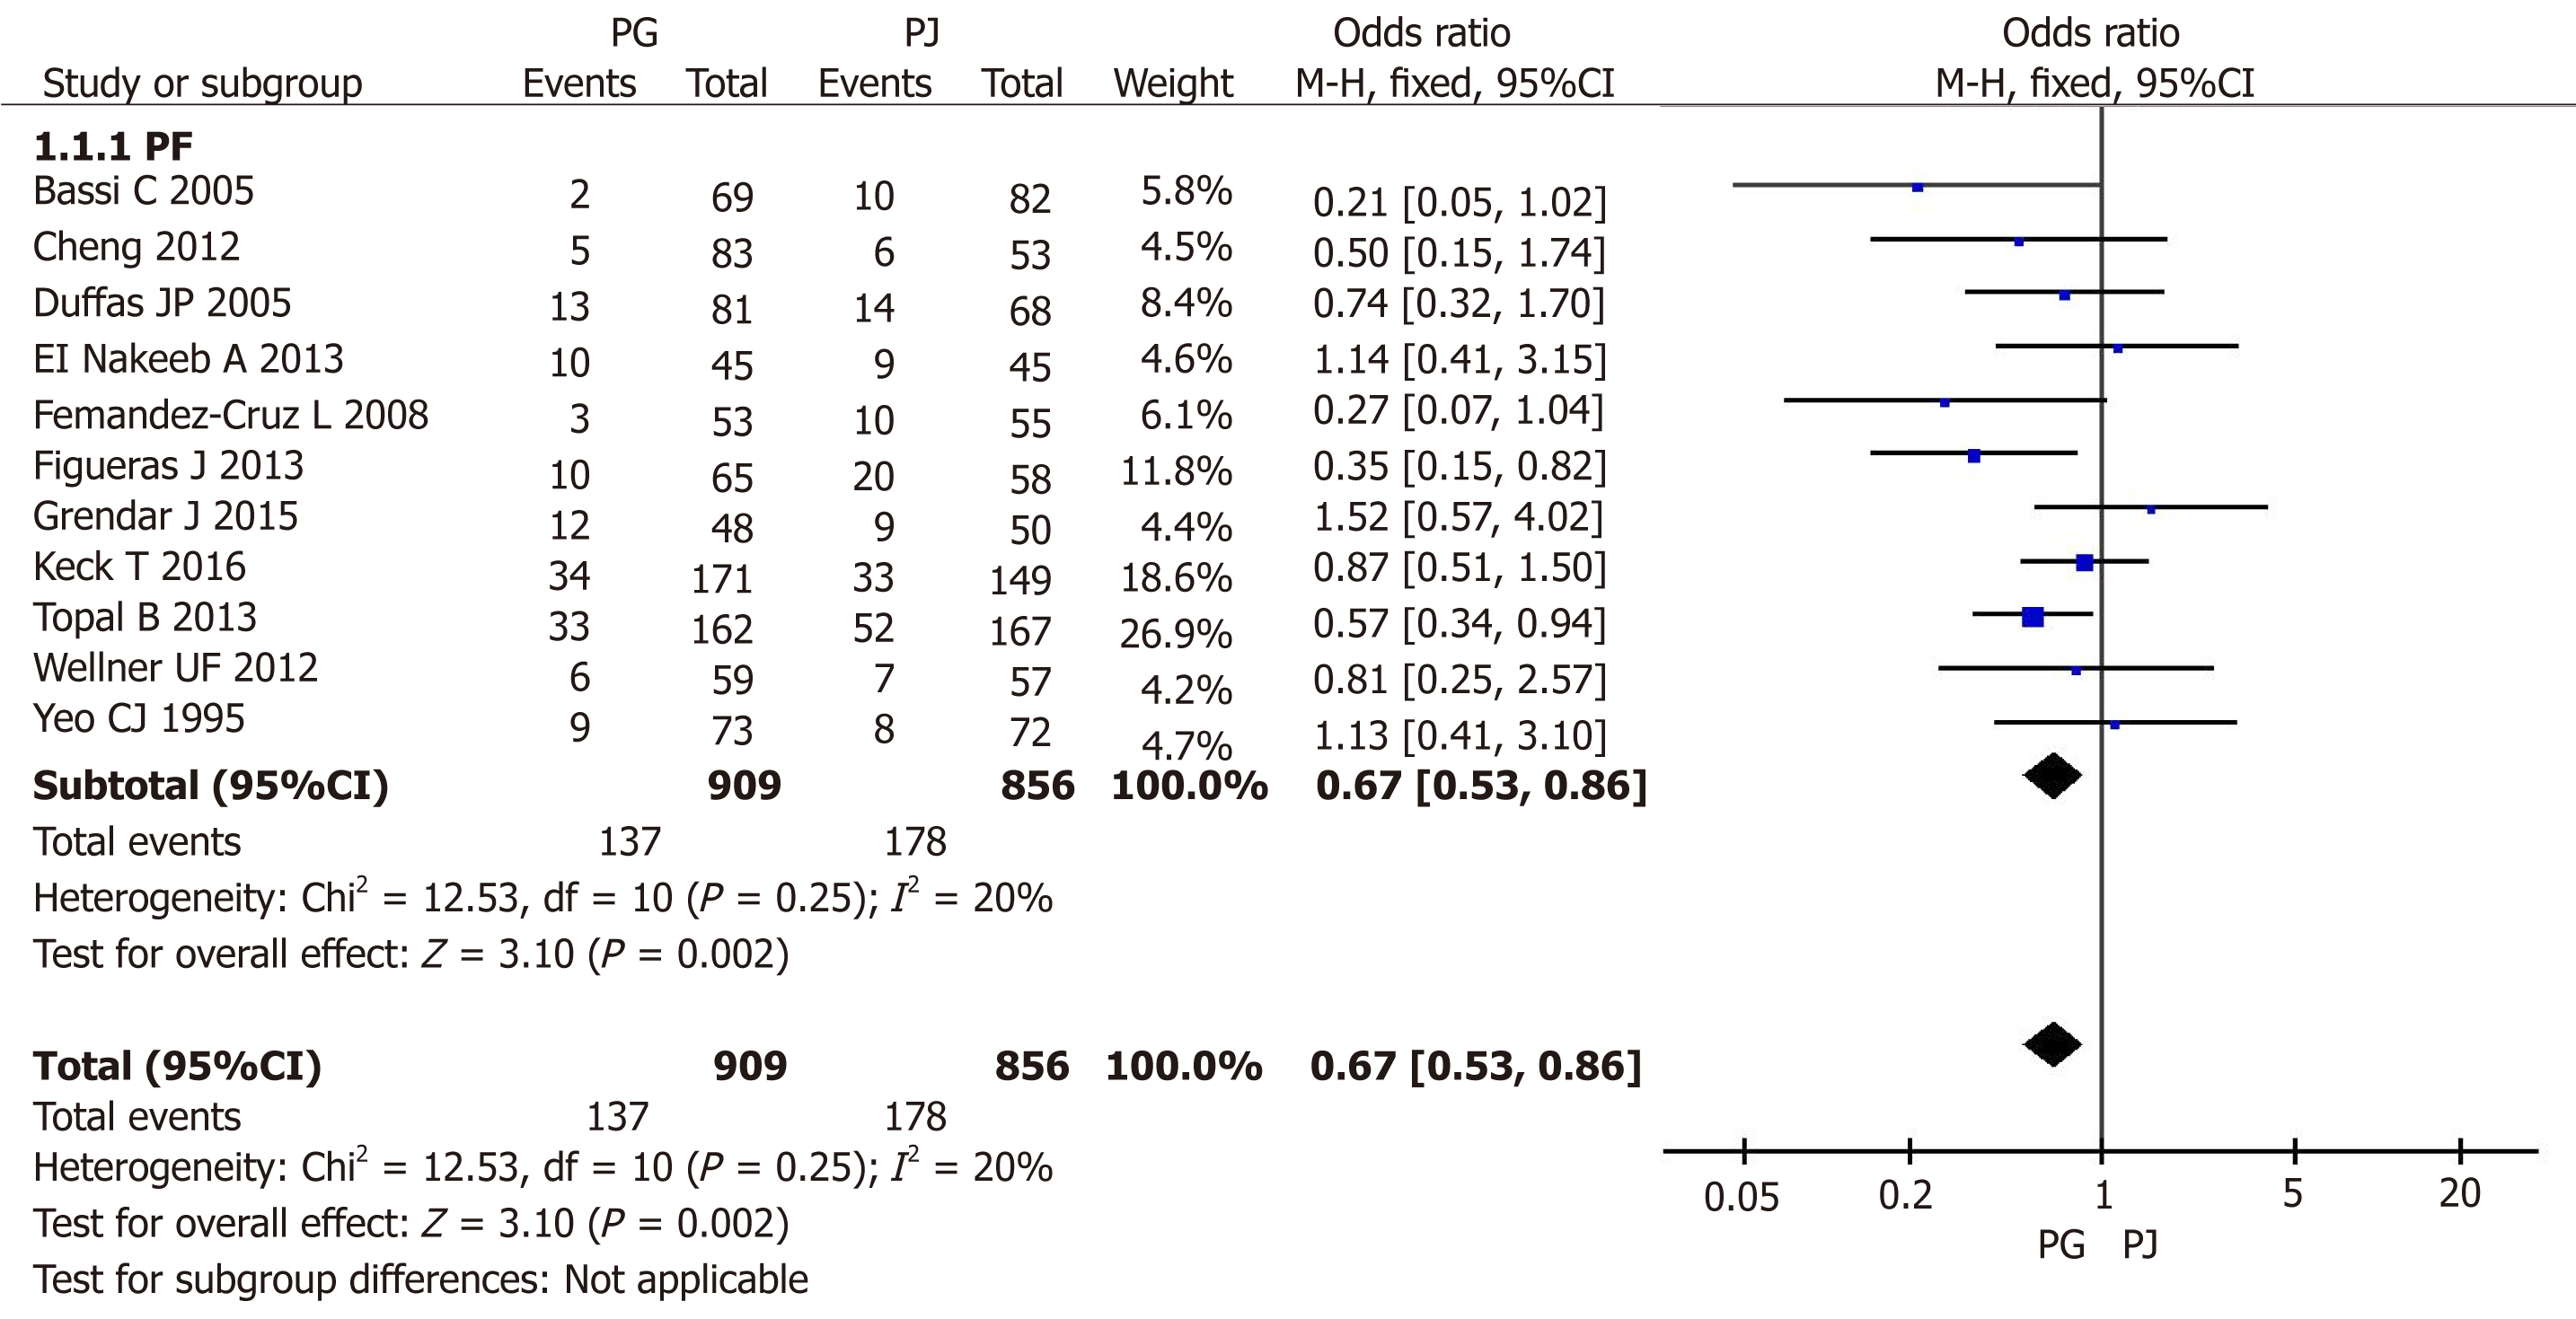
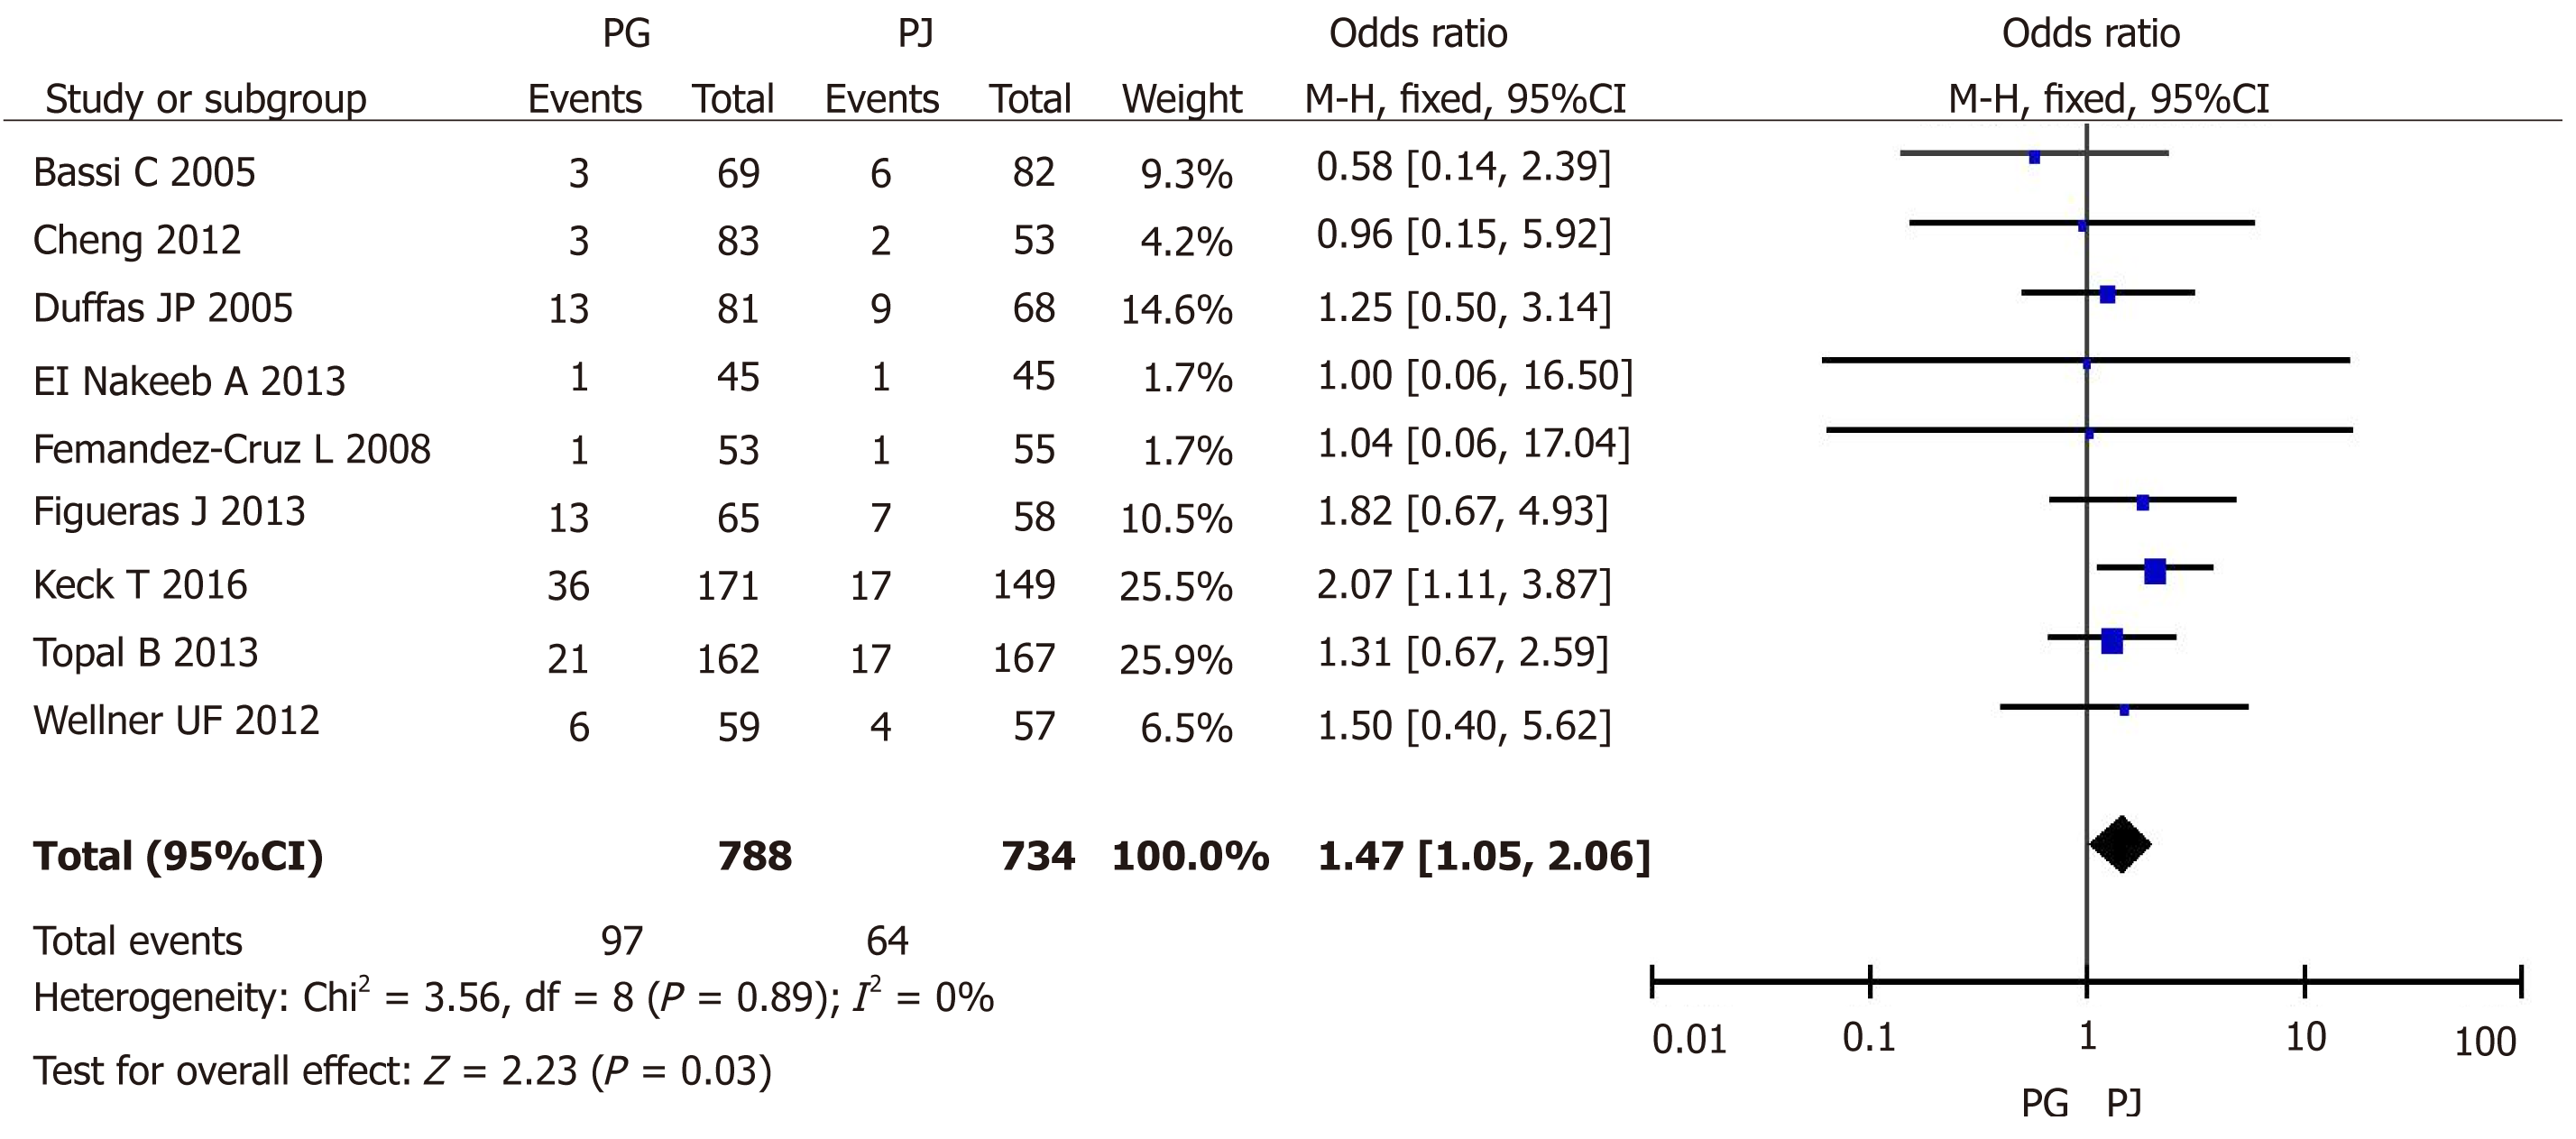
Figure 3 Forest plot of the incidence of all grades of postoperative pancreatic fistula.
PG: Pancreaticogastrostomy; PJ: Pancreaticojejunostomy; PF: Postoperative pancreatic fistula.
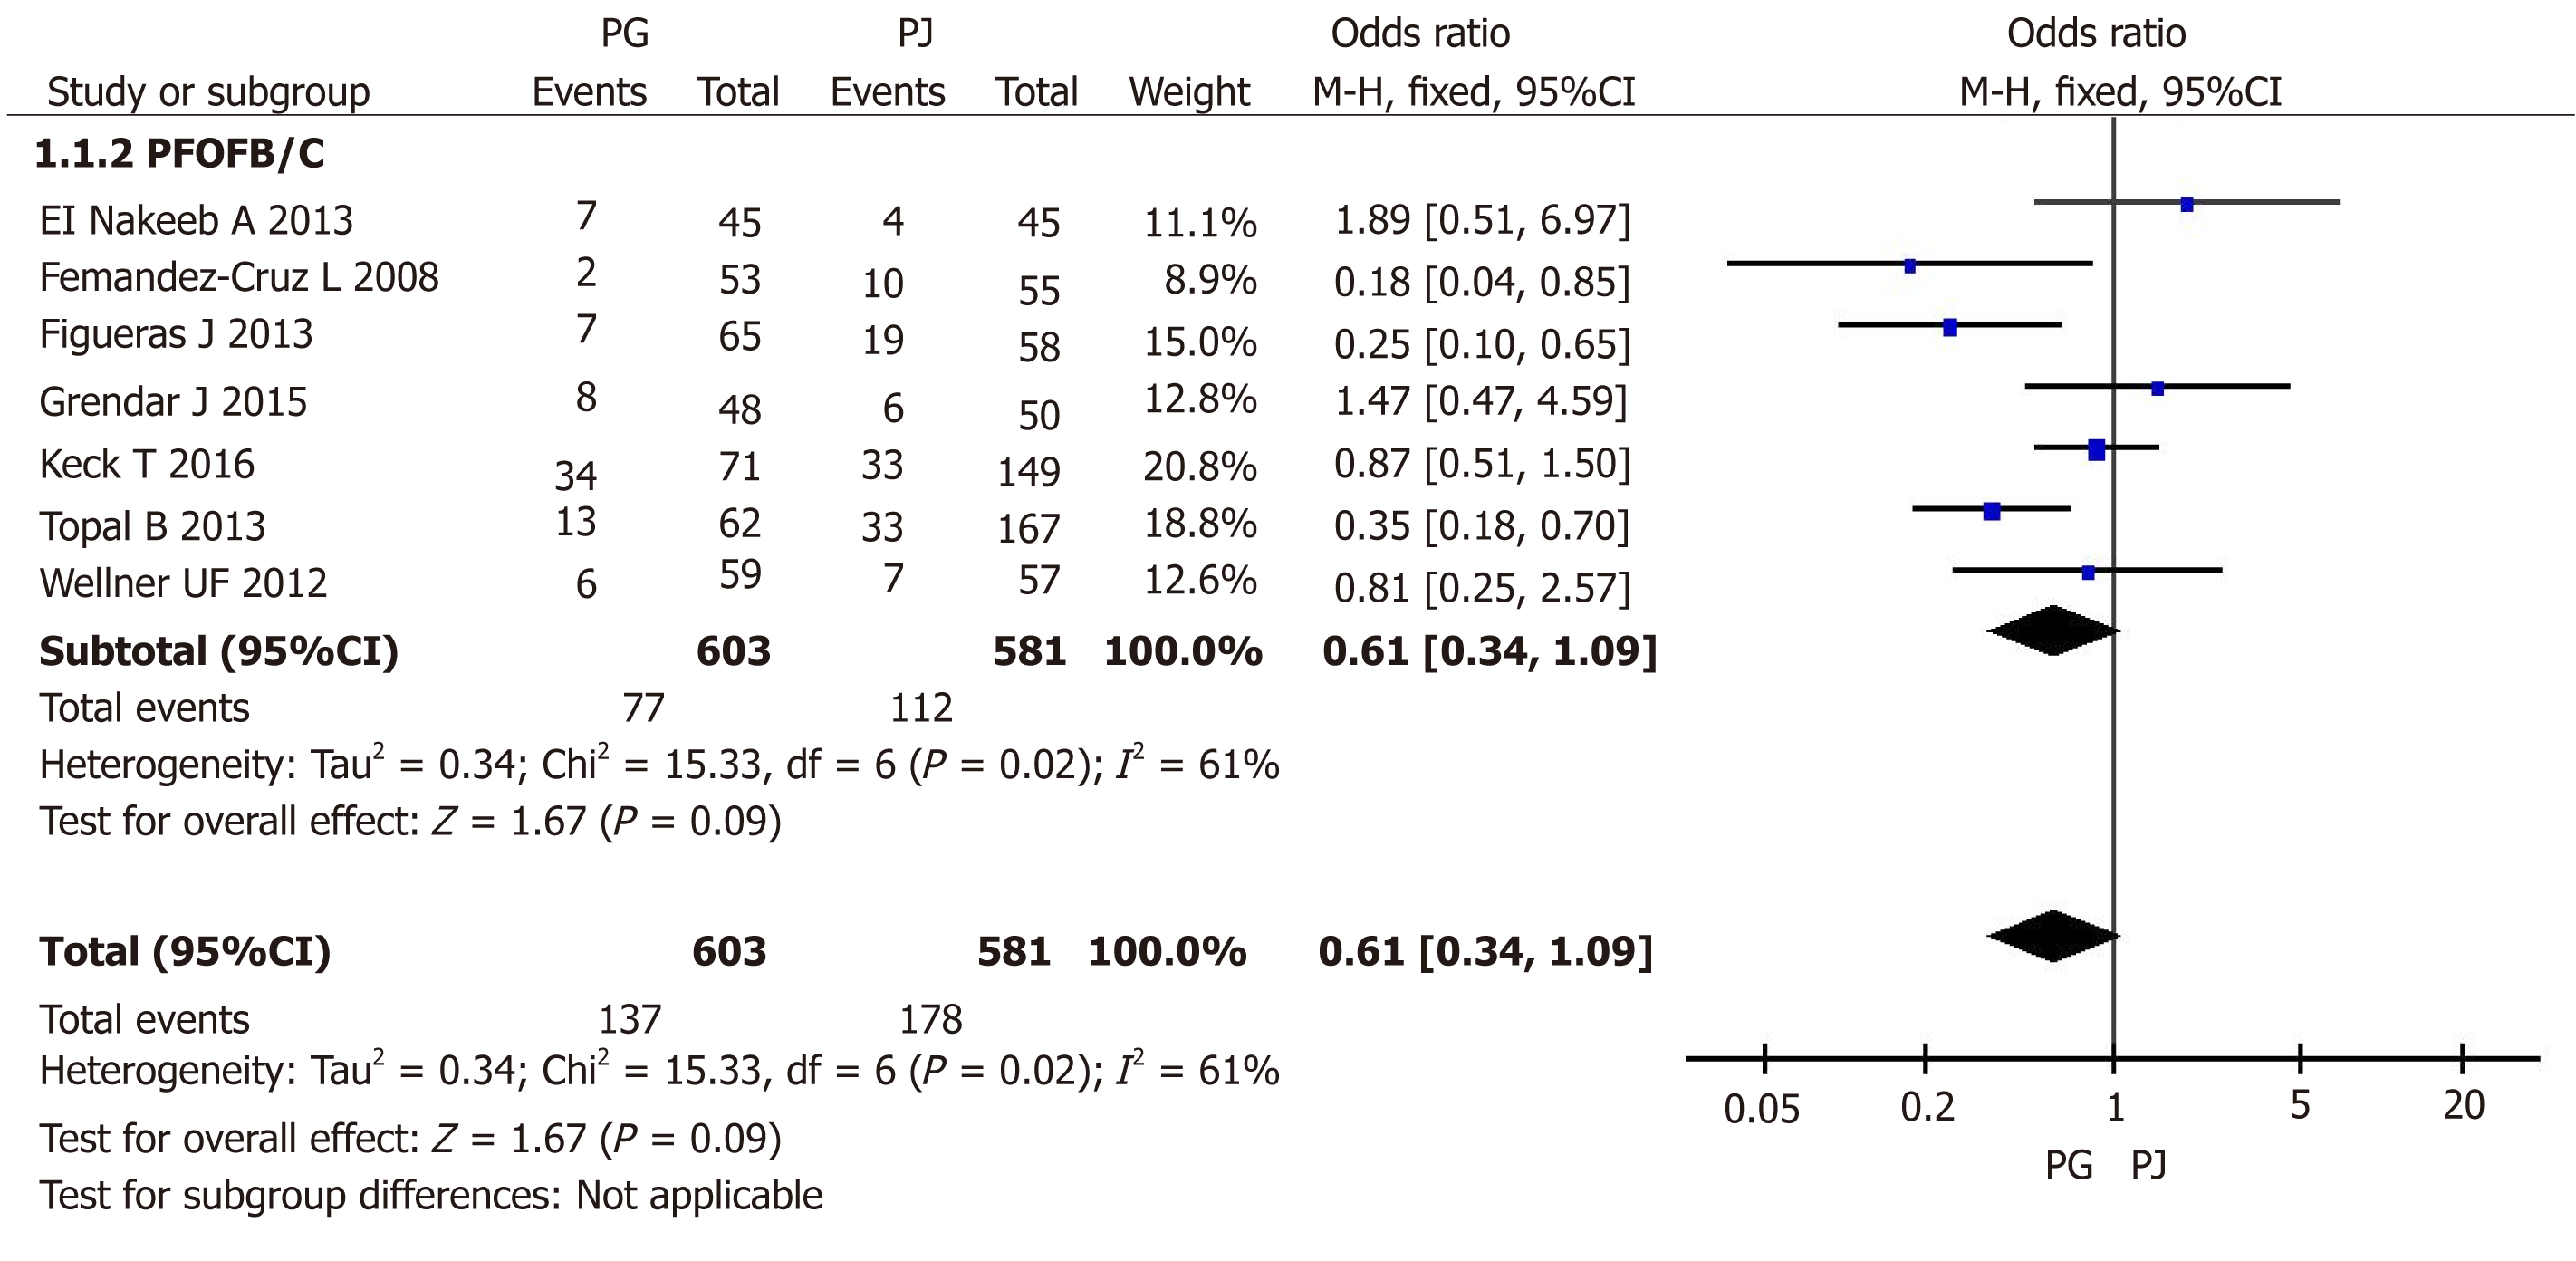
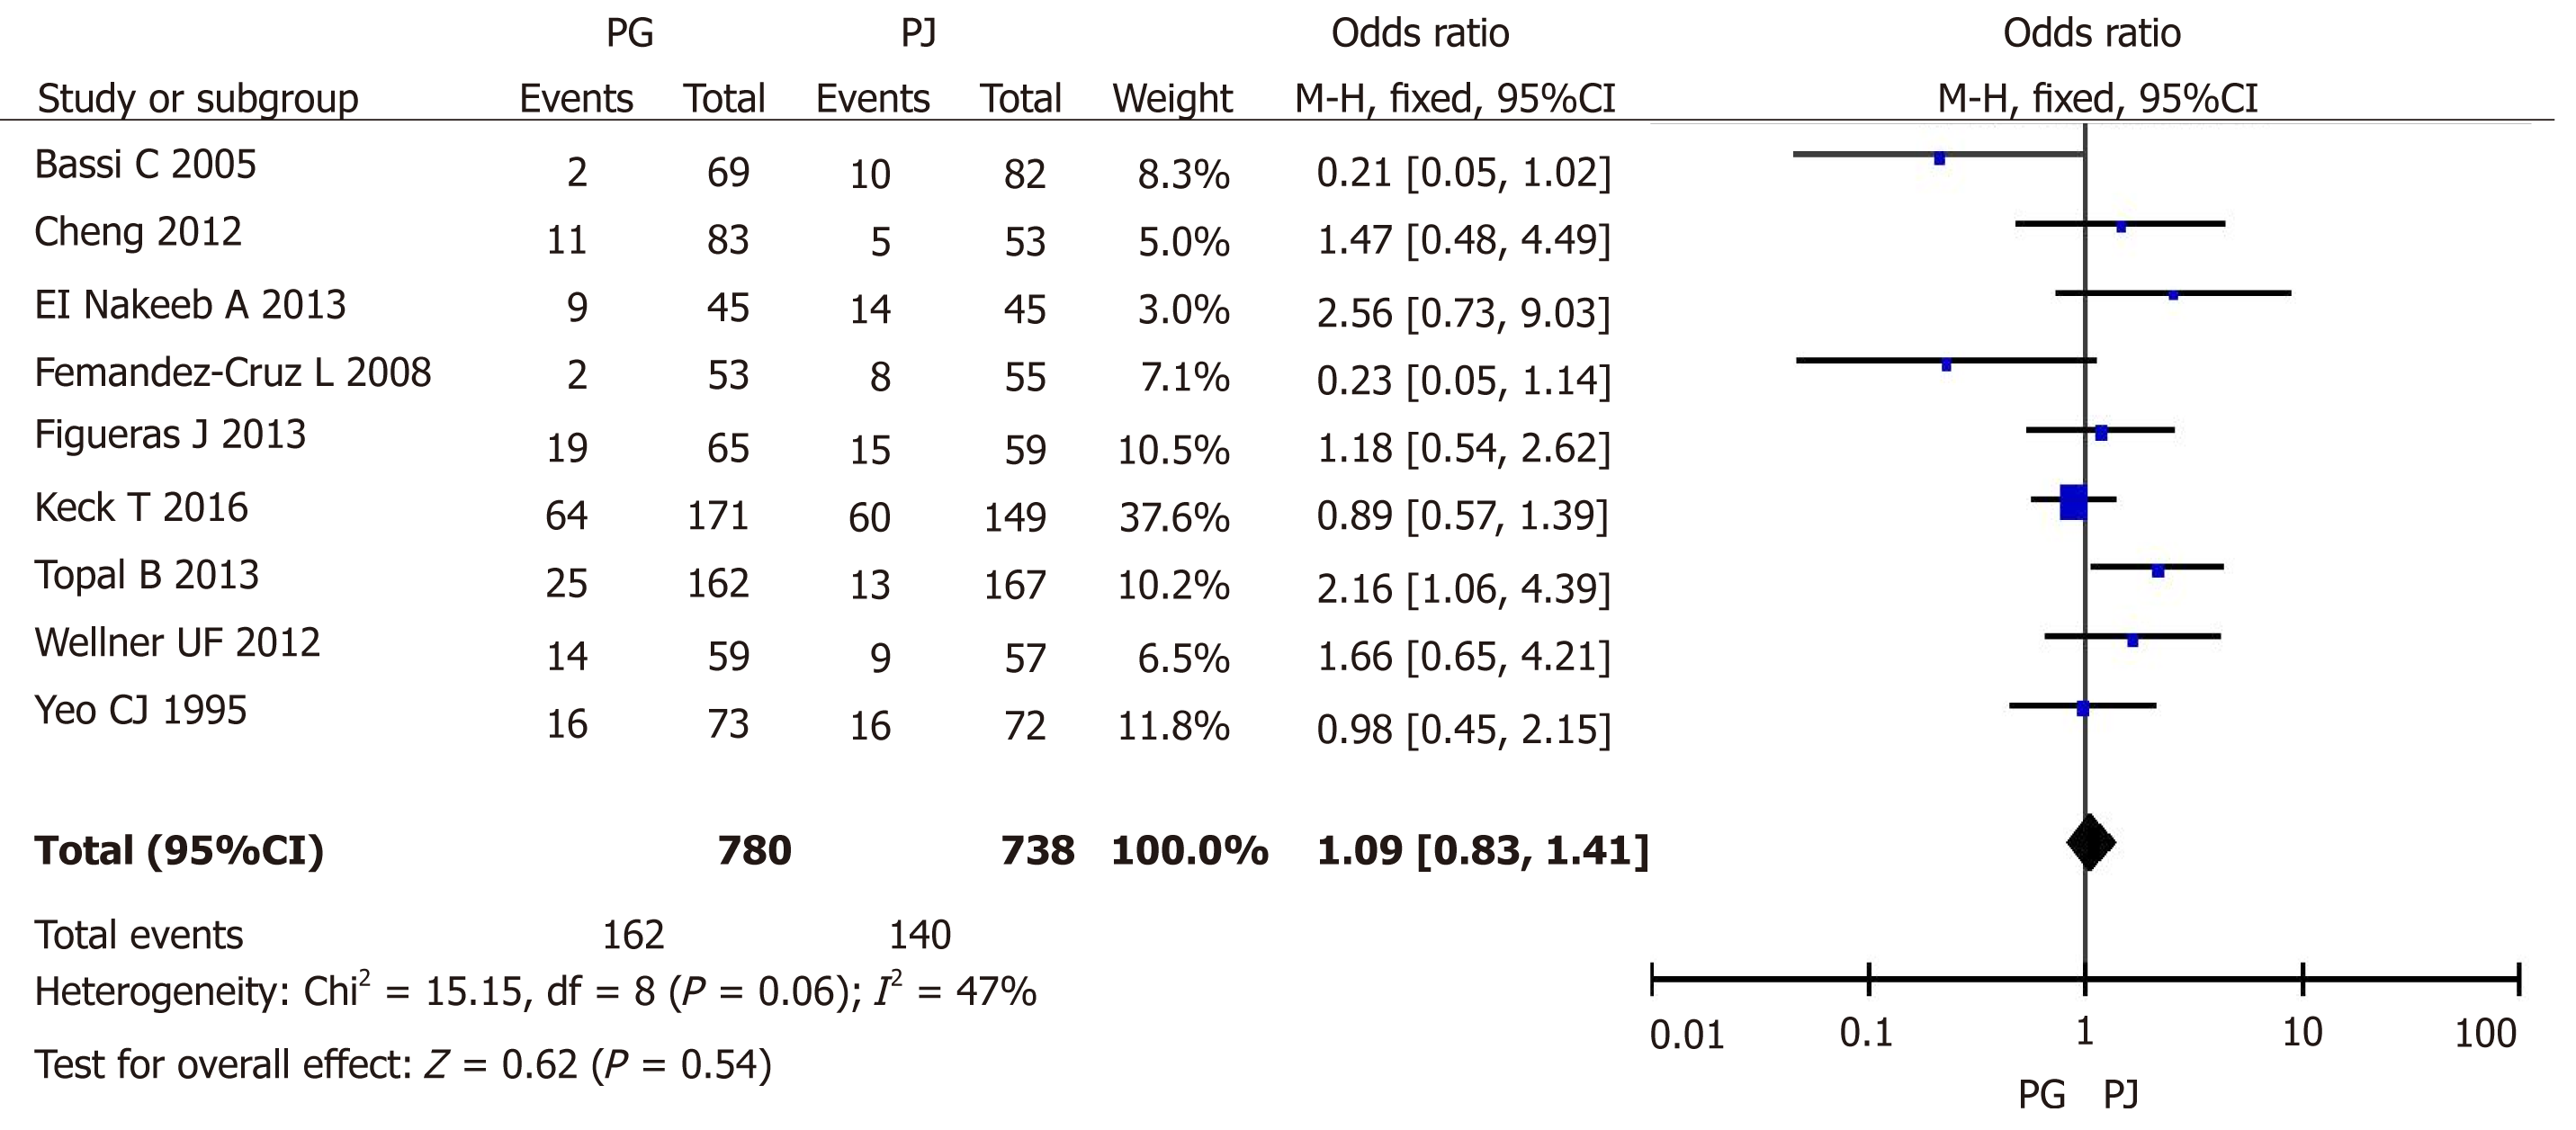
Figure 4 Forest plot of the incidence of grade B/C postoperative pancreatic fistula.
PG: Pancreaticogastrostomy; PJ: Pancreaticojejunostomy; PF: Postoperative pancreatic fistula.
Figure 5 Forest plot of the incidence of postoperative hemorrhage.
PG: Pancreaticogastrostomy; PJ: Pancreaticojejunostomy.
Figure 6 Forest plot of the incidence of delayed gastric emptying.
PG: Pancreaticogastrostomy; PJ: Pancreaticojejunostomy; PF: Postoperative pancreatic fistula.
- Citation: Jin Y, Feng YY, Qi XG, Hao G, Yu YQ, Li JT, Peng SY. Pancreatogastrostomy vs pancreatojejunostomy after pancreaticoduodenectomy: An updated meta-analysis of RCTs and our experience. World J Gastrointest Surg 2019; 11(7): 322-332
- URL: https://www.wjgnet.com/1948-9366/full/v11/i7/322.htm
- DOI: https://dx.doi.org/10.4240/wjgs.v11.i7.322


