Copyright
©The Author(s) 2019.
World J Gastrointest Surg. May 27, 2019; 11(5): 247-260
Published online May 27, 2019. doi: 10.4240/wjgs.v11.i5.247
Published online May 27, 2019. doi: 10.4240/wjgs.v11.i5.247
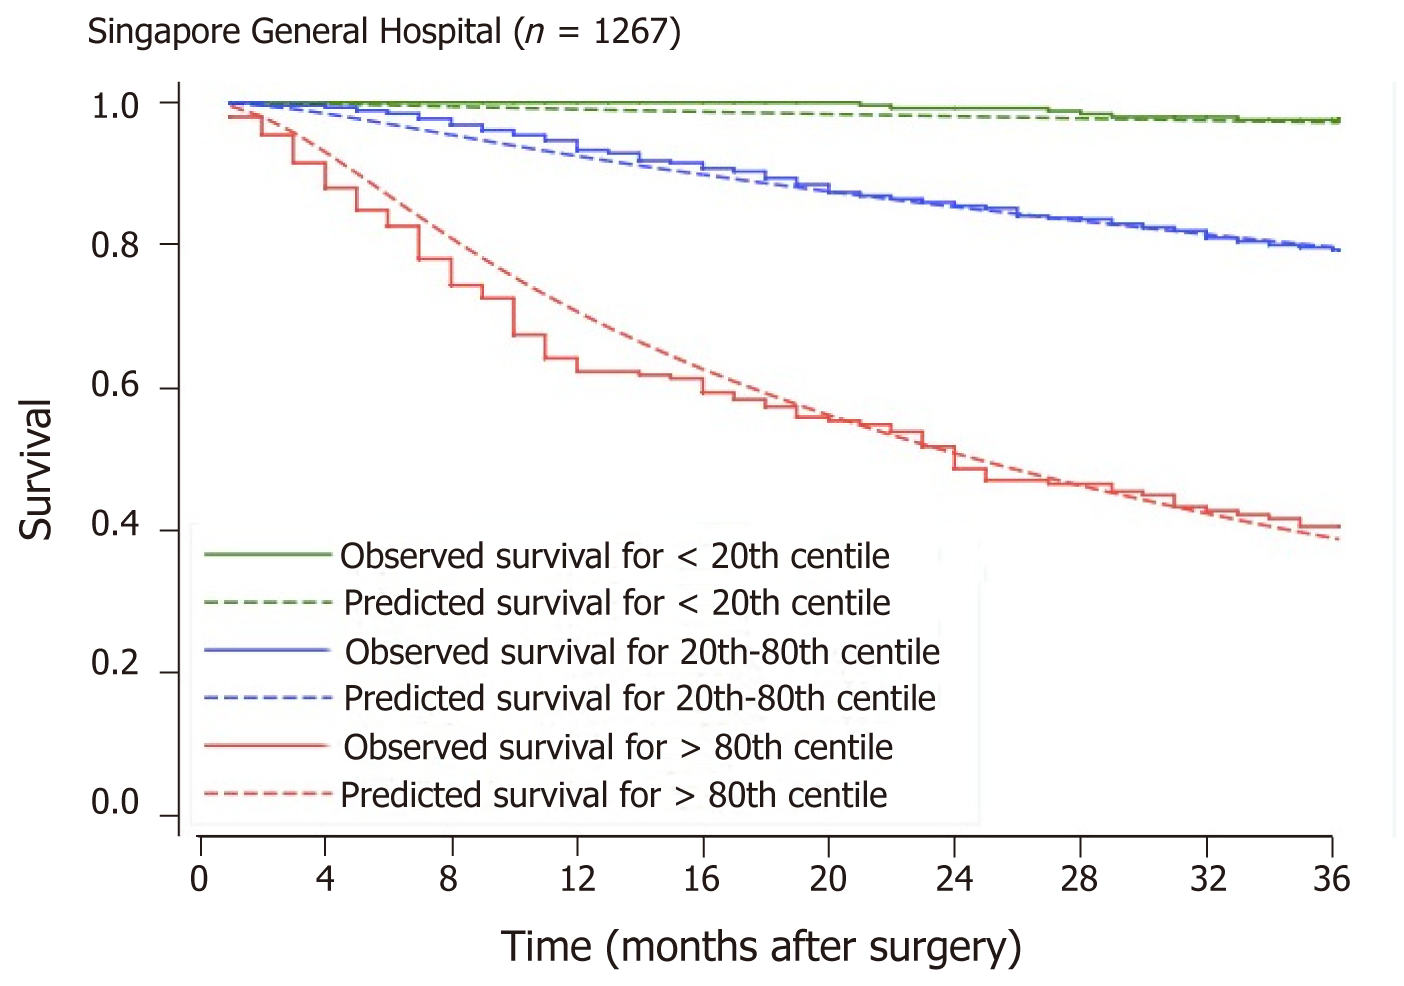
Figure 1 Observed survival probabilities of patients in the three risk score categories compared against model-based predicted probabilities for each group.
P value < 0.001 for separation of Kaplan-Meier survival curves (solid lines).
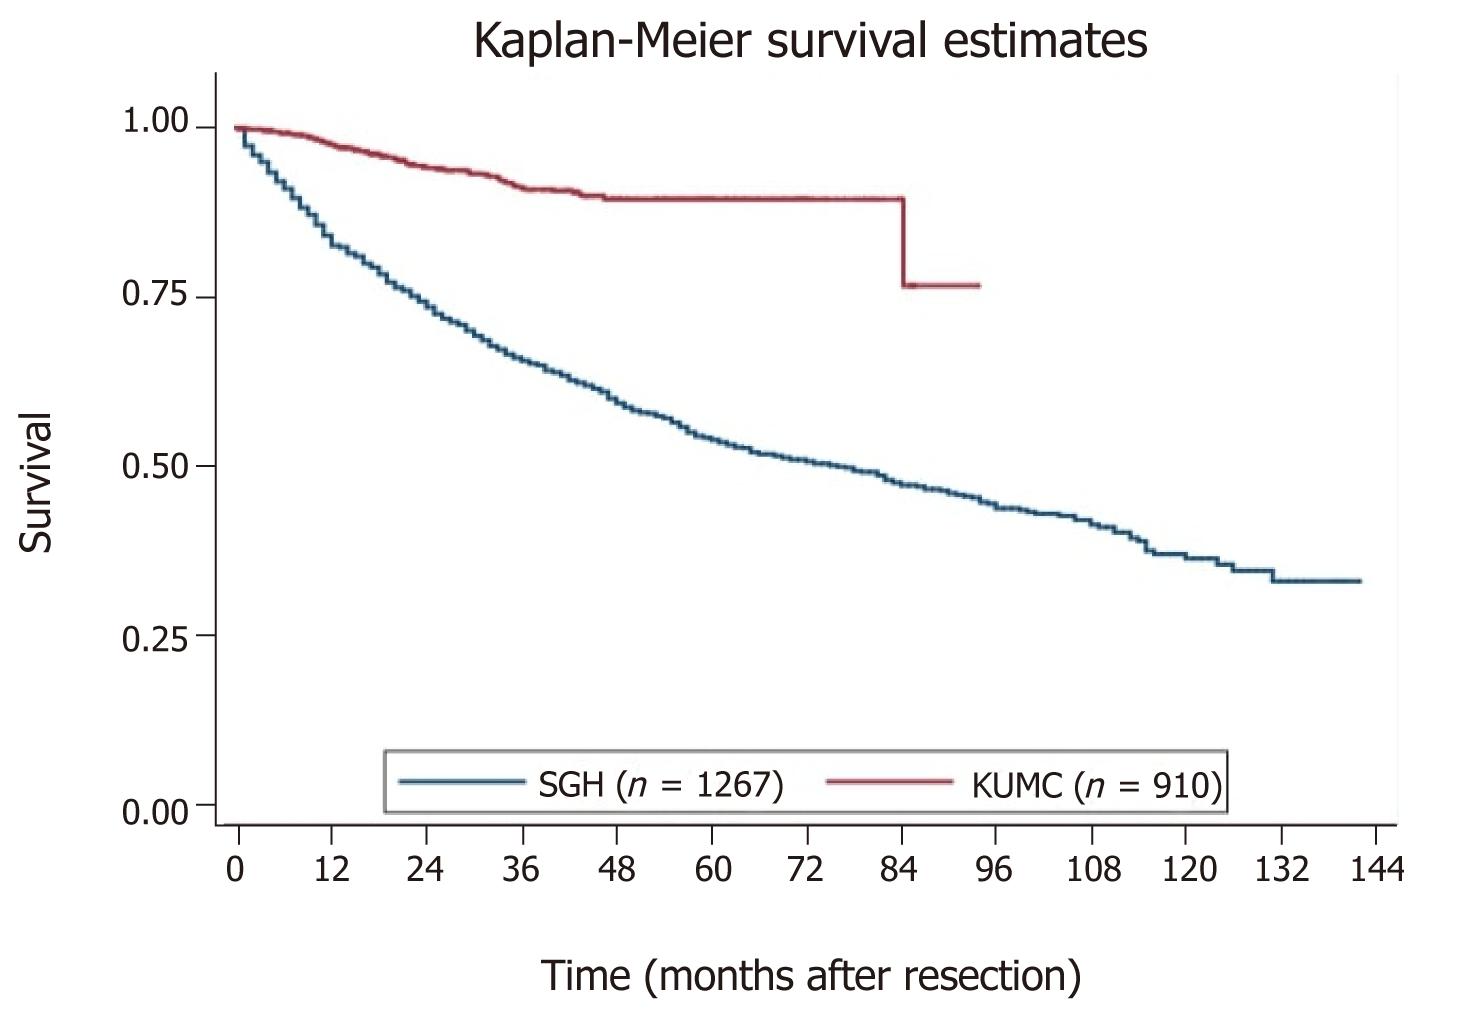
Figure 2 Kaplan-Meier overall survival curves of the 2 cohorts.
SGH: Singapore General Hospital; KNUCH: Kyungpook National University Chilgok Hospital.
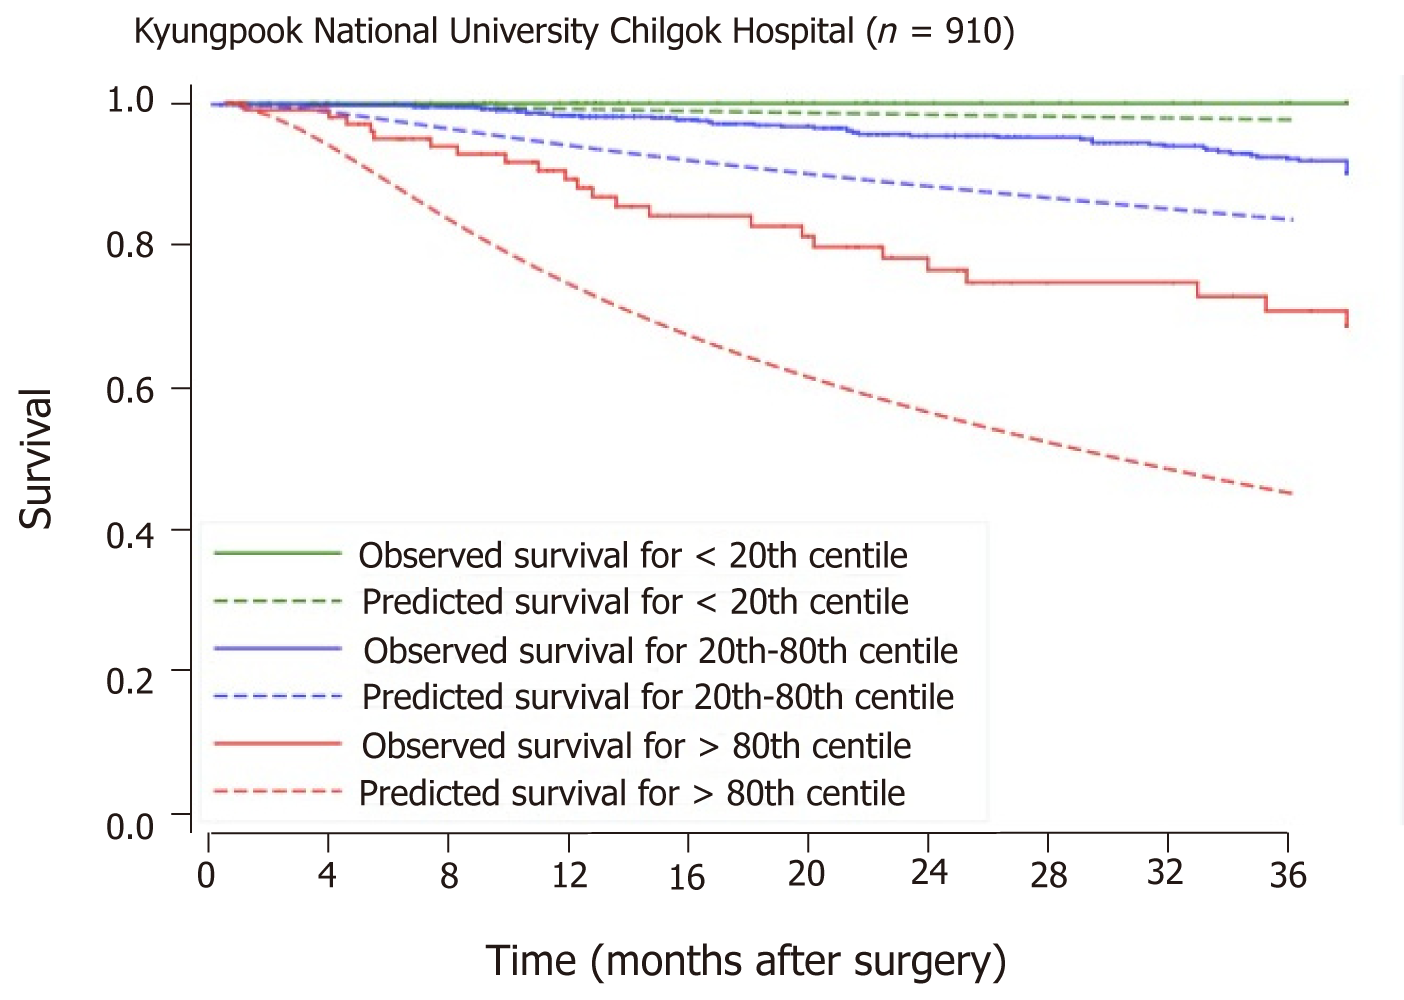
Figure 3 Observed survival probabilities of patients in the three risk score categories of the validation cohort compared against model-based predicted probabilities for each risk categories.
P value < 0.001 for separation of Kaplan-Meier survival curves (solid lines).
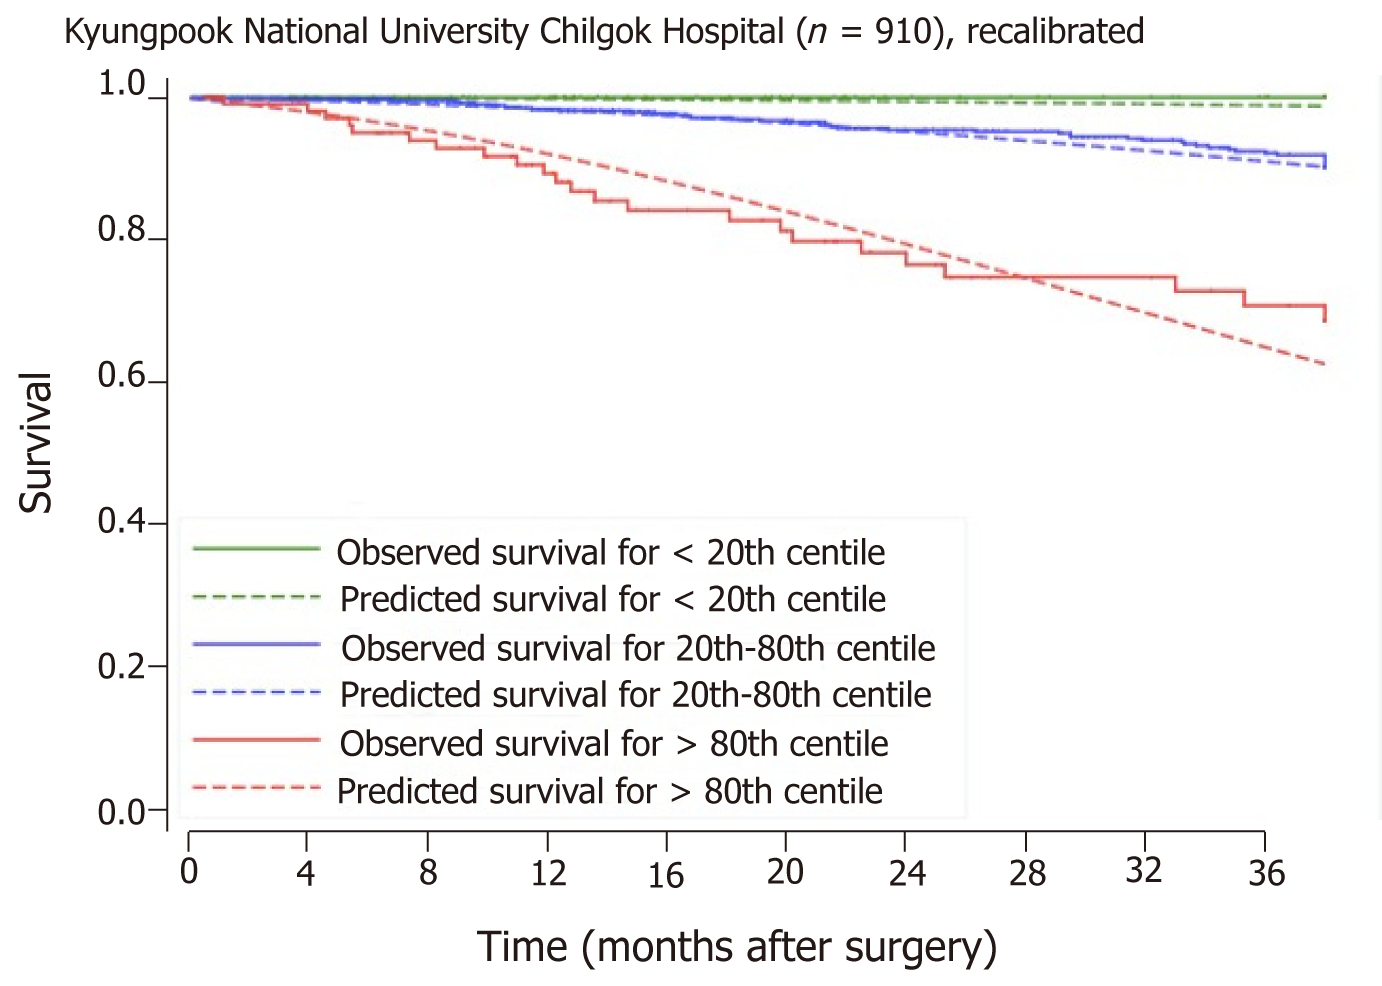
Figure 4 Recalibrated model applied to the Korean cohort.
P value < 0.001 for separation of Kaplan-Meier survival curves (solid lines).
- Citation: Seow-En I, Tan WJ, Dorajoo SR, Soh SHL, Law YC, Park SY, Choi GS, Tan WS, Tang CL, Chew MH. Prediction of overall survival following colorectal cancer surgery in elderly patients. World J Gastrointest Surg 2019; 11(5): 247-260
- URL: https://www.wjgnet.com/1948-9366/full/v11/i5/247.htm
- DOI: https://dx.doi.org/10.4240/wjgs.v11.i5.247


