Published online May 15, 2025. doi: 10.4239/wjd.v16.i5.99473
Revised: January 21, 2025
Accepted: March 13, 2025
Published online: May 15, 2025
Processing time: 275 Days and 19.4 Hours
Diabetic retinopathy (DR) is the leading cause of vision loss in patients with diabetes. The vascular endothelial growth factor (VEGF) pathway plays a critical role in the pathogenesis of DR, and ranibizumab, an anti-VEGF agent, has shown promise in its treatment. Signal transducer and activator of transcription 3 (STAT3) is involved in inflammatory processes and cellular signaling, while glial fibrillary acidic protein (GFAP) is a marker of glial cell activation, both con
To investigate the role of ranibizumab in early DR via the VEGF/STAT3/GFAP pathway.
Adult retinal pigment epithelial 19 (ARPE-19) cells and human retinal mi
High-glucose conditions significantly increased the mRNA and protein levels of VEGF, STAT3, GFAP, and other cytokines in ARPE-19 and HRMECs. However, these levels were partially suppressed by ranibizumab. RGC apoptosis, vascular leakage, and elevated cytokine expression were observed during early-stage DR in diabetic rats. Ranibizumab treatment in diabetic rats reduced cytokine expression, restored RGCs, and repaired vascular networks.
Intravitreal ranibizumab modulates the VEGF/STAT3/GFAP pathway, suppresses cytokine expression, and promotes retinal repair, effectively delaying or preventing early DR progression.
Core Tip: Diabetic retinopathy (DR) is the leading cause of vision loss in patients with diabetes; however, the mechanisms behind its early stages remain unclear. This study explored the therapeutic effects of intravitreal ranibizumab on early DR through its effect on the vascular endothelial growth factor/STAT3/glial fibrillary acidic protein signaling pathway. Using high-glucose retinal cells and diabetic rat models, ranibizumab suppressed cytokine expression, reduced retinal ganglion cell apoptosis, and repaired vascular networks. These findings highlight the potential of ranibizumab in delaying or preventing early DR progression and provide a foundation for its clinical application.
- Citation: Lin YT, Tan J, Tao YL, Hu WW, Wang YC, Huang J, Zhou Q, Xiao A. Effect of ranibizumab on diabetic retinopathy via the vascular endothelial growth factor/STAT3/glial fibrillary acidic protein pathway. World J Diabetes 2025; 16(5): 99473
- URL: https://www.wjgnet.com/1948-9358/full/v16/i5/99473.htm
- DOI: https://dx.doi.org/10.4239/wjd.v16.i5.99473
Diabetic retinopathy (DR) is a microvascular complication of diabetes mellitus (DM) and a leading cause of global vision loss. It is characterized by retinal microvascular abnormalities, including increased vascular permeability, microaneurysms, and capillary occlusion. In severe cases, DR can progress to include retinal neovascularization and detachment. Depending on the severity of its clinical signs and symptoms, DR can be classified as non-proliferative and proliferative.
A 2024 Lancet Global Research report estimated the global prevalence of diabetes at 14%, affecting approximately 828 million people worldwide. Urbanization, aging, reduced physical activity, and increasing rates of overweight and obesity have been identified as the driving factors behind this trend[1]. DR is currently a leading cause of vision loss among adults in some developed countries[2]. As such, it has become an important public health concern[3].
Patients with DR are treated based on the type of retinal lesions they manifest. These retinal lesions may include retinal microaneurysms, macular edema, and neovascularization, for which retinal laser photocoagulation, intravitreal drug injection, and vitrectomy may be performed. Systemic control of blood glucose, blood pressure, and blood lipid levels, as well as close monitoring of at-risk conditions, such as pregnancy and obesity, are also recommended[4]. The retinal changes in DR are typically irreversible. As such, it is important to implement effective interventions before the development of DR to reduce the overall risk for blindness.
Animal and human studies have shown that inflammatory cytokines and angiogenic factors are markedly involved in the pathogenesis of DR. Animal and human studies have shown that inflammatory cytokines and angiogenic factors are markedly involved in the pathogenesis of DR[2]. During early diabetes, the retina expresses elevated concentrations of proinflammatory mediators, such as tumor necrosis factor alpha (TNF-α), vascular endothelial growth factor (VEGF), intercellular adhesion molecule (ICAM), cluster of differentiation 18 (CD18), and interleukin 6 (IL-6)[5]. These mediators can initiate complex inflammatory processes that can structurally and functionally damage diabetic retinas[6]. Signal transducer and activator of transcription 3 (STAT3) is a member of the Janus kinase/STAT signaling pathway that regulates cell cytokine signaling. In endothelial cells, the inflammatory effects of STAT3 are largely attributed to the induction of ICAM-1 and VEGF[7]. STAT3 participates in inflammation and VEGF-induced angiogenesis, leading to increased endothelial cell permeability and vascular leakage in early DR[8,9]. Retinal pericytes function as early inflammatory sensors in DR by modulating inflammation in the retinal microenvironment via the Hes family BHLH tra
Previous studies have shown that diabetic rats express significantly higher levels of vitreal VEGF at 8 days after induction of high-glucose states and peak by the fourth week. The control groups in these studies had significantly lower expression of vitreal VEGF[15,16]. VEGF overexpression increases vascular permeability, which promotes neovascularization and retinal structural and functional abnormalities[17]. Our previous study[18] showed that intravitreal ranibizumab delayed DR progression at a very early stage in streptozotocin-induced diabetic rats.
This study explored the best approach for targeted ranibizumab treatment and the mechanisms underlying its effect on the development and progression of early-stage DR.
Adult retinal pigment epithelial 19 (ARPE-19) cells were purchased from Procell (Wuhan, Hubei Province, China), cultured in Dulbecco’s Modified Eagle Medium containing 5.5 mmol/L glucose (Procell), and supplemented with 10% fetal bovine serum (HyClone, Logan, UT, United States) and 1% penicillin/streptomycin (Thermo Fisher Scientific, Wuhan, China) in a humidified atmosphere with 50 mL/L carbon dioxide at 37 °C. Human retinal microvascular endothelial cells (HRMECs) and primary human retinal endothelial cells were purchased from ScienCell (Carlsbad, CA, United States) and cultured in a low-glucose (5.5 mmol/L) primary endothelial cell culture medium (ScienCell, Wuhan, Hubei Province, China) in a humidified atmosphere containing 50 mL/L carbon dioxide at 37 °C. The high-glucose model utilized the same parameters, but the glucose concentration in the culture medium was adjusted to 25 mmol/L for 72 hours prior to the experiment.
The Cell Counting Kit-8 (CCK-8) assay was used to assess the viability of ARPE-19 cells and HRMECs. The cells were seeded at a density of 3 × 10³/cm2 in 100 μL culture medium in 96-well plates. After overnight incubation at 37 °C, the cells were treated with various concentrations of ranibizumab (Novartis, Zurich, Switzerland): 0.0625 mg/mL, 0.125 mg/mL, and 0.25 mg/mL for 12 hours, 24 hours, and 48 hours. Following treatment, 10 μL CCK-8 solution was added to each well, and the plates were incubated for an additional 1 hour. Optical densities were measured at 490 nm using a microplate reader (Thermo Fisher Scientific).
A total of 75 male Sprague-Dawley (SD) rats, 8-9 weeks old and weighing 280 ± 20 g, were purchased from the Animal Center of Nanchang University (Nanchang, Jiangxi Province, China). The rats were housed under controlled conditions: Temperature 23 ± 2 °C, relative humidity 50%, and a 12-hour light/dark cycle. They had ad libitum access to sterilized standard laboratory chow and water. All procedures followed the principles of animal ethics. The rats were anesthetized with an intraperitoneal injection of pentobarbital sodium (40 mg/kg body weight; Sigma-Aldrich, Merck Millipore, Darmstadt, Germany) prior to experimentation. All experiments complied with the guidelines of the Experimental Animal Ethical Committee for Traditional Chinese Medicine (Nanchang).
DM was induced in SD rats via a single intraperitoneal injection of streptozotocin (Sigma-Aldrich) at 60 mg/kg body weight. Rats with blood glucose levels ≥ 13.9 mmol/L (250 mg/dL) at 24 hours post-injection, which remained hyperglycemic for four consecutive days, were considered successfully induced diabetic models. A total of 100 diabetic rats were randomly divided into five groups (Groups A-E), while 20 healthy, untreated SD rats were included as a normal control group (Group F). Insulin was administered to maintain blood glucose levels within 2.80-7.56 mmol/L for groups requiring strict glycemic control.
Group A: Intravitreal injection of 1 μL ranibizumab[19] into the right eye on day 8 post-induction, combined with strict glycemic control.
Group B: Intravitreal injection of 1 μL ranibizumab on day 8 post-induction without glycemic control.
Group C: Strict glycemic control starting on day 8 post-induction without intravitreal injection.
Group D: No intravitreal injection or glycemic control.
Group E: Intravitreal injection of 1 μL sterile saline into the right eye on day 8 post-induction without glycemic control.
Group F: Healthy SD rats with no treatment, maintained under standard feeding condition.
All rats underwent fundus fluorescein angiography (FFA) and were sacrificed at weeks 6, 8, and 10 post-induction for further analyses.
FFA is a common and primary assessment for DR. The right eyes of the rats in each group were examined using FFA (Heidelberg Spectralis HRA, Heidelberg, Germany). Each rat was weighed and anesthetized with an intraperitoneal injection of sodium pentobarbital (40 mg/kg). Compound tropicamide (Mydrin-POR; Santen, Osaka, Japan) was instilled for pupil dilation, followed by Alcaine for local anesthesia and methyl cellulose to maintain corneal moisture. During the FFA examination, the rats received an intraperitoneal injection of 10% sodium fluorescein (0.001 mL/g; International Medication Systems, Dunstable, United Kingdom) for rapid imaging.
The right eye of each rat was intravitreally injected with 1 μL ranibizumab under anesthesia. Ranibizumab was delivered into the center of the vitreous humor (0.5 mm posterior to the limbus) using a 5-μL microsyringe (Hamilton, Bonaduz, Switzerland). Eyes with evidence of lens or retinal injury were excluded from the analysis. Based on the blood glucose concentration of each SD rat, 2-6 units of isophane protamine biosynthetic human insulin (pre-mixed 30R; Novonordisk, Tianjin, China) were administered subcutaneously. Glycemic levels were strictly controlled between 3.0 and 10.0 mmol/L (54-180 mg/dL).
To label all blood vessels, intravascular perfusion of fluorescent tomato (Lycopersicon esculentum) lectin was used. The anesthetized rats were intravenously injected with 100 μL fluorescein isothiocyanate-conjugated tomato lectin (1 mg/mL; Sigma-Aldrich). Tomato lectin binds uniformly to the luminal surface of endothelial cells and labels all blood vessels with adequate blood supply. At 15 minutes after the injection, the rats were perfused with stroke-physiological saline solution for 10 minutes through the left ventricle under anesthesia, at a pressure of 10.7-16.0 kPa (80-120 mmHg) for 5-10 minutes. The vitreous humor and retina were carefully isolated from the eyes under a 2.5 × anatomic microscope. The vitreous humor was isolated for VEGF-A enzyme-linked immunosorbent assay (ELISA) and the retina was isolated for hematoxylin and eosin (H&E) staining, periodic acid-Schiff (PAS) staining, fluorescence imaging, and proinflammatory protein expression assessments during the sixth, eighth, and tenth weeks after the induction of DM, respectively.
The isolated vitreous humor was homogenized in 185 μL sterile phosphate-buffered saline (PBS) after being frozen at
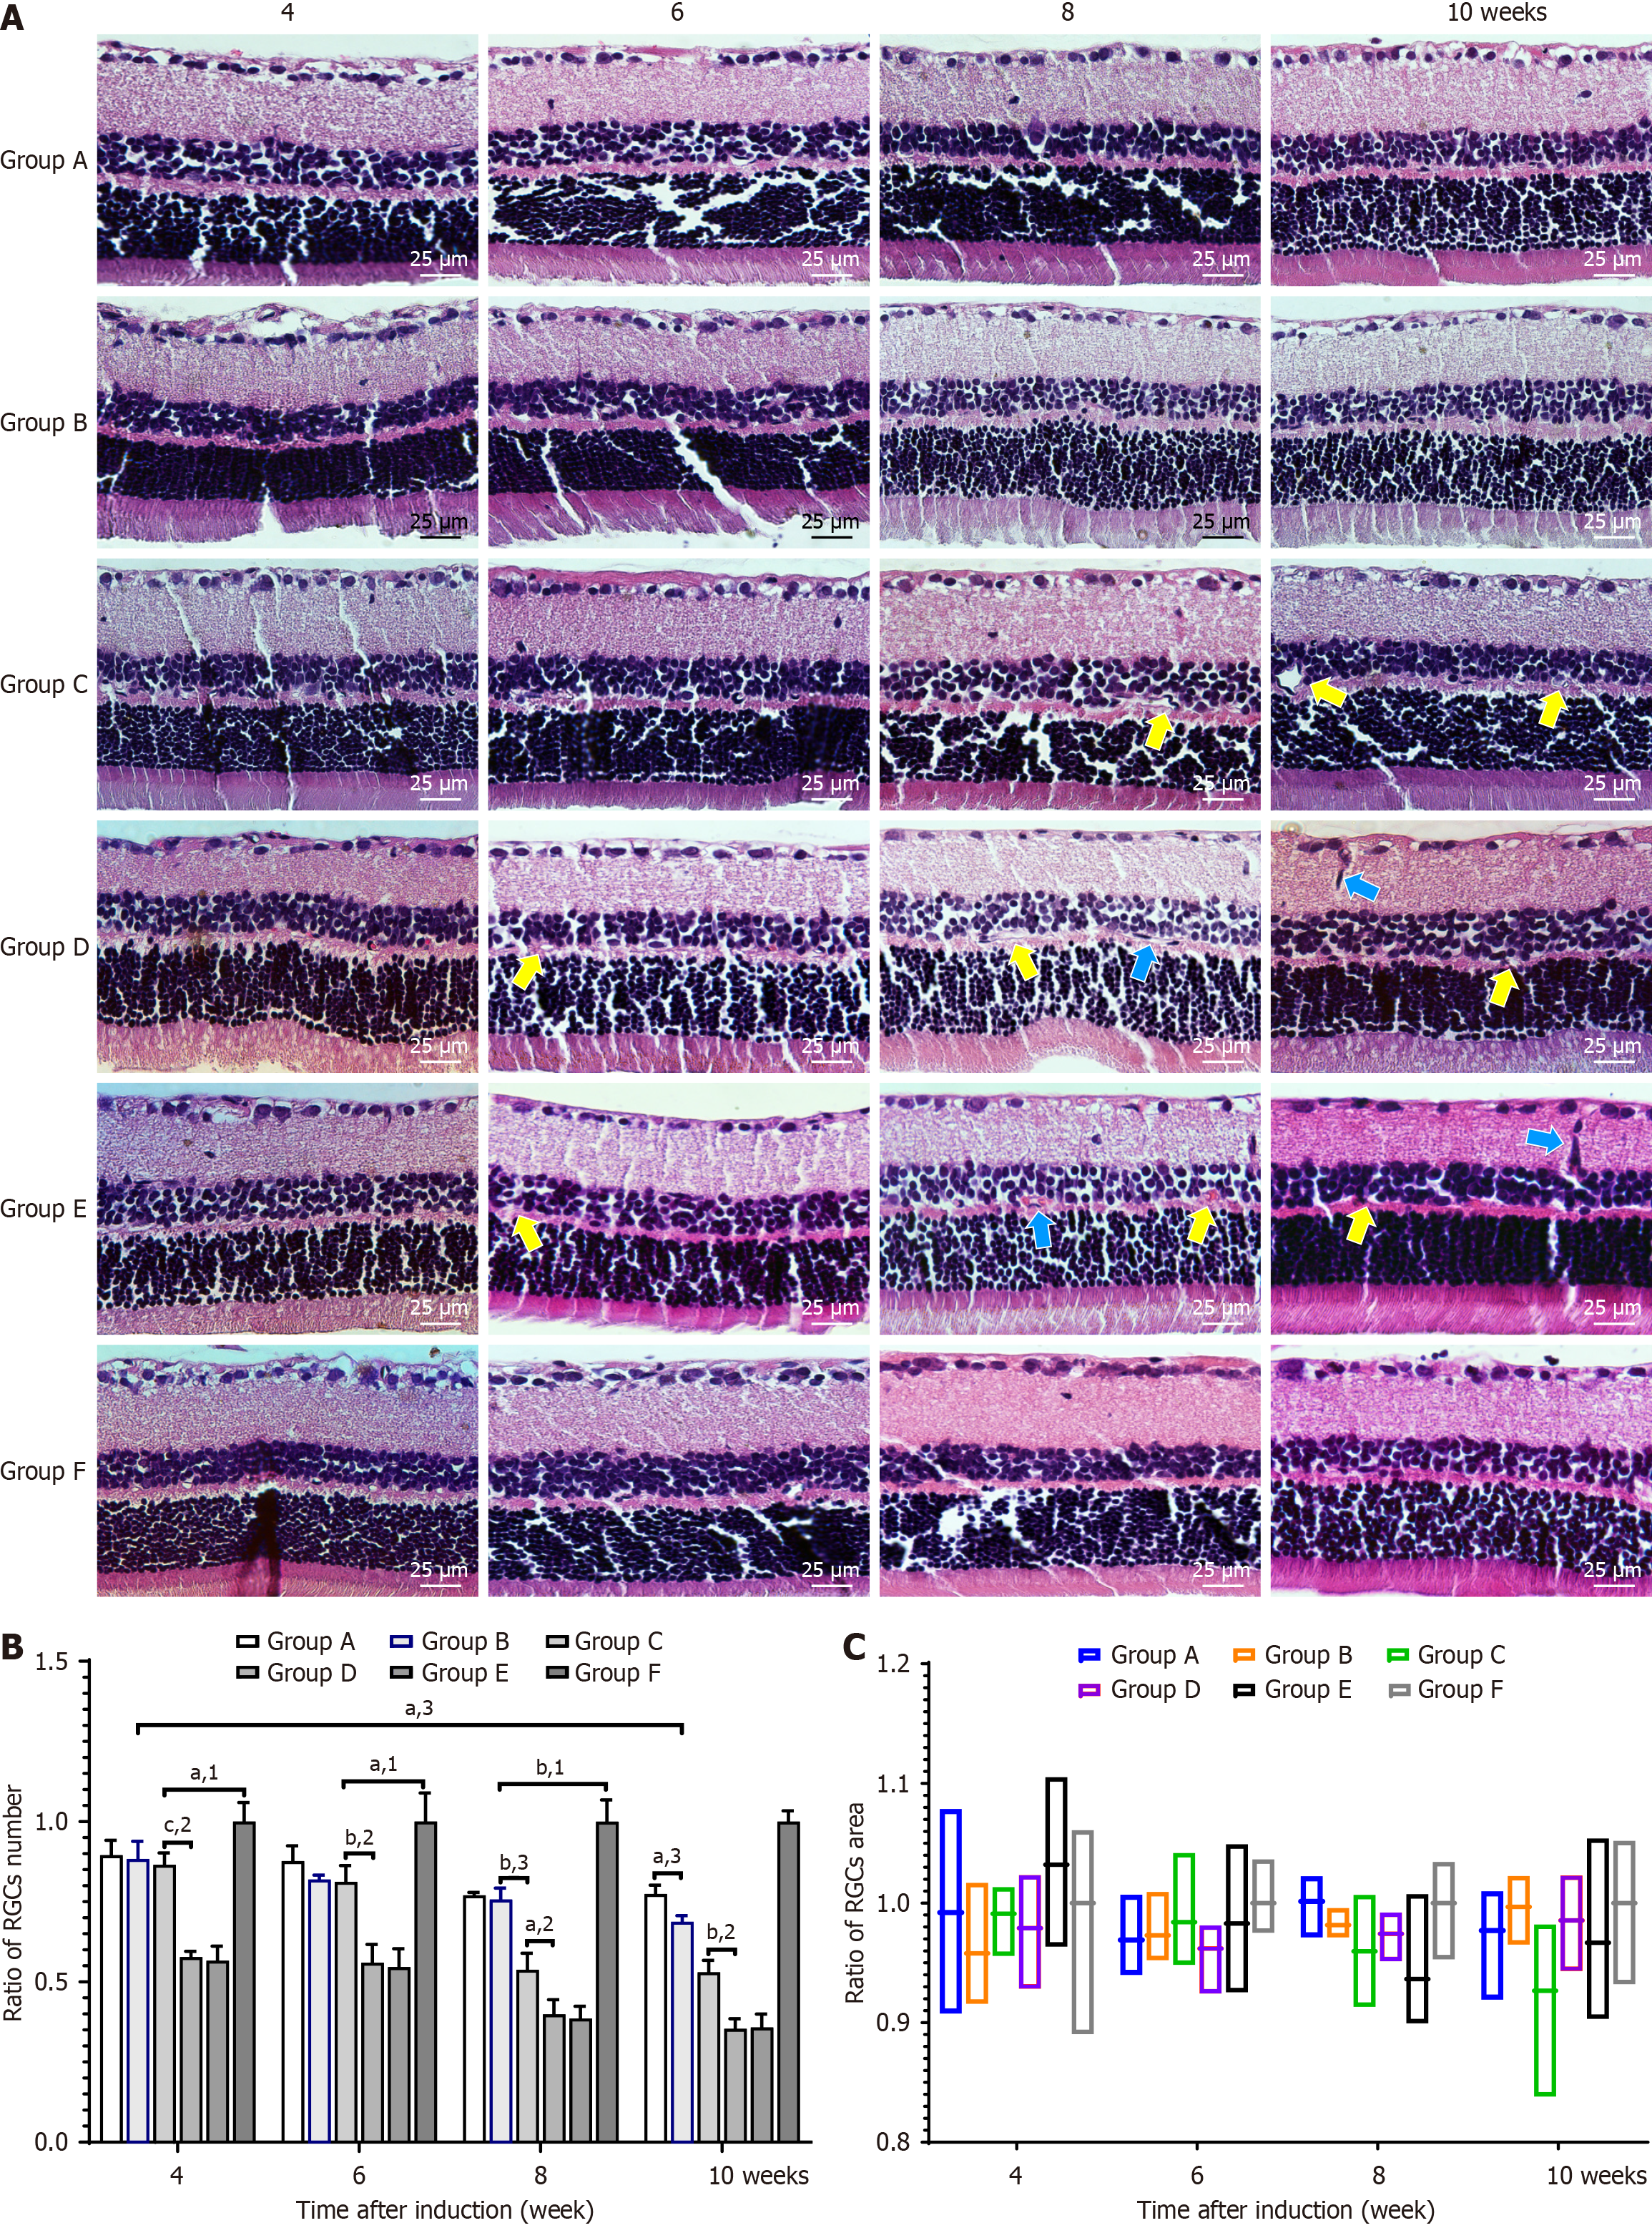
The retinal tissues were isolated from normal and diabetic rats and fixed in 4% paraformaldehyde solution at 20 °C for 2 hours. The samples were subsequently sectioned at a thickness of 5 μm, stained with H&E, and examined under a light microscope (magnification, 400 ×; Zeiss AG, Oberkochen, Germany) to determine the number and area of retinal ganglion cells (RGCs) in the sample.
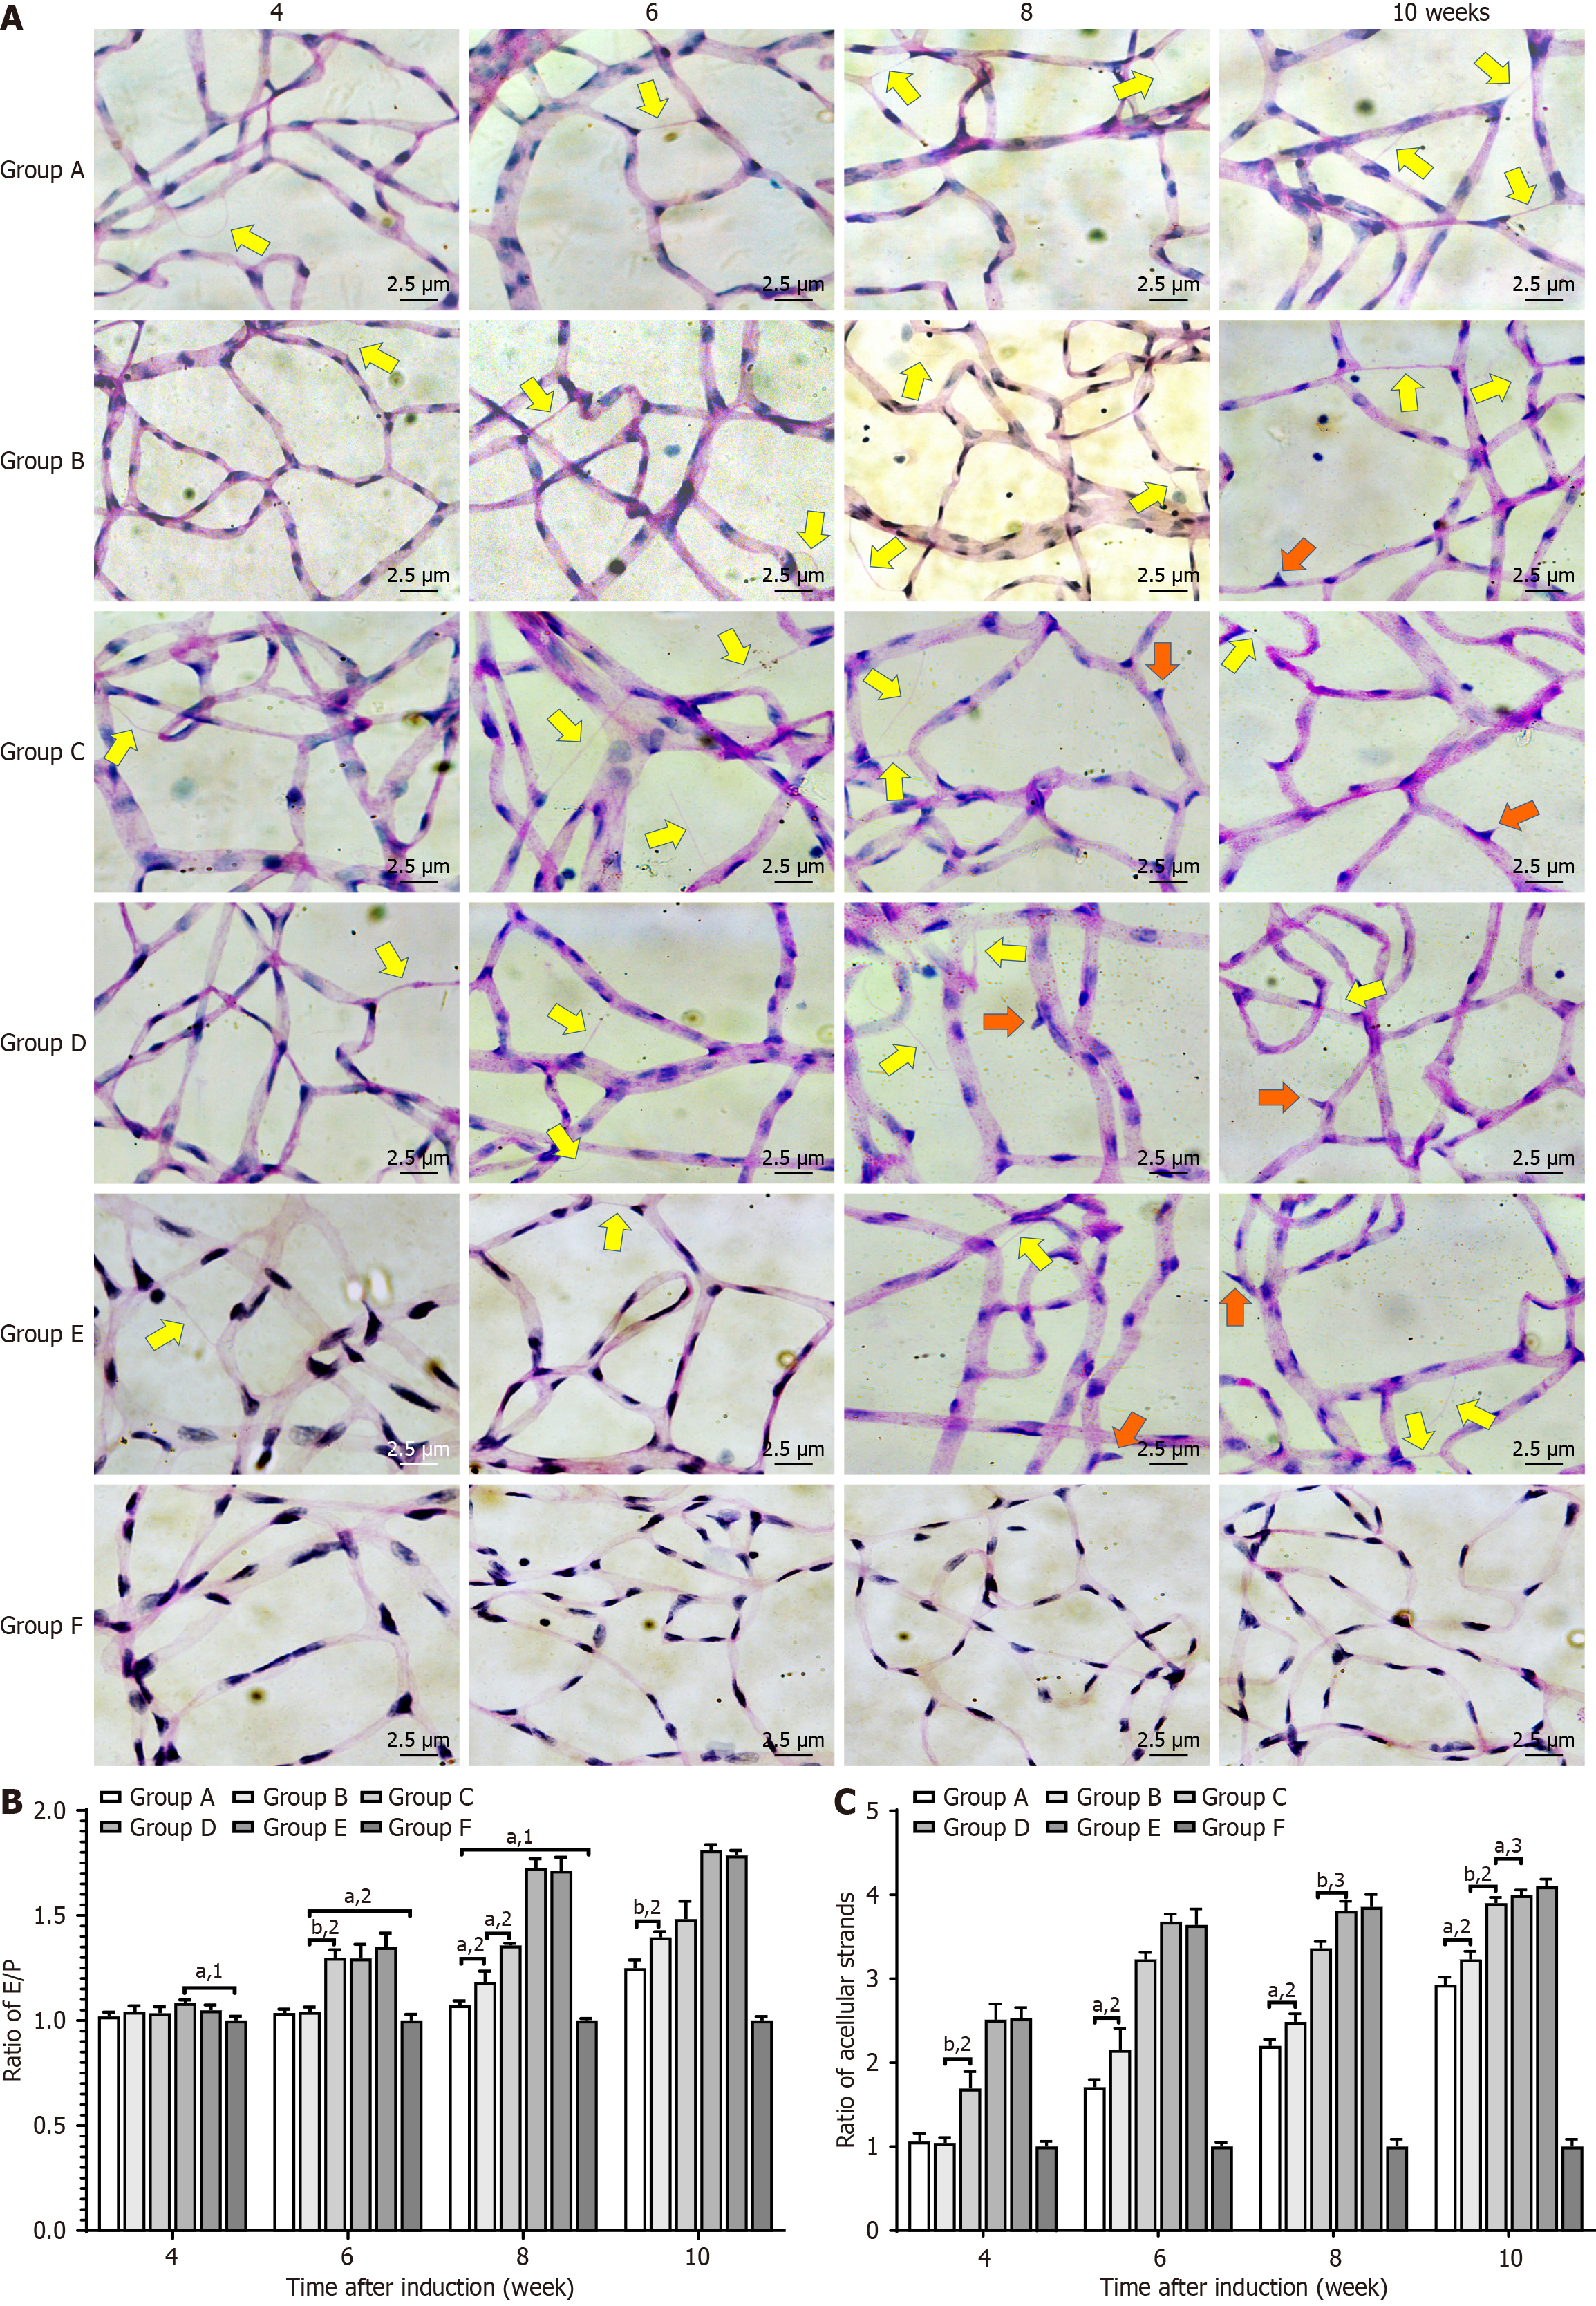
Retinal tissues were isolated from each group and fixed in 4% paraformaldehyde solution at 20 °C for 24 hours. The samples were then placed in trypsin solution for 40 minutes at 37 °C, stained with PAS, and examined under a light microscope (magnification, 400 ×; Zeiss AG) to determine the endotheliocyte to pericyte (E/P) ratio and the number of acellular strands.
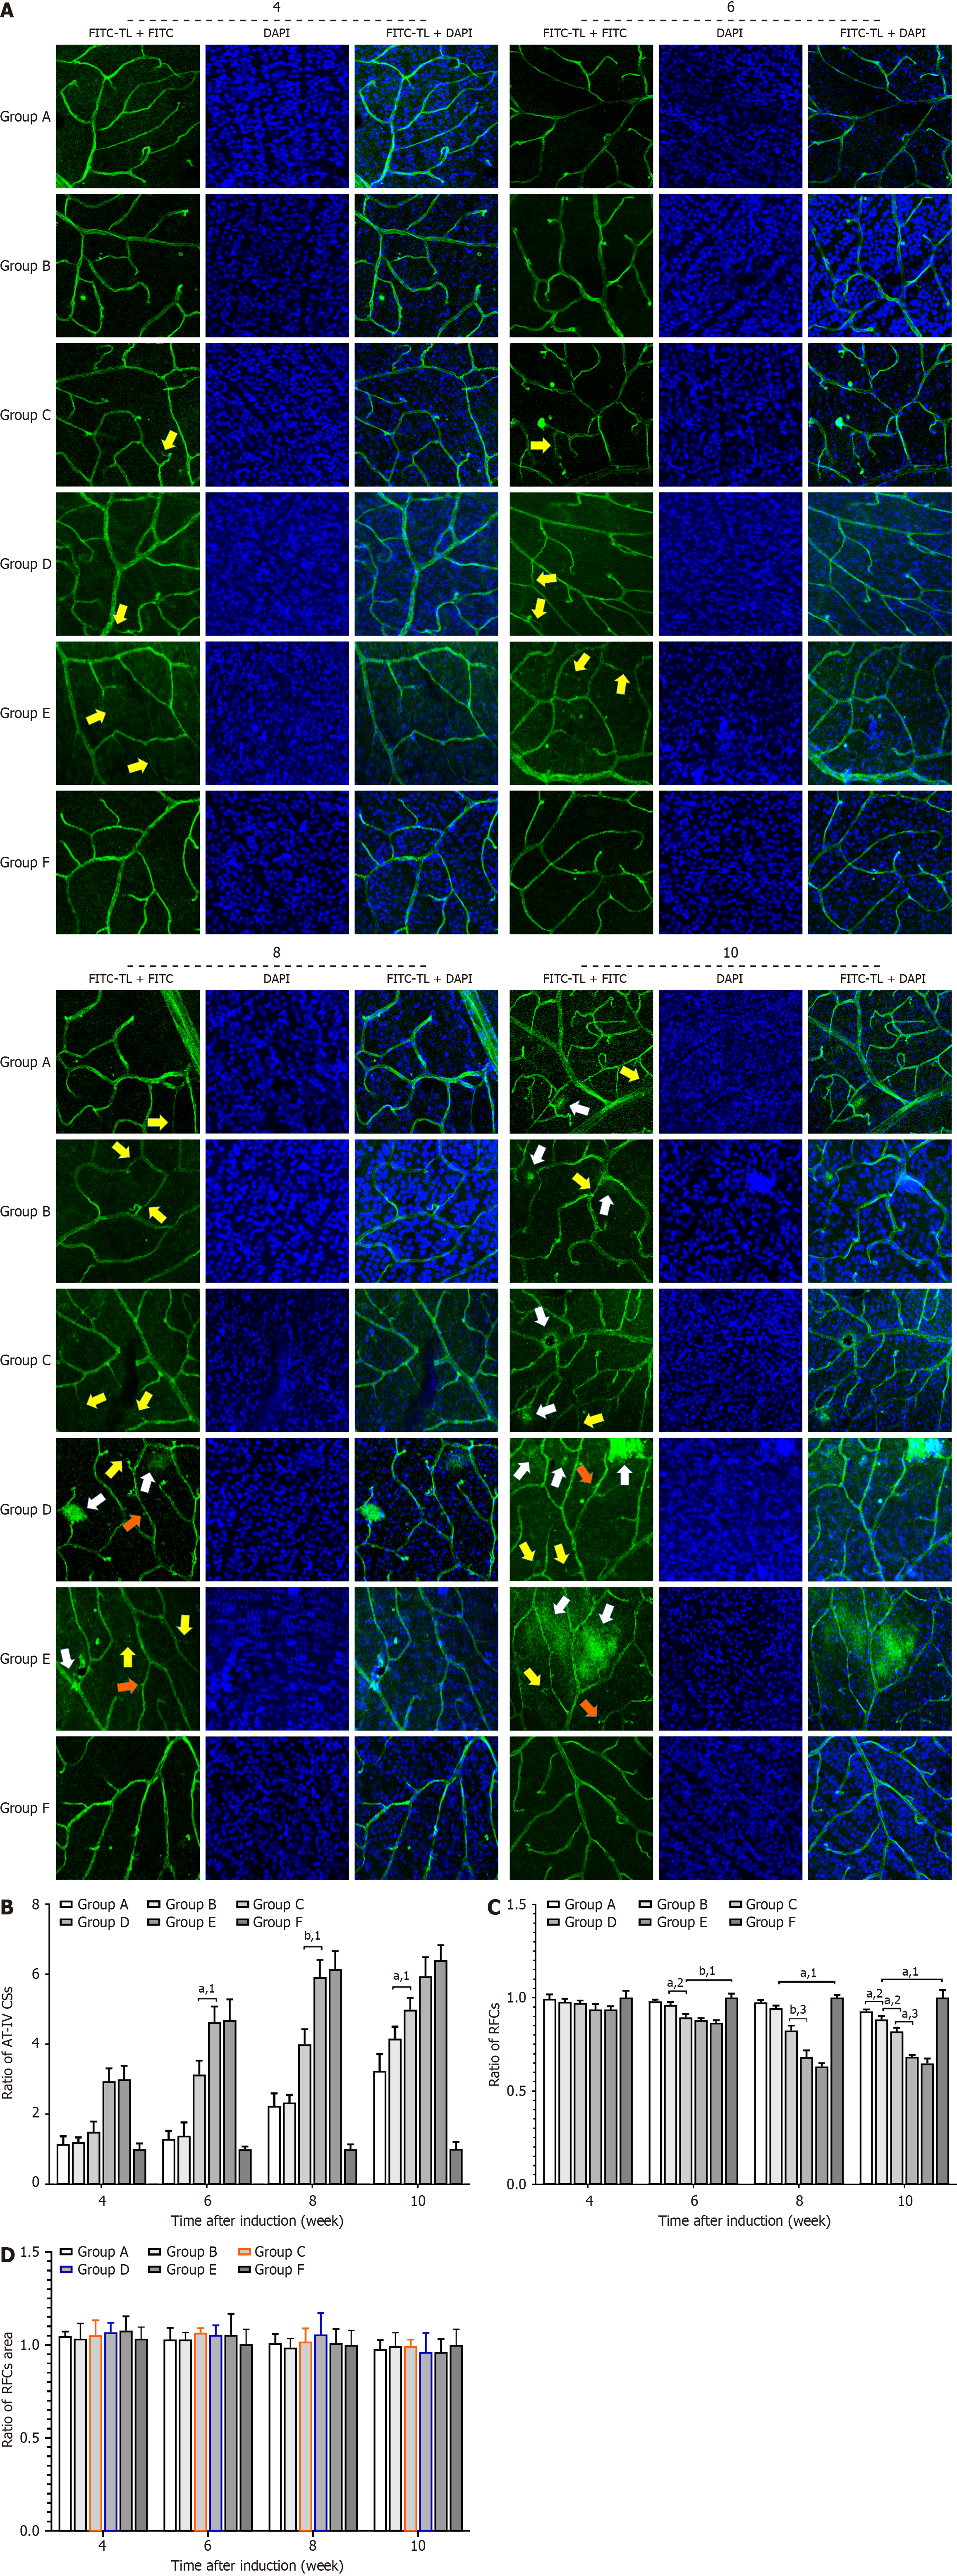
Retinal flat mounts were processed to visualize the vascular basement membrane by immersing them in marker solutions. Before immersion staining, the retinal flat mounts were incubated for 30 minutes at room temperature in 5% normal bovine serum in PBS containing 0.5% Triton X-100 (0.5% T-PBS) as a blocking agent. Subsequently, the flat mounts were immersed overnight at room temperature in a marker solution containing rabbit polyclonal anti-type IV collagen antibody (1:300, ab19808; Abcam, Cambridge, United Kingdom) to target the basement membrane. Fluorescent goat anti-rabbit immunoglobulin G (1:45, BA1105; Wuhan Boster Biological Technology, Ltd., Wuhan, Hubei Province, China) was used as the secondary antibody. After secondary incubation at 20 °C for 5 minutes, the retinal flat mounts were washed three times with 0.5% T-PBS, placed in 4’,6-diamidino-2-phenylindole (DAPI) for 5 minutes, and washed an additional three times with 0.5% T-PBS. The retinal flat mounts were mounted on Vectashield (Wuhan Boster Biological Technology) and analyzed using the Zeiss LSM 710 confocal laser scanning microscope to determine the number of type IV collagen strands, as well as the area and number of retinal neurocytes.
To determine the mRNA expression levels of VEGF, IL-6, CD18, ICAM-1, and TNF-α in ARPE-19 cells, HRMECs, and SD rat retinal tissues, total RNA was extracted from one-fourth of the remaining retinal tissue using TRIzol reagent (Invitrogen, Carlsbad, CA, United States) and reverse transcribed with the HiFiScript cDNA Synthesis Kit (First-Strand, CoWin Biosciences, China). Polymerase chain reaction (PCR) amplification was conducted using Taq DNA polymerase (Servicebio®, Wuhan, Hubei Province, China) on a thermal cycler (GeneAmp PCR system; Applied Biosystems, Foster City, CA, United States). The oligonucleotide sequences of the quantitative PCR (qPCR) primers are presented in Table 1.
| Genes | Forward primers (5’-3’) | Reverse primers (3’-5’) |
| VEGF | TTGCCTTGCTGCTCTACCTCCA | GATGGCAGTAGCTGCGCTGATA |
| IL-6 | AGACAGCCACTCACCTCTTCAG | TTCTGCCAGTGCCTCTTTGCTG |
| CD18 | AGTCACCTACGACTCCTTCTGC | CAAACGACTGCTCCTGGATGCA |
| ICAM-1 | AGCGGCTGACGTGTGCAGTAAT | TCTGAGACCTCTGGCTTCGTCA |
| TNF-α | CTCTTCTGCCTGCTGCACTTTG | ATGGGCTACAGGCTTGTCACTC |
| STAT3 | GGGGTTCTGGGAAGTCTG | ATGGCTGGGTGAGGTTG |
| β-actin | AGCCATGTACGTAGCCATCC | ACCCTCATAGATGGGCACAG |
After extracting protein samples, the proteins were separated on 10% sodium dodecyl sulfate-polyacrylamide gels and subsequently transferred to a 0.45 μm polyvinylidene fluoride membrane (Invitrogen). The membranes were blocked in 5% skimmed milk for 1 hour and incubated with primary antibodies overnight at 4 °C, followed by incubation with secondary antibodies for 40 minutes at room temperature.
The primary antibodies included anti-hypoxia inducible factor-1 alpha (1:100, sc-13515; Santa Cruz Biotechnology, Santa Cruz, CA, United States), anti-angiopoietin-like protein 4 (ANGPTL4, 1:200, sc-373761; Santa Cruz Biotechnology), anti-ANGPTL4 (1:500, 18374-1-AP; Proteintech Group Inc., Chicago, IL, United States), anti-glyceraldehyde-3-phosphate dehydrogenase (GAPDH) (1:5000, 60004-1-Ig; Proteintech Group), anti-zona occludens 1 (1:500; Affinity Biosciences, Cincinnati, OH, United States), anti-occludin (1:500; Affinity Biosciences), anti-phosphorylated STAT3 (pSTAT3, 1:1000; Cell Signaling Technology, Danvers, MA, United States), and anti-STAT3 (1:1000; Cell Signaling Technology). Bands were detected and visualized using the Immobilon Western Chemiluminescent Horseradish Peroxidase Substrate (WBKLS0100; Merck Millipore, Billerica, MA, United States). The gray band densities were normalized to GAPDH values (used as a control) using ImageJ software (National Institutes of Health, Bethesda, MD, United States).
IPP 6.0 and ImageJ 2.0 were used to process the images, and IBM SPSS 19.0 statistical software was used for statistical analyses of the obtained data. One-way analysis of variance was conducted for multiple mean values, and independent samples t-test was conducted for the data between the groups. All data are presented as the mean ± SE of the mean. P < 0.05 was considered statistically significant.
ARPE-19 cells and HRMECs were treated with 0 mg/mL, 0.0625 mg/mL, 0.125 mg/mL, or 0.25 mg/mL of ranibizumab for 6 hours, 12 hours, 24 hours, and 48 hours to determine its effective concentration. The cells were subsequently assessed using the CCK-8 assay. In our study, cell viability decreased with increasing doses and durations of ranibizumab (Figure 1). Ranibizumab concentrations greater than 0.125 mg/mL (24 hours) were significantly inhibitory and cytotoxic. Therefore, 0.25 mg/mL ranibizumab was used to incubate the cells for 24 hours in subsequent experiments.
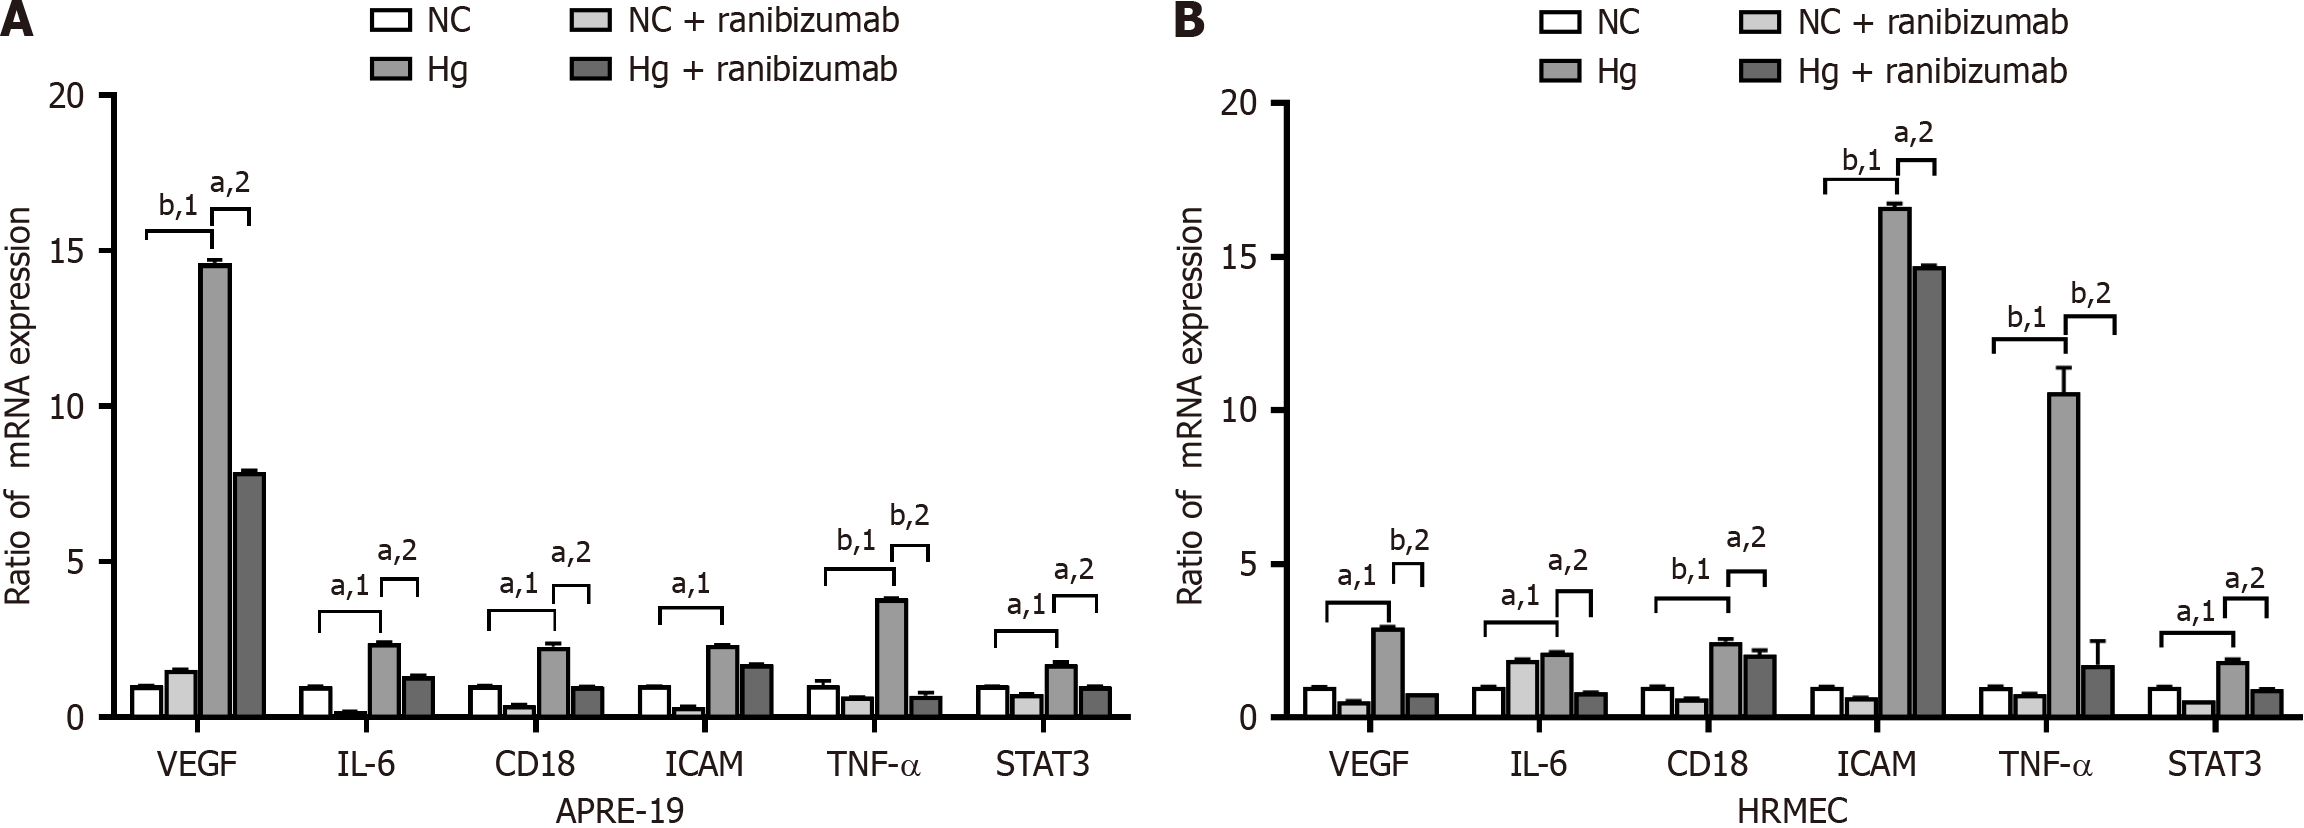
ARPE-19 cells and HRMECs were cultured under normal (5.5 mmol/L) and high (25 mmol/L) glucose concentrations for 48 hours. Ranibizumab (0.125 mg/mL) was then added for 24 hours (Figure 2). qPCR technology was used to assess the mRNA expression of VEGF, IL-6, CD18, ICAM, TNF-α, and STAT3 in each group. The mRNA expression of VEGF, IL-6, CD18, ICAM, TNF-α, and STAT3 was higher in the high-glucose group than the normal glucose group (P < 0.05). The mRNA expression levels decreased relative to that of the untreated cells after treatment with ranibizumab (P < 0.05).
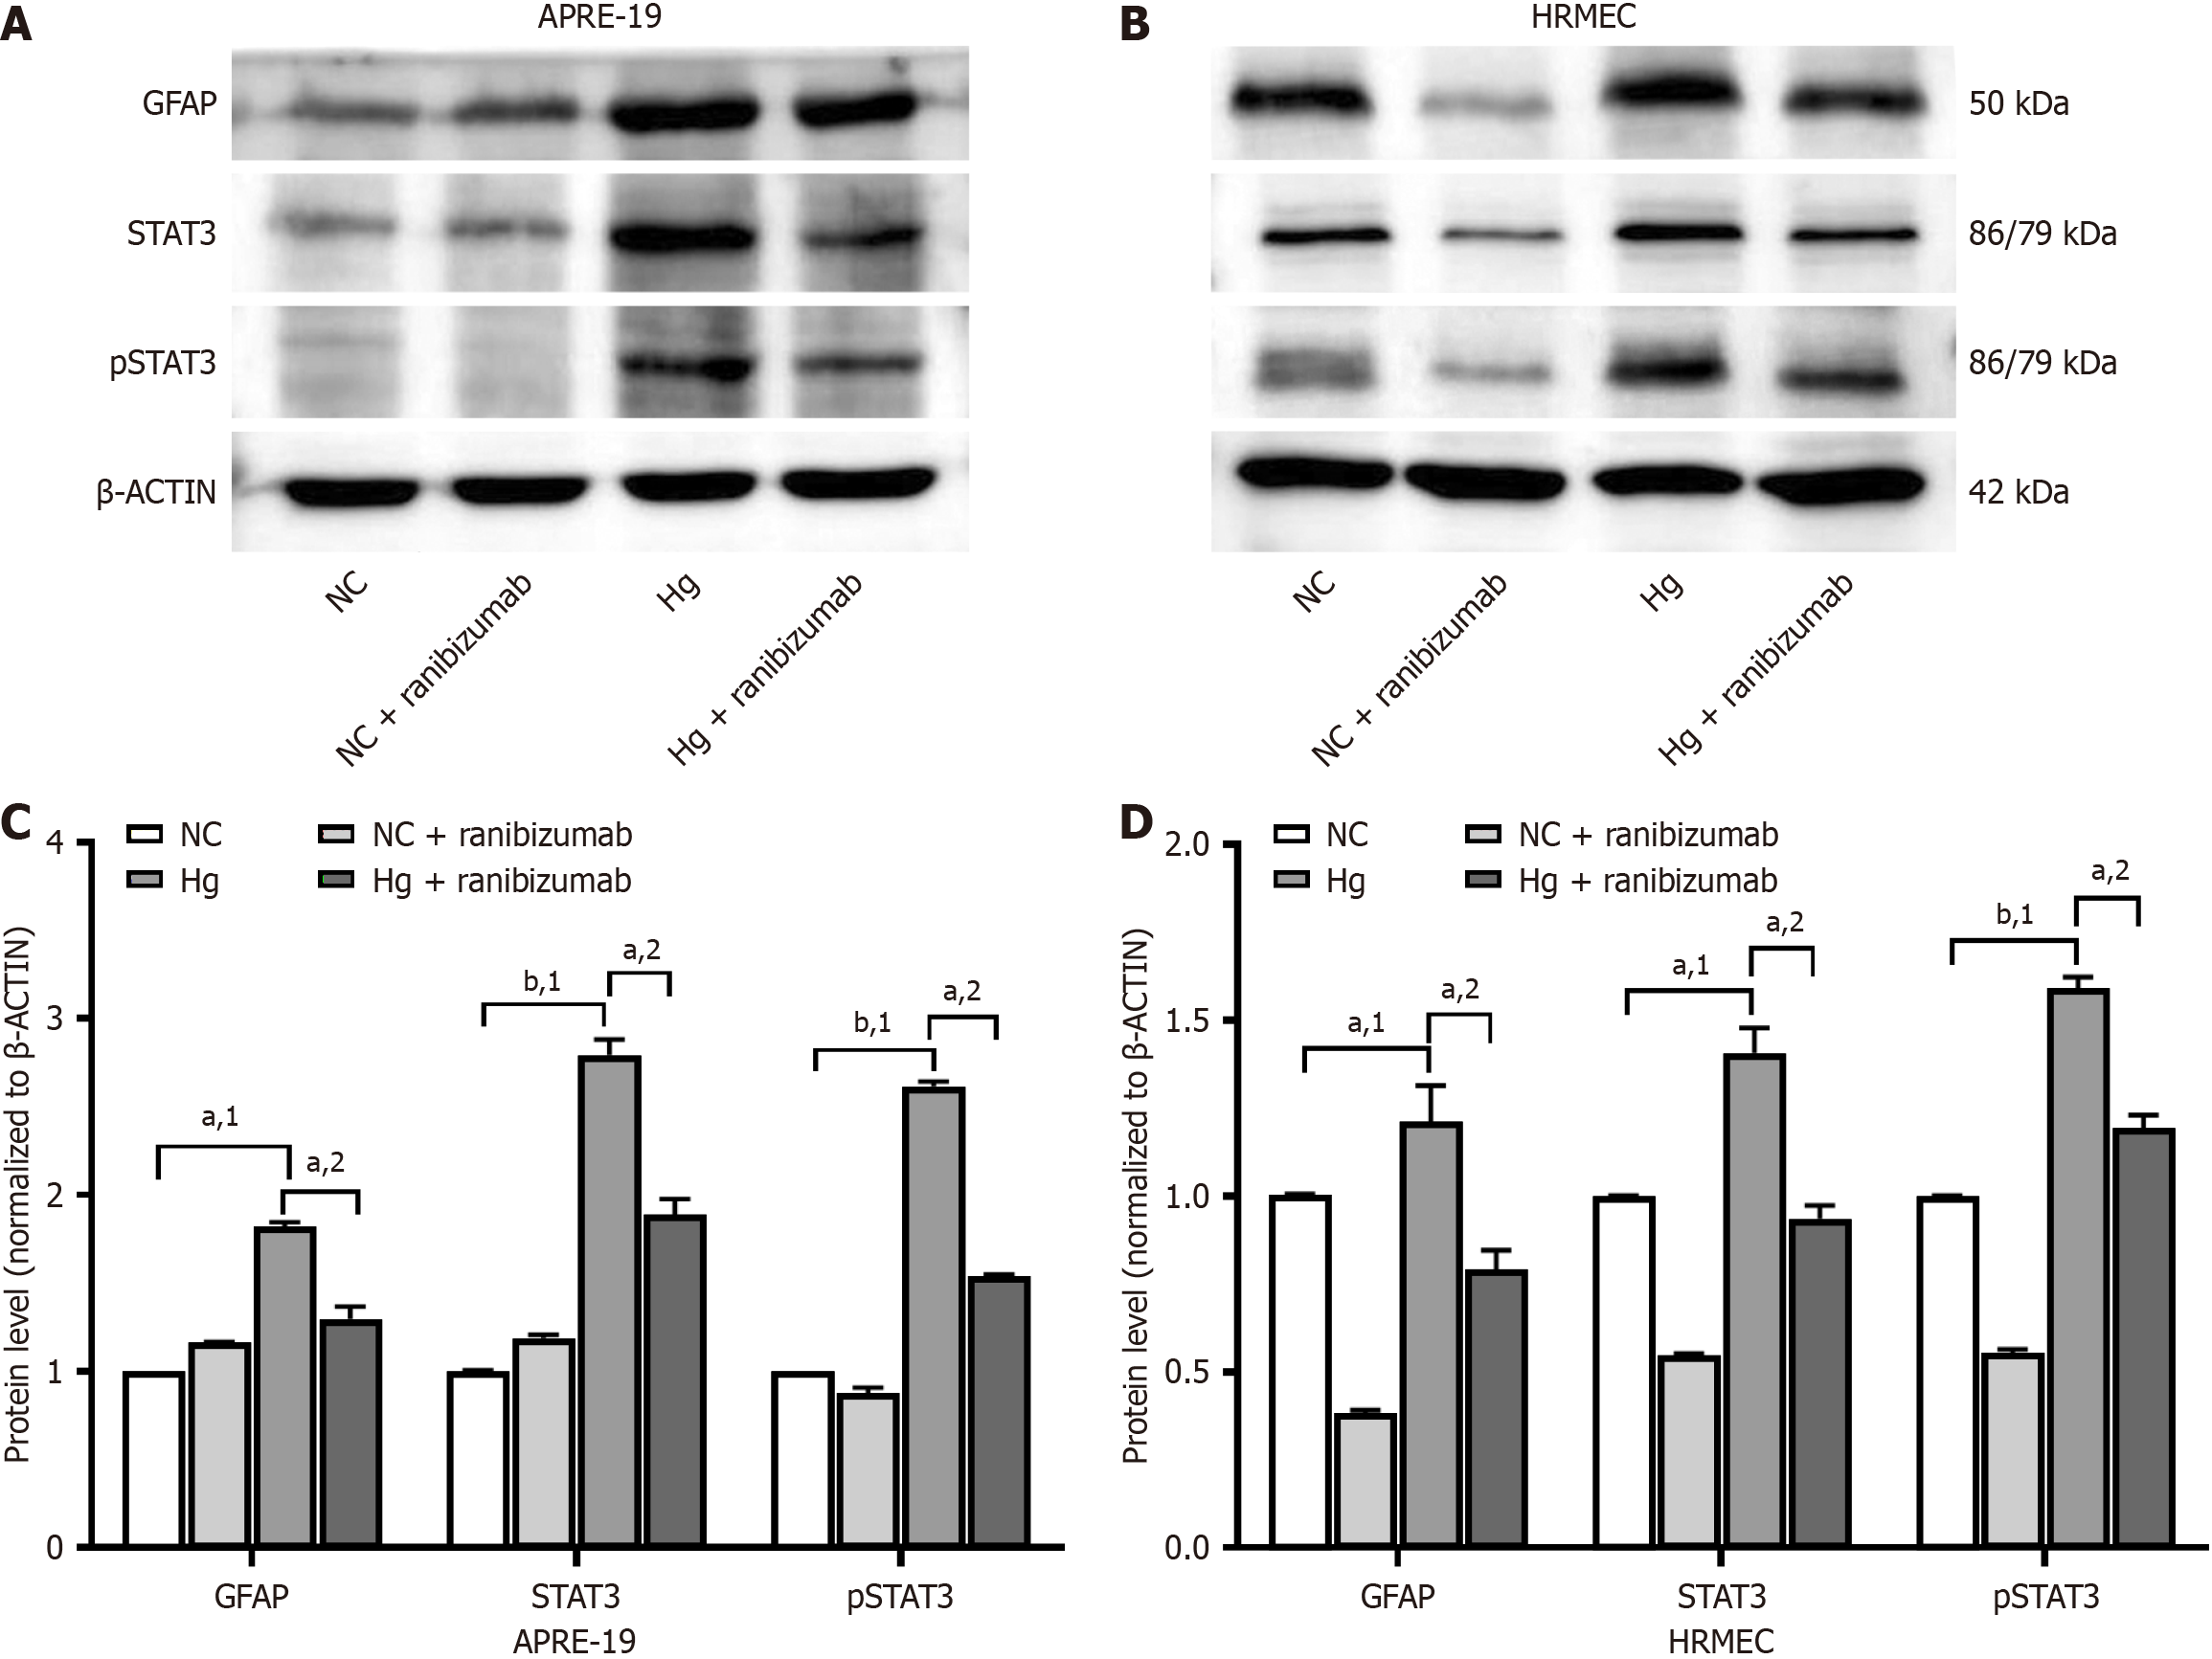
ARPE-19 cells and HRMECs were cultured under normal (5.5 mmol/L) and high (25 mmol/L) glucose concentrations for 48 hours. Ranibizumab (0.125 mg/mL) was then introduced for 24 hours (Figure 3). Western blotting was used to detect the expression of GFAP, STAT3, and pSTAT3 proteins in each group. The expression of GFAP, STAT3, and pSTAT3 proteins in the high-glucose group were significantly higher than in the normal glucose group (P < 0.05). Protein expression decreased after treatment with ranibizumab compared to that in untreated cells (P < 0.05).
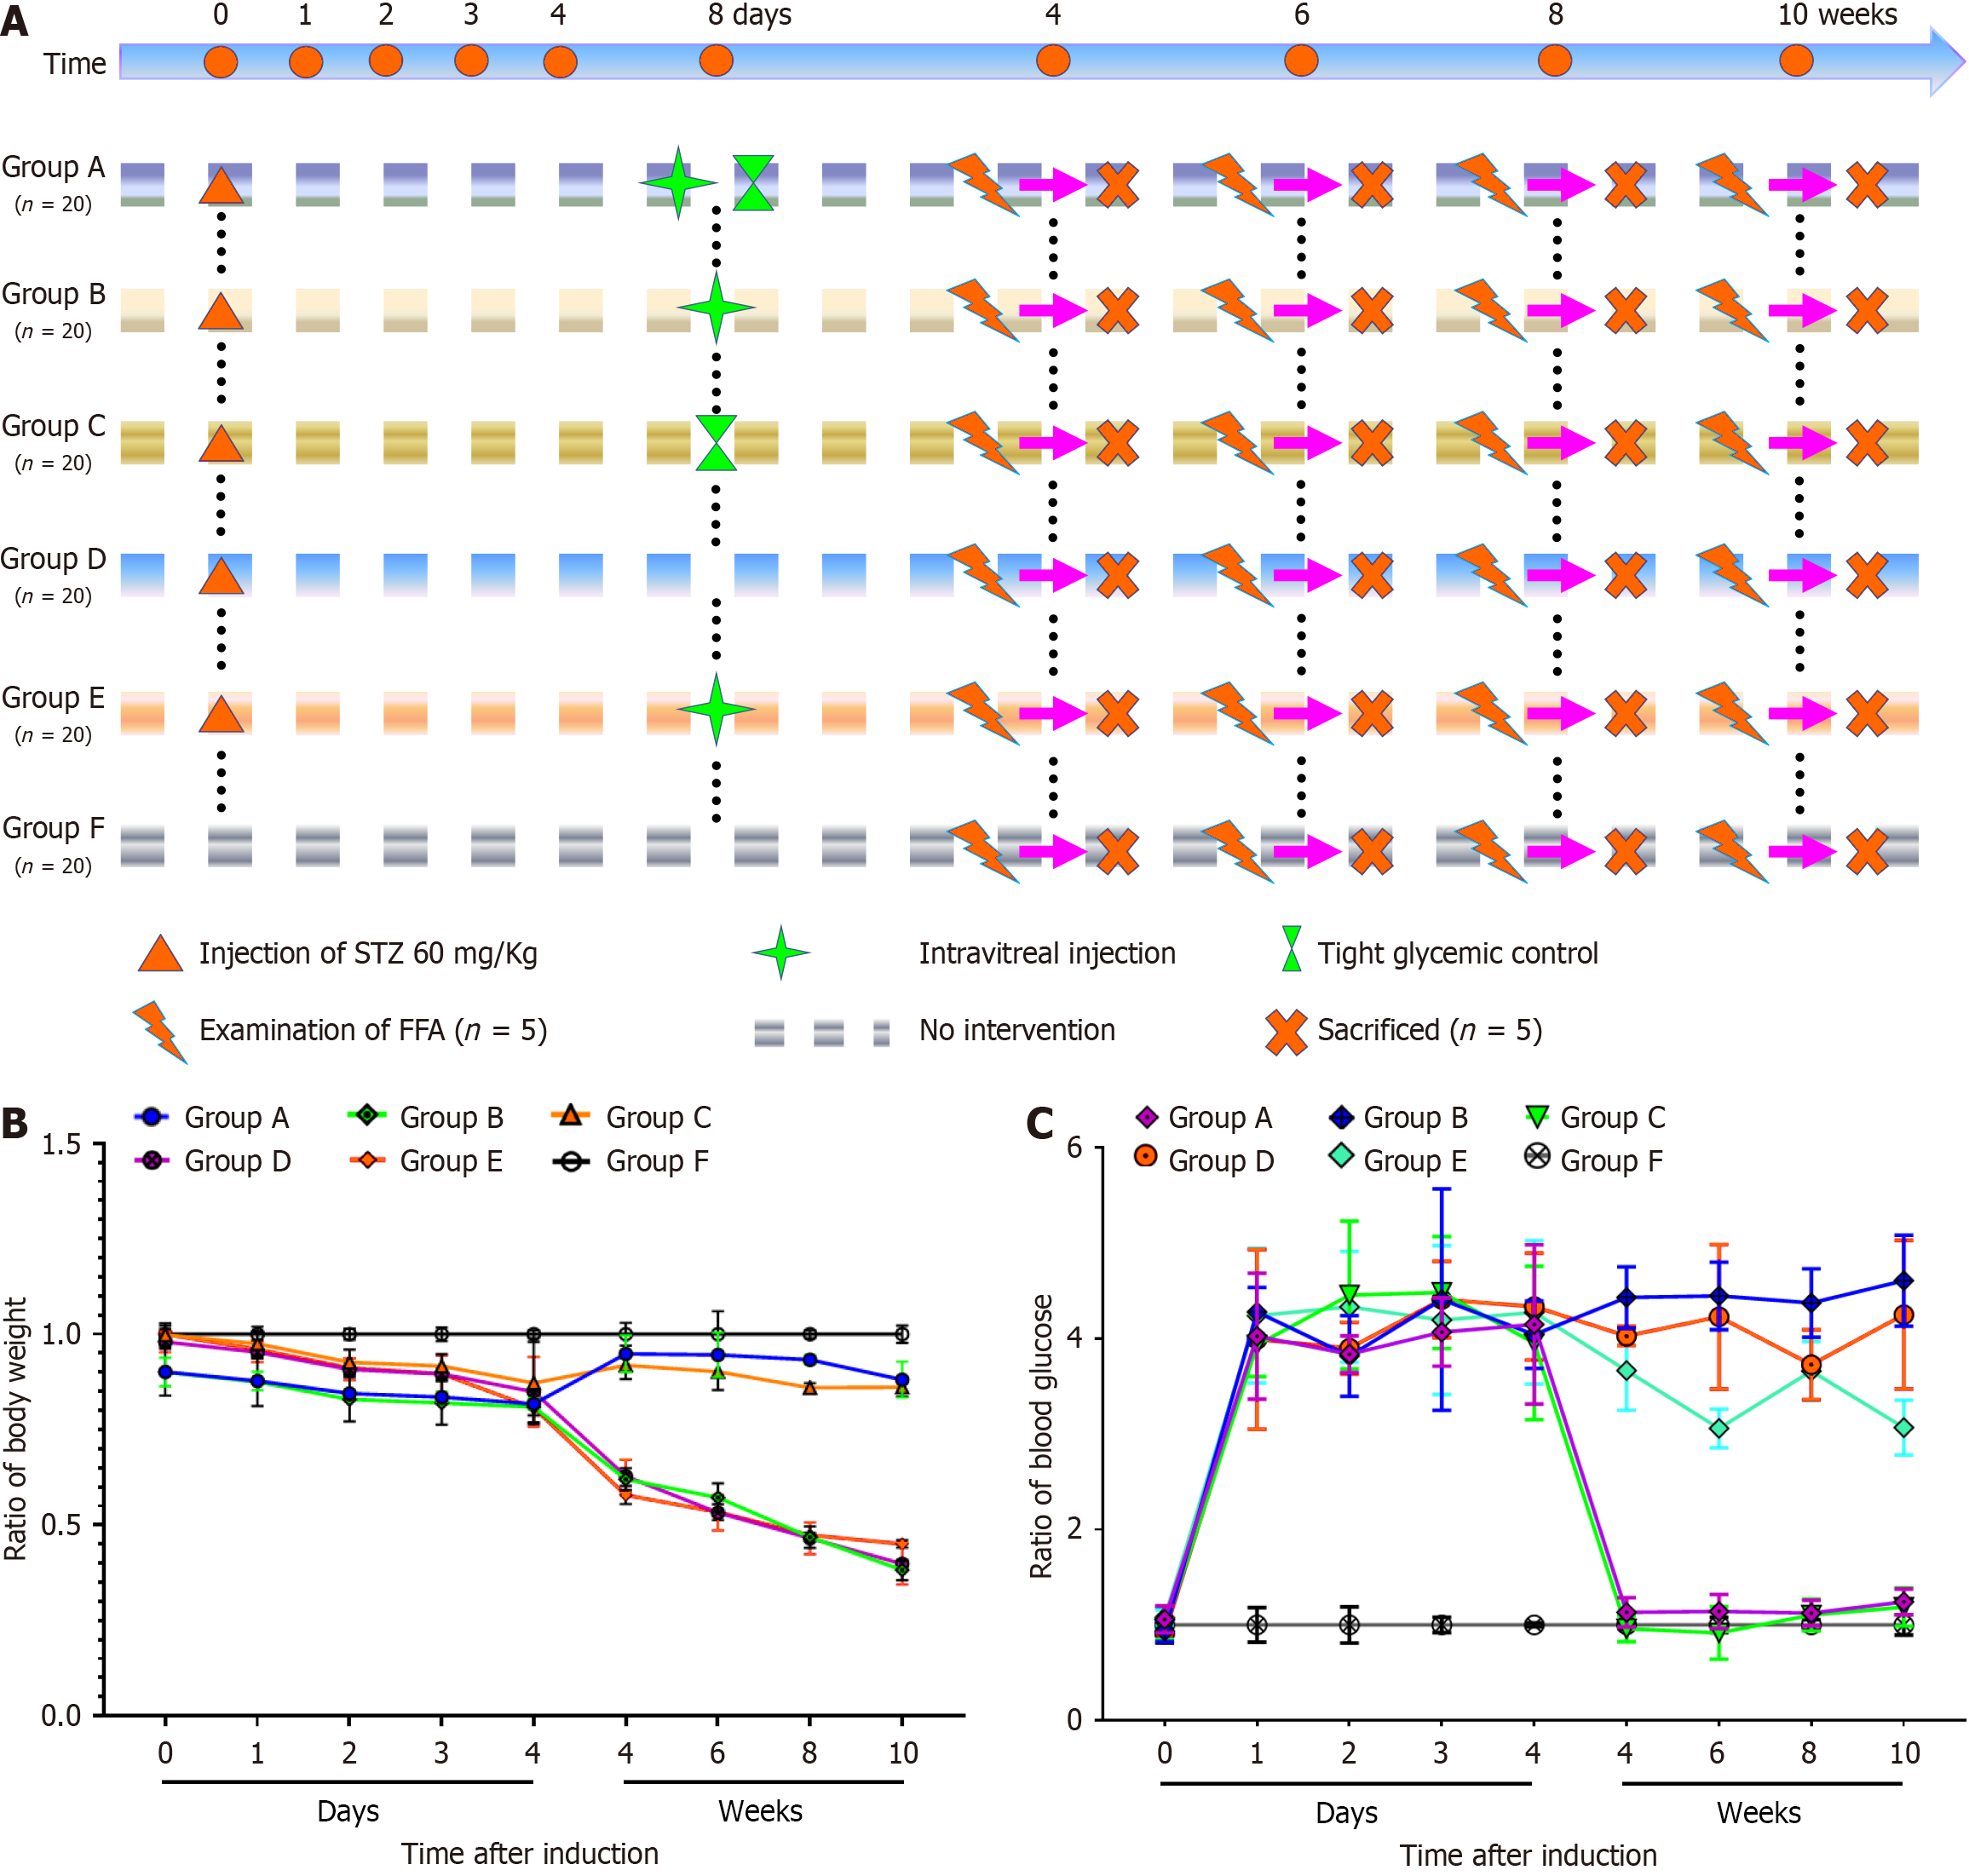
The experiment was conducted using 100 diabetic rats, which were randomly divided into five groups (A, B, C, D, E), with each group consisting of 20 rats. Additionally, 20 normal rats without any treatment served as the control group (Group F). Diabetes was induced in Groups A, B, C, D, and E with an intraperitoneal injection of streptozotocin at a dosage of 60 mg/kg. On the eighth day after diabetes induction, certain groups received interventions, such as intravitreal injections or intensive blood glucose control. During the follow-up period, FFA examinations were performed on five rats from each group at 4 week intervals (weeks 4, 6, 8, and 10). At the end of each time point, five rats from each group were randomly sacrificed for further analysis. The control group (Group F) did not receive any intervention. Throughout the experiment, changes in body weight and blood glucose concentrations were recorded for all groups.
Compared with Group F, the body weight of SD rats in Groups A, B, C, D, and E significantly decreased on the fourth day after successful modeling (P < 0.05). However, after implementing strict blood glucose control on the eighth day, the body weight of rats in groups A and C gradually increased, while remaining lower than the normal group (P < 0.05). By contrast, the body weight of rats in Groups B, D, and E continued to decrease as the disease progressed. On the first day after successful modeling, the blood glucose levels in Groups A, B, C, D, and E rose sharply, showing a statistically significant difference compared with group F (P < 0.001). By the eighth day, following strict blood glucose control, the blood glucose levels in Groups A and C approached normal levels, whereas those in Groups B, D, and E remained consistently elevated (Figure 4).
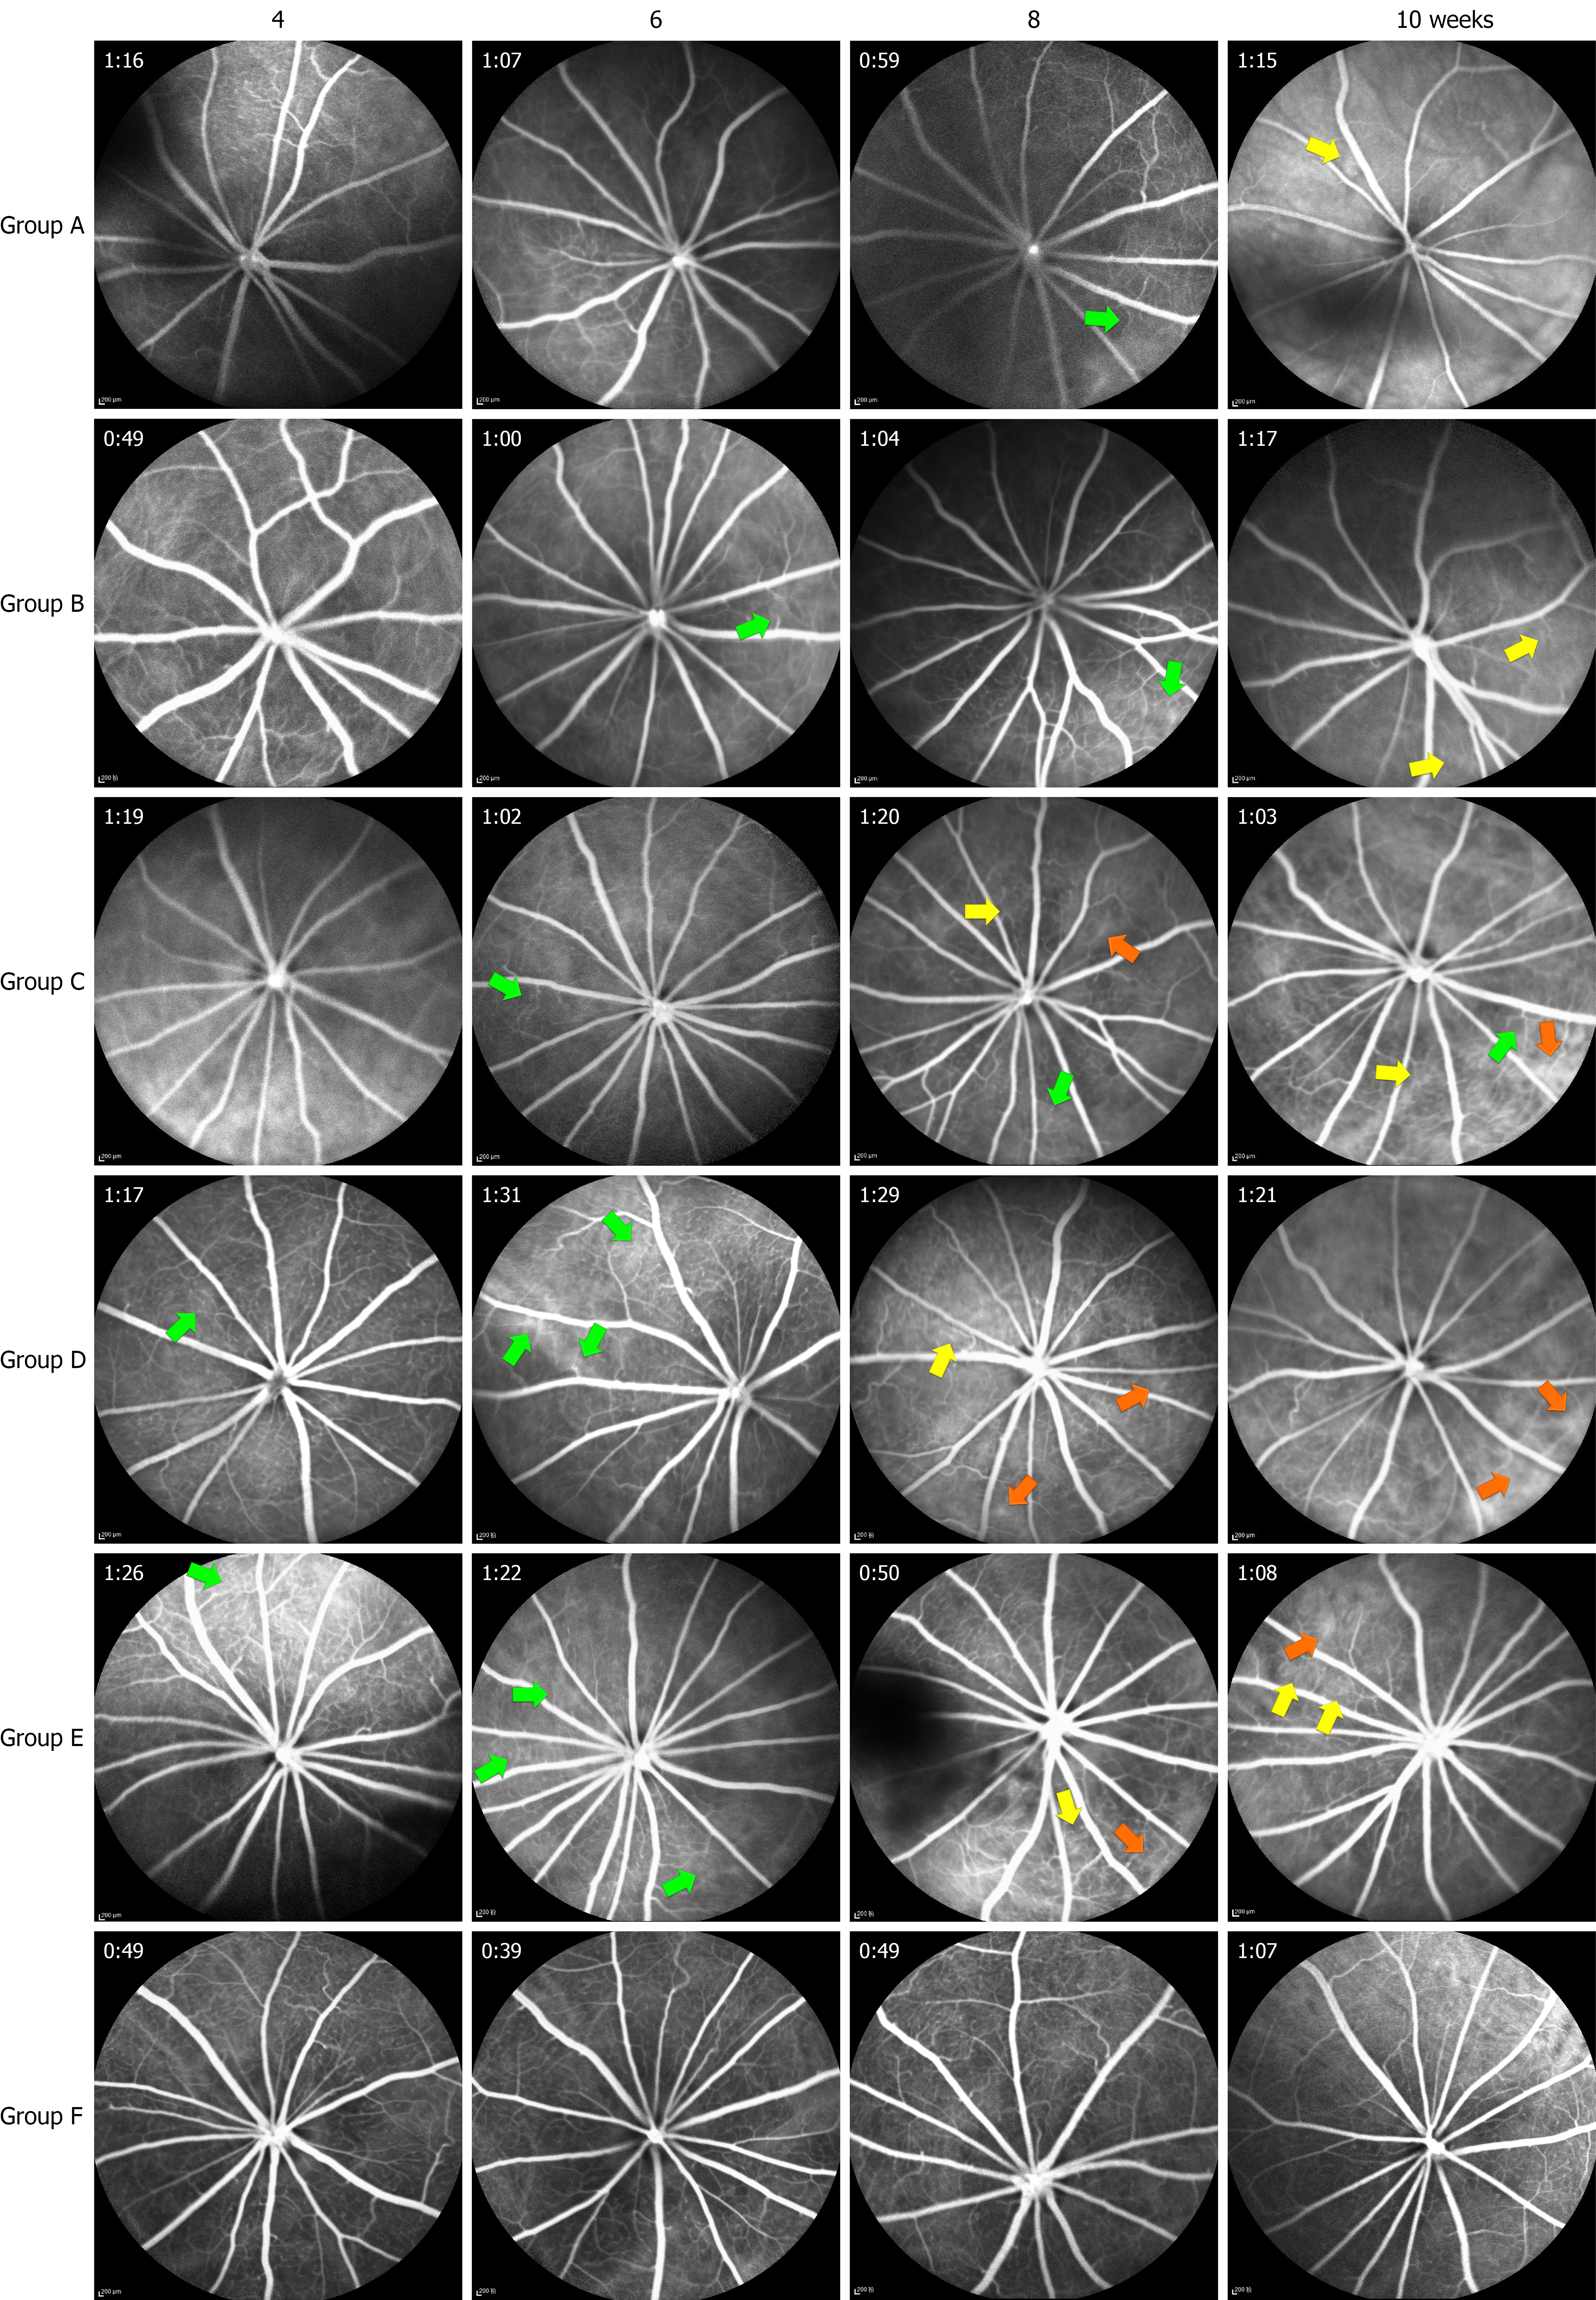
We performed FFAs to document any fundus changes in the rats during the 10 week observation period (Figure 5). Sodium fluorescein was injected intraperitoneally for 3-5 seconds. Retinal vein laminar flow was then observed for 5-7 seconds until it disappeared completely after 3-6 minutes. The entire skin of the SD rats was yellow at the end of examination. During the eighth and tenth weeks, there were significantly more RGCs in Groups A and B than in Groups C and D (P < 0.01) but no significant difference was noted compared with Group F (P > 0.05). Additionally, there was no difference in the RGC areas among the groups at all time points. We observed microvascular dilatation in Groups C and D during the sixth week, which worsened as the disease progressed. Neovascular buds and vascular expansion were eventually observed in Group D during the tenth week, while no such phenomena were observed in Groups A, B, and E.
We observed the morphological changes in the retinal nerve fiber layer and retinal pigment epithelium during the sixth, eighth, and tenth weeks after DM induction. The number and area of RGCs in each group were counted and measured (Figure 6).
During the eighth and tenth weeks, there were significantly more RGCs in Groups A and B than in Groups C and D (P < 0.01), but no significant difference was noted compared with Group F (P > 0.05). Additionally, there was no difference in RGC areas among the groups at all time points. We observed microvascular dilatation in Groups C and D during the sixth week, which worsened as the disease progressed. Neovascular buds and vascular expansion were eventually observed in Group D during the tenth week, while no such phenomena were observed in Groups A, B, and E.
PAS staining of retinal tissue depicts elongated, light-colored retinal vascular endothelial cell nuclei and round, darker-colored pericyte nuclei. We measured the E/P ratios and the number of acellular capillaries during the fourth, sixth, eighth, and tenth weeks (Figure 7). During the eighth and tenth weeks, the E/P ratios of Groups A and B were significantly lower than in Groups C and D (P < 0.05). There was no difference in the E/P ratio in Groups C and D during the sixth and eighth weeks, but a significant difference was observed during the tenth week (P < 0.05). Acellular capillaries formed in all groups during the observation period; however, there was no significant difference between Groups A and B and Group E. There were significantly less acellular capillaries in Groups C and D. There was no difference in the E/P ratio between Groups C and D during the sixth and eighth weeks after modeling, but a significant difference was observed during the tenth week (P < 0.05).
This study examined the cell and microvessel changes in the retinal tissue of SD rats using fluorescein isothiocyanate-tomato lectin, rabbit polyclonal anti-type IV collagen antibody, and DAPI-labeled retinal flat preparation (Figure 8). There were less anti-IV + collagen strands in the retinal tissues of Groups A or B than in Groups C and D at each time point over the 10 week observation period (P < 0.05), but no relative difference compared to Group E. There were also less anti-IV + collagen strands in the retinal tissue of Group C than in Groups D and E at each time point (P < 0.05).
Similarly, there were less retinal tissue cells in Groups A and B than in Group E at each time point during the 10 week observation period (P < 0.01). There was no difference in the number of retinal cells in Groups C and D during the sixth week, but a significant difference was observed with disease progression (P < 0.01).
Group A exhibited local vascular leakage during the tenth week, whereas Groups C and D showed significant vascular leakage as early as the eighth week. Group D demonstrated local neovascular bud formation during the tenth week, but the same was not observed in Group B over the duration of the study. We observed no differences in retinal tissue cell volumes among the groups at all time points.
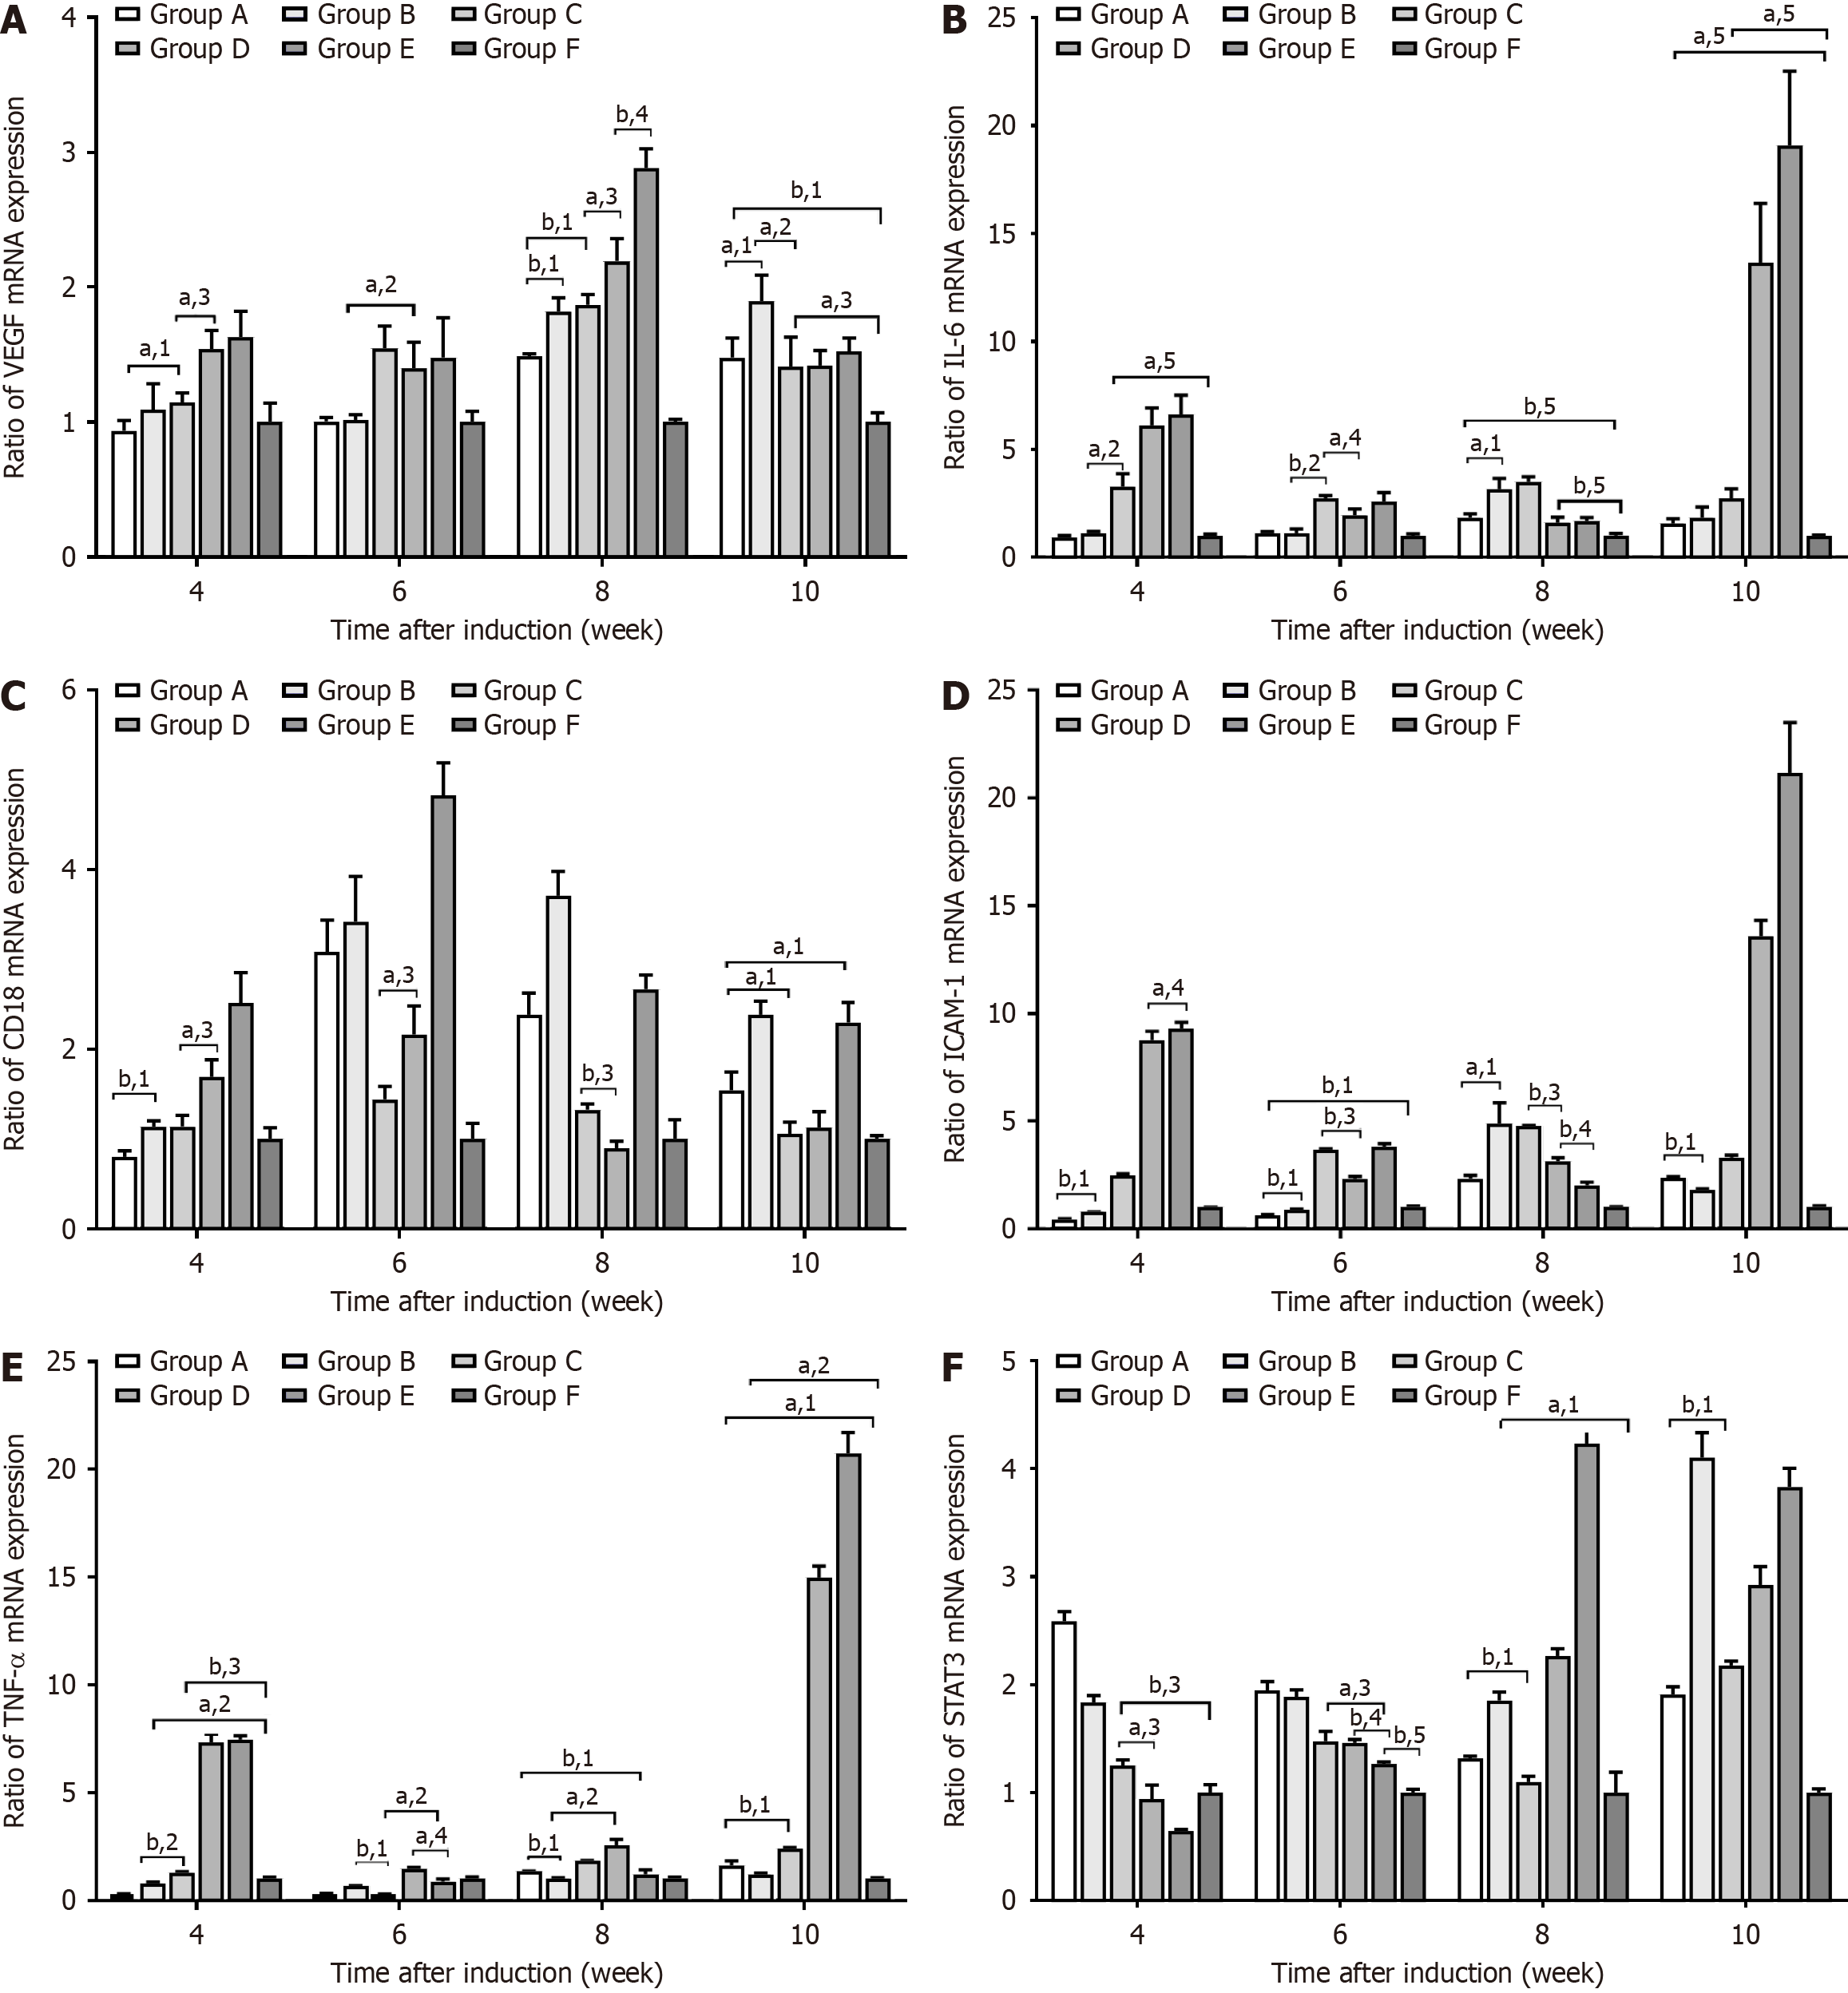
This study used qPCR to measure the expression of various cytokine mRNAs in the retinal tissues of SD rats (Figure 9). At weeks 6, 8, and 10, VEGF mRNA expression was significantly higher in Groups A, B, and F than in Groups C, D, or E
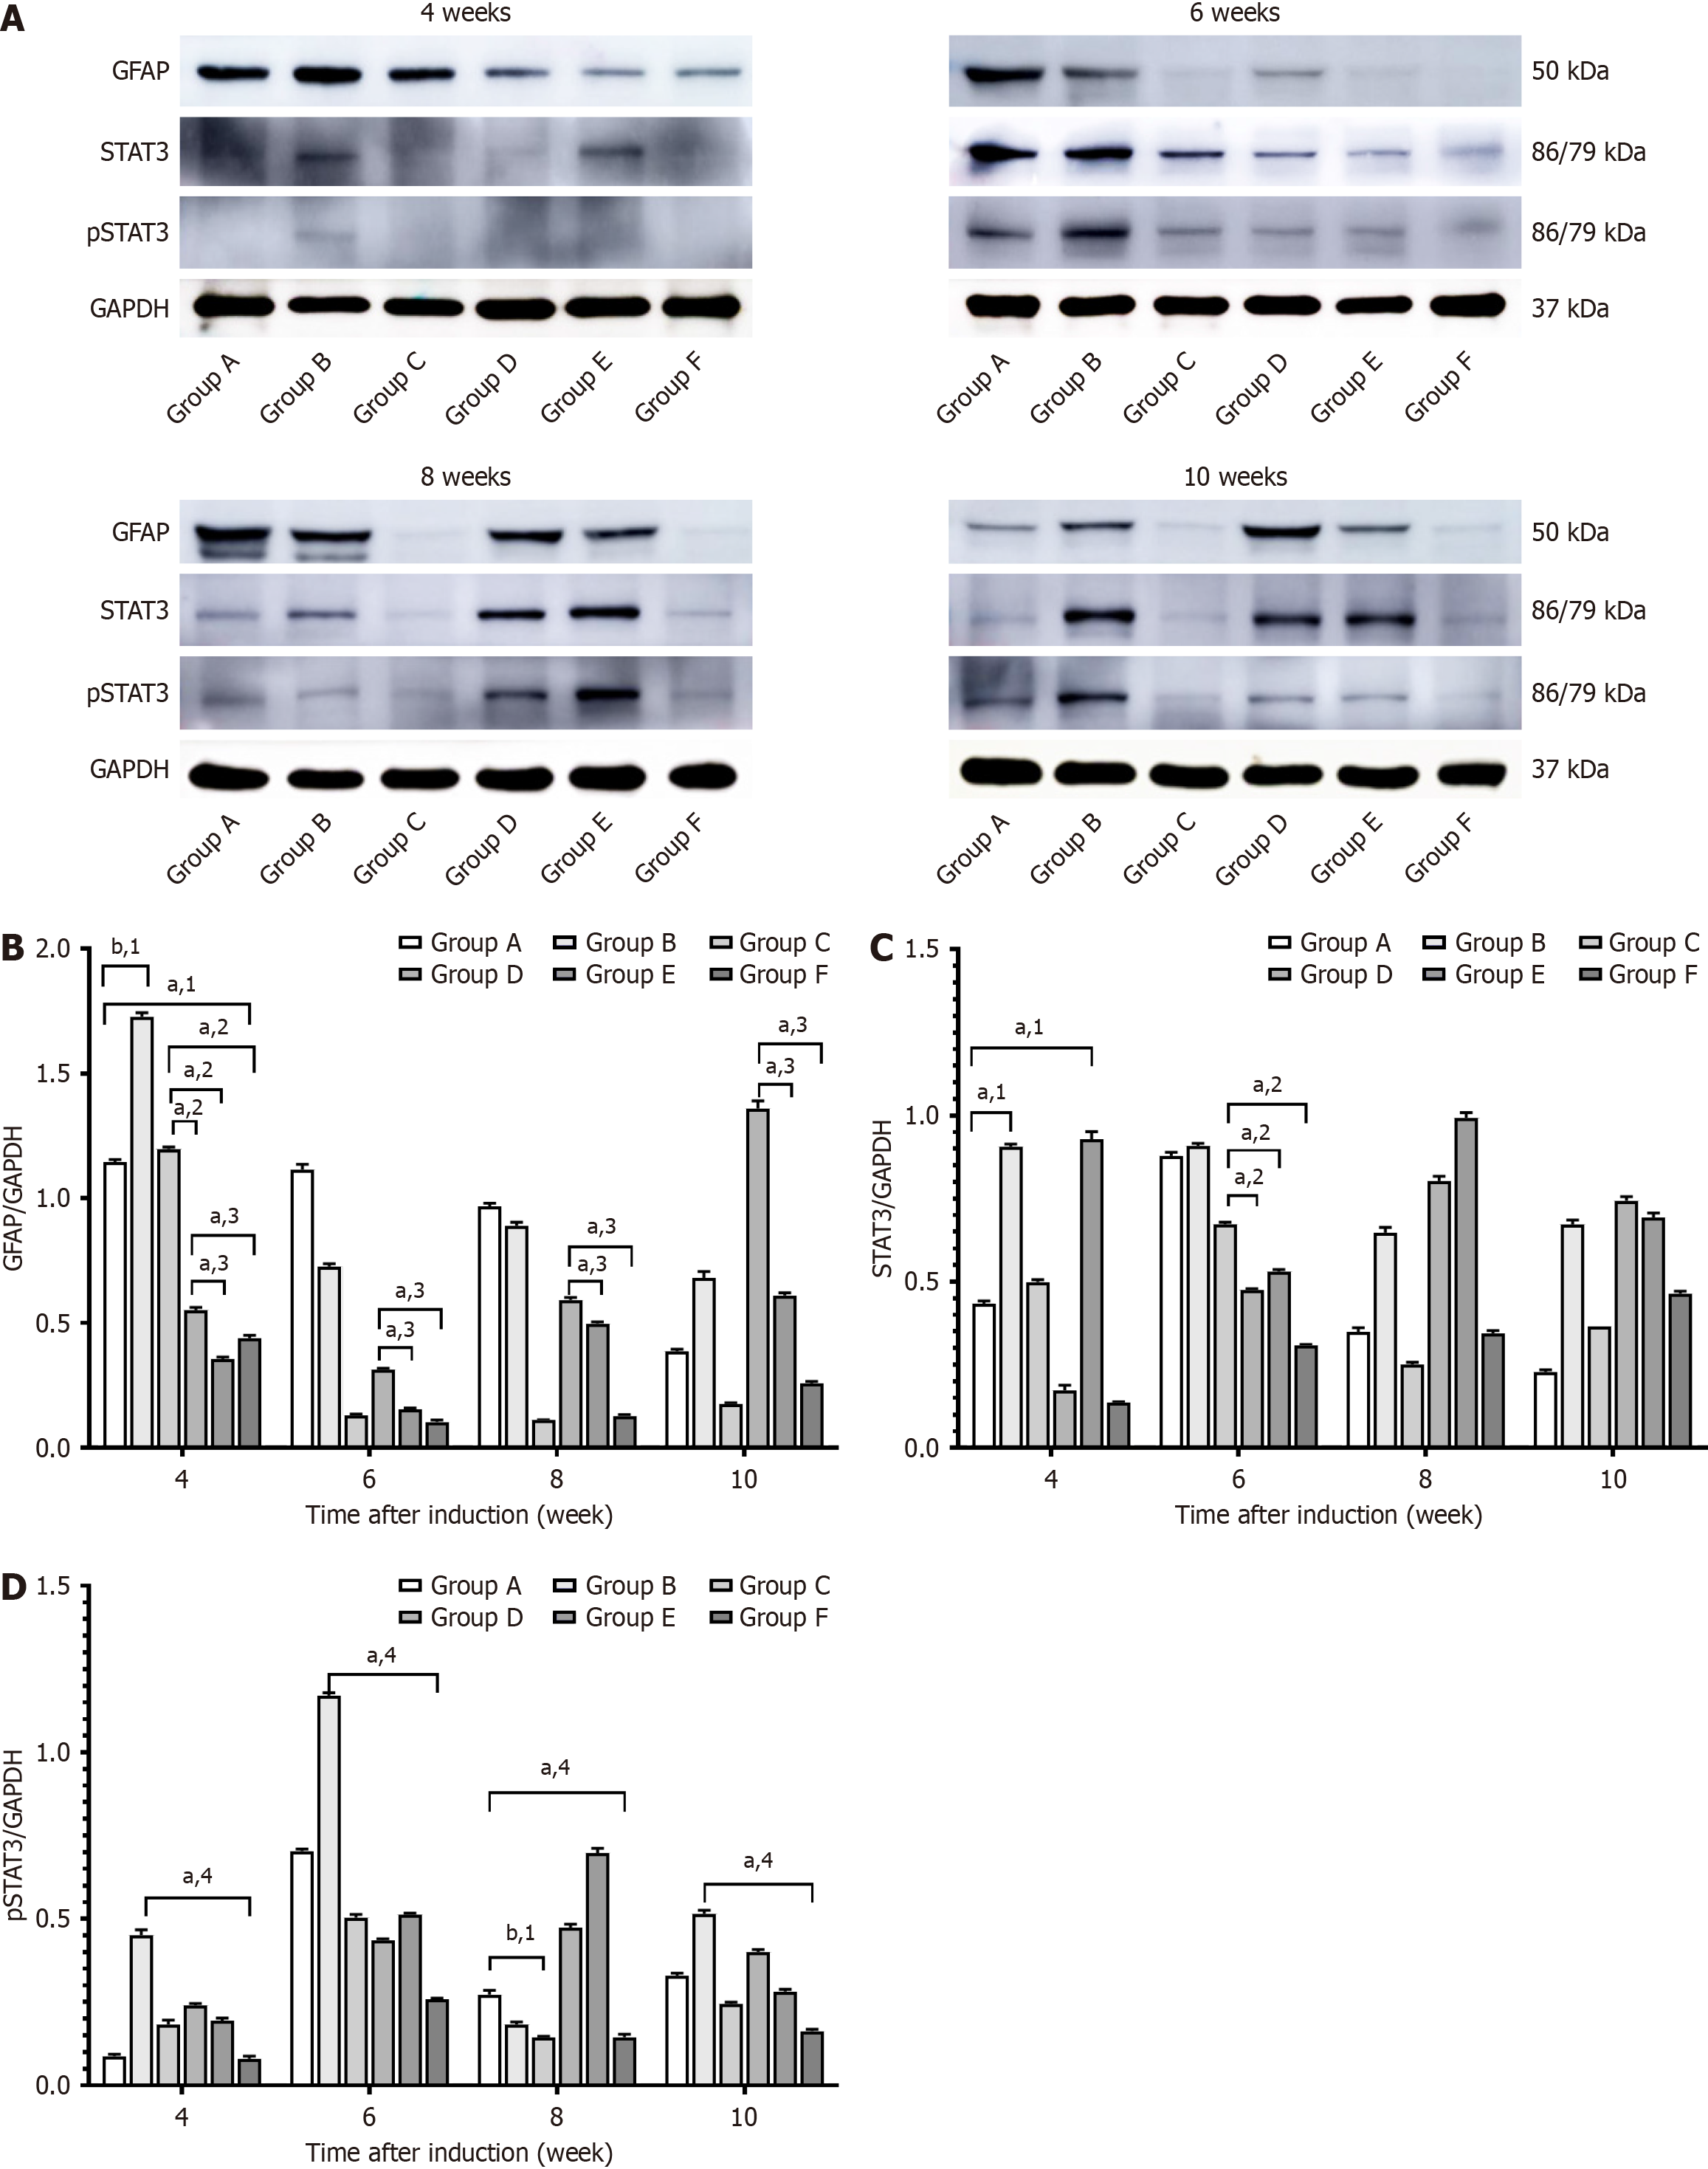
GFAP, STAT3, and pSTAT3 protein expression was measured by Western blotting (Figure 10). GFAP protein expression was consistently high in Group D throughout the 10 week observation period and significantly higher than in Groups E and F at all time points (P < 0.05). Comparatively, GFAP protein expression in Group C was only high during the fourth week, but it was significantly higher than in Groups D, E, and F at this time point (P < 0.05). GFAP protein expression in Groups A and B showed a significant increase by the fourth week and remained high for the duration of the study (P < 0.05).
STAT3 protein expression in Group D gradually increased with disease progression. During the fourth week, STAT3 protein expression was significantly lower in Group A than in Groups B, D, and E (P < 0.05). However, as the disease progressed, the pSTAT3 protein levels in Groups A and B were higher and showed more variations than in Groups C and F at the same time points (P < 0.05).
DR, a major ocular complication of diabetes, significantly impacts global health[20]. The mechanisms underlying its development and progression are complex and poorly understood[21]. Further elucidation of these mechanisms may aid in mitigating the progression of DR. Glucose-treated RPE cells and HRMECs are commonly used as a model for investigating DR[22]. Several studies have demonstrated that retinal microvascular damage is associated with the upregulation of various cytokines, such as IL-6, TNF-α, VEGF, CD18, and ICAM-1[23,24]. We detected the increased expression of these factors under high-glucose conditions in both ARPE-19 cells and HRMECs. The introduction of ranibizumab partially reduced their expression.
Studies have also shown that retinal neuronal dysfunction occurs prior to the onset of microvascular lesions in DR[25]. We observed a gradual decrease in RGC number in SD rats over time. Low RGC counts are associated with various degenerative eye diseases, such as DR and glaucoma[26]. While the specific molecular mechanisms underlying RGC pathologies remain unclear, inflammation, oxidative stress, and advanced glycation end products are theorized to be the primary culprits in DR[27].
The morphological changes in early DR include retinal alterations, such as pericyte loss, endothelial cell apoptosis, increased vascular permeability, and capillary dropout[28,29]. Pericyte loss is typically the earliest observed change, we theorize that pericyte loss occurs secondary to the inflammation and metabolic disturbances observed in high-glucose states. Pericyte loss then leads to increased retinal vasculature instability and permeability, as well as endothelial cell injury and apoptosis[30,31]. We theorize that pericyte loss occurs secondary to the inflammation and metabolic disturbances observed in high-glucose states. Pericyte loss then leads to increased retinal vasculature instability and permeability, as well as endothelial cell injury and apoptosis. In our study, diabetic rats showed an increase in the endothelial/pericyte ratio, acellular capillary count, and anti-IV + collagenous strand numbers after 4 weeks of successful modeling, which was stabilized by week 10. Vascular leakage and neovascular buds were observed in weeks 8 and 10.
GFAP is significantly upregulated in DR. It typically serves as a critical marker of reactive gliosis in Müller cells, which reflects the retina’s stress response to hyperglycemic environments[32]. GFAP overexpression is closely associated with Müller cells activation. It further exacerbates retinal vasculature abnormalities by inducing higher levels of inflammation and oxidative stress, which triggers retinal neurodegeneration and RGC apoptosis[14]. Studies have shown that GFAP levels are elevated during early DR. As such, changes in its serum values hold potential diagnostic value[33]. Recent work on GFAP-targeted therapies such as Müller cell suppressions or GFAP RNA inhibition, have demonstrated promising efficacy, offering novel approaches for the treatment of DR[25]. As such, GFAP seems to be an excellent molecular marker for understanding DR pathogenesis, as well as a potential therapeutic target. Future research is warranted for this.
VEGF overexpression is associated with abnormal angiogenesis and increased retinal vascular permeability, which contribute to retinal dysfunction[17]. Fluorescein (or Evans blue) studies in diabetic rat models have demonstrated a significant increase in retinal vessel permeability on day 8 (week 2) of modeling, which provides evidence that increased retinal vascular permeability occurs in early DR[34].
IL-6, a widely functional and pleiotropic cytokine, is upregulated in cases of trauma, surgery, and infection, while TNF-α is a multifunctional pro-inflammatory cytokine that plays an important role in inducing inflammatory reactions and diabetes. CD18, a type I transmembrane protein in the integrin superfamily, is involved in mediating inflammatory functions like leukocyte adhesion. CD18 mRNA expression in the retinal tissues of diabetic rats began to increase a week after successful modeling[20]. STAT3, a member of the signal transducer and activator of transcription family, is involved in the development of DR and exists as an inactive monomer in the cytoplasm of various cells, mediating cell proliferation and angiogenesis[35]. After phosphorylation, the monomeric form of STAT3 aggregates and translocates to the nucleus, upregulating the expression of multiple signaling pathway-related factors in cells[36]. VEGF and IL-6 activate STAT3, but STAT3 can likewise mediate the expression of VEGF, IL-6, ICAM-1, and TNF-α. Collectively, these molecules participate in the development and progression of DR[7,9].
IL-6, CD18, ICAM, TN-α, and STAT3 levels change as DR progresses. Our study aimed to further understand the molecular mechanisms behind early DR. After 4 weeks of successful modeling, we found no differences in the expression of VEGF, IL-6, ICAM, TNF-α, and STAT3 mRNA in the retinal tissue of SD rats in Groups D and E. The vitreal VF-A concentration in these groups were also similar. By contrast, Group D showed lower CD18 mRNA levels compared to Group E, which indicated that intravitreal ranibizumab had no significant effect on cytokine expression immediately after injection.
DR is an important sequelae of DM. In most cases, it can be prevented, treated, or controlled by insulin therapy. However, if left unchecked, severe cases can lead to blindness[37] after strict blood sugar control. In our study, Group C had higher RGCs, E/P ratios, acellular capillary count, vitreous VEGF-A concentrations, RGC counts, acellular capillary counts, anti-IV + collagenous strand counts, and retinal cell counts. Group C also consistently had higher mRNA expression levels of VEGF, CD18, and TNF-α compared to Groups D and E at the same time point after strict blood glucose control. In contrast and compared to Groups D and E, Group C showed higher levels of STAT3 mRNA only during the fourth week. Group C also only showed elevations of IL-6 and ICAM mRNA in the eighth week. This suggested that strict blood glucose control in Group C effectively delayed DR progression.
Ranibizumab is monoclonal antibody with a molecular weight of 48 kDa. It works by binding to and neutralizing VEGF-A, which downregulates VEGF levels in the eyes of patients with DR. Eyes with lower levels of VEGF are less likely to exhibit pathologic neovascularization, advanced DR, and blindness. In clinical practice, the half-lives of 0.5 mg ranibizumab in monkey and rabbit eyes are 2.6 and 2.9 days, respectively. These are shorter than that of bevacizumab (4.32 days in rabbit eyes) and aflibercept (3.92 days in rabbit eyes). Comparatively, the half-life of ranibizumab in human eyes is 7.19 days. In our study, Groups A and B received intravitreal injections of 1 μL ranibizumab on day 8 after su
Our study had certain limitations. Specifically, the limitation is the reliance on an animal model, which may not fully reflect the complexities of human DR. Although SD rats are commonly used in DR research, species differences in retinal structure and disease progression could impact the applicability of the findings to human patients. Therefore, clinical studies involving human subjects or human retinal tissue models are necessary to confirm the relevance and effectiveness of ranibizumab in treating DR in humans.
In conclusion, our data demonstrated that early intravitreal ranibizumab effectively regulated the VEGF/STAT3/GFAP signaling pathway in diabetic rat models. This maintained vitreous VEGF concentration levels at normal values, as well as downregulated VEGF, IL-6, CD18, ICAM, and TNF-α mRNA expression and upregulated STAT3 mRNA expression. Inhibition of STAT3 protein upregulated GFAP and pSTAT3 protein levels, which increased the number of RGCs and maintained the retinal vascular network system. All these contributed to effectively delaying the progression of DR.
Retinal neurofunctional impairment and microvascular changes are evident in early DR. Intravitreal injection of ranibizumab has been shown to mediate the expression of various cytokines through the VEGF/STAT3/GFAP signaling pathway, which promotes retinal neuronal and vascular repair and delays DR progression. Combining intravitreal ranibizumab with glycemic control seems to provide even stronger protection against DR progression. These findings highlight the potential clinical significance of early interventions that target the VEGF pathway and offers new therapeutic strategies for the management and prevention of DR progression.
| 1. | NCD Risk Factor Collaboration (NCD-RisC). Worldwide trends in diabetes prevalence and treatment from 1990 to 2022: a pooled analysis of 1108 population-representative studies with 141 million participants. Lancet. 2024;404:2077-2093. [RCA] [PubMed] [DOI] [Full Text] [Full Text (PDF)] [Cited by in Crossref: 196] [Cited by in RCA: 132] [Article Influence: 132.0] [Reference Citation Analysis (0)] |
| 2. | Antonetti DA, Silva PS, Stitt AW. Current understanding of the molecular and cellular pathology of diabetic retinopathy. Nat Rev Endocrinol. 2021;17:195-206. [RCA] [PubMed] [DOI] [Full Text] [Cited by in Crossref: 259] [Cited by in RCA: 318] [Article Influence: 79.5] [Reference Citation Analysis (0)] |
| 3. | Kwan CC, Fawzi AA. Imaging and Biomarkers in Diabetic Macular Edema and Diabetic Retinopathy. Curr Diab Rep. 2019;19:95. [RCA] [PubMed] [DOI] [Full Text] [Cited by in Crossref: 54] [Cited by in RCA: 65] [Article Influence: 10.8] [Reference Citation Analysis (0)] |
| 4. | Antar SA, Ashour NA, Sharaky M, Khattab M, Ashour NA, Zaid RT, Roh EJ, Elkamhawy A, Al-Karmalawy AA. Diabetes mellitus: Classification, mediators, and complications; A gate to identify potential targets for the development of new effective treatments. Biomed Pharmacother. 2023;168:115734. [RCA] [PubMed] [DOI] [Full Text] [Cited by in RCA: 125] [Reference Citation Analysis (0)] |
| 5. | Semeraro F, Morescalchi F, Cancarini A, Russo A, Rezzola S, Costagliola C. Diabetic retinopathy, a vascular and inflammatory disease: Therapeutic implications. Diabetes Metab. 2019;45:517-527. [RCA] [PubMed] [DOI] [Full Text] [Cited by in Crossref: 77] [Cited by in RCA: 129] [Article Influence: 21.5] [Reference Citation Analysis (0)] |
| 6. | Tang L, Xu GT, Zhang JF. Inflammation in diabetic retinopathy: possible roles in pathogenesis and potential implications for therapy. Neural Regen Res. 2023;18:976-982. [RCA] [PubMed] [DOI] [Full Text] [Full Text (PDF)] [Cited by in Crossref: 1] [Cited by in RCA: 119] [Article Influence: 39.7] [Reference Citation Analysis (0)] |
| 7. | Sun X, Lu Y, Lei T. TPTEP1 suppresses high glucose-induced dysfunction in retinal vascular endothelial cells by interacting with STAT3 and targeting VEGFA. Acta Diabetol. 2021;58:759-769. [RCA] [PubMed] [DOI] [Full Text] [Cited by in Crossref: 6] [Cited by in RCA: 11] [Article Influence: 2.8] [Reference Citation Analysis (0)] |
| 8. | Yun JH, Park SW, Kim KJ, Bae JS, Lee EH, Paek SH, Kim SU, Ye S, Kim JH, Cho CH. Endothelial STAT3 Activation Increases Vascular Leakage Through Downregulating Tight Junction Proteins: Implications for Diabetic Retinopathy. J Cell Physiol. 2017;232:1123-1134. [RCA] [PubMed] [DOI] [Full Text] [Cited by in Crossref: 68] [Cited by in RCA: 95] [Article Influence: 10.6] [Reference Citation Analysis (0)] |
| 9. | Vanlandingham PA, Nuno DJ, Quiambao AB, Phelps E, Wassel RA, Ma JX, Farjo KM, Farjo RA. Inhibition of Stat3 by a Small Molecule Inhibitor Slows Vision Loss in a Rat Model of Diabetic Retinopathy. Invest Ophthalmol Vis Sci. 2017;58:2095-2105. [RCA] [PubMed] [DOI] [Full Text] [Full Text (PDF)] [Cited by in Crossref: 9] [Cited by in RCA: 13] [Article Influence: 1.6] [Reference Citation Analysis (0)] |
| 10. | Huang C, Zhang X, Wu M, Yang C, Ge X, Chen W, Li X, Liu S, Yang S. IL-1β-induced pericyte dysfunction with a secretory phenotype exacerbates retinal microenvironment inflammation via Hes1/STAT3 signaling pathway. Int Immunopharmacol. 2025;144:113611. [RCA] [PubMed] [DOI] [Full Text] [Cited by in RCA: 1] [Reference Citation Analysis (0)] |
| 11. | Augustine J, Pavlou S, Harkin K, Stitt AW, Xu H, Chen M. IL-33 regulates Müller cell-mediated retinal inflammation and neurodegeneration in diabetic retinopathy. Dis Model Mech. 2023;16. [RCA] [PubMed] [DOI] [Full Text] [Cited by in RCA: 15] [Reference Citation Analysis (0)] |
| 12. | Curtis TM, Hamilton R, Yong PH, McVicar CM, Berner A, Pringle R, Uchida K, Nagai R, Brockbank S, Stitt AW. Müller glial dysfunction during diabetic retinopathy in rats is linked to accumulation of advanced glycation end-products and advanced lipoxidation end-products. Diabetologia. 2011;54:690-698. [RCA] [PubMed] [DOI] [Full Text] [Cited by in Crossref: 90] [Cited by in RCA: 91] [Article Influence: 6.5] [Reference Citation Analysis (0)] |
| 13. | Shan Y, Gao X, Zhao K, Xu C, Li H, Hu Y, Lin W, Ma X, Xu Q, Kuang H, Hao M. Liraglutide intervention improves high-glucose-induced reactive gliosis of Müller cells and ECM dysregulation. Mol Cell Endocrinol. 2023;576:112013. [RCA] [PubMed] [DOI] [Full Text] [Cited by in RCA: 1] [Reference Citation Analysis (0)] |
| 14. | Picconi F, Parravano M, Sciarretta F, Fulci C, Nali M, Frontoni S, Varano M, Caccuri AM. Activation of retinal Müller cells in response to glucose variability. Endocrine. 2019;65:542-549. [RCA] [PubMed] [DOI] [Full Text] [Cited by in Crossref: 31] [Cited by in RCA: 39] [Article Influence: 6.5] [Reference Citation Analysis (0)] |
| 15. | Mitsuhashi J, Morikawa S, Shimizu K, Ezaki T, Yasuda Y, Hori S. Intravitreal injection of erythropoietin protects against retinal vascular regression at the early stage of diabetic retinopathy in streptozotocin-induced diabetic rats. Exp Eye Res. 2013;106:64-73. [RCA] [PubMed] [DOI] [Full Text] [Cited by in Crossref: 27] [Cited by in RCA: 29] [Article Influence: 2.4] [Reference Citation Analysis (0)] |
| 16. | Ayalasomayajula SP, Kompella UB. Celecoxib, a selective cyclooxygenase-2 inhibitor, inhibits retinal vascular endothelial growth factor expression and vascular leakage in a streptozotocin-induced diabetic rat model. Eur J Pharmacol. 2003;458:283-289. [RCA] [PubMed] [DOI] [Full Text] [Cited by in Crossref: 107] [Cited by in RCA: 115] [Article Influence: 5.2] [Reference Citation Analysis (0)] |
| 17. | Xu L, Kanasaki K, Kitada M, Koya D. Diabetic angiopathy and angiogenic defects. Fibrogenesis Tissue Repair. 2012;5:13. [RCA] [PubMed] [DOI] [Full Text] [Full Text (PDF)] [Cited by in Crossref: 27] [Cited by in RCA: 40] [Article Influence: 3.1] [Reference Citation Analysis (0)] |
| 18. | Xiao A, Zhou Q, Shao Y, Zhong HF. Effect of intravitreal injection of ranibizumab on retinal ganglion cells and microvessels in the early stage of diabetic retinopathy in rats with streptozotocin-induced diabetes. Exp Ther Med. 2017;13:3360-3368. [RCA] [PubMed] [DOI] [Full Text] [Full Text (PDF)] [Cited by in Crossref: 5] [Cited by in RCA: 6] [Article Influence: 0.8] [Reference Citation Analysis (0)] |
| 19. | Cloutier F, Lawrence M, Goody R, Lamoureux S, Al-Mahmood S, Colin S, Ferry A, Conduzorgues JP, Hadri A, Cursiefen C, Udaondo P, Viaud E, Thorin E, Chemtob S. Antiangiogenic activity of aganirsen in nonhuman primate and rodent models of retinal neovascular disease after topical administration. Invest Ophthalmol Vis Sci. 2012;53:1195-1203. [RCA] [PubMed] [DOI] [Full Text] [Cited by in Crossref: 33] [Cited by in RCA: 38] [Article Influence: 2.9] [Reference Citation Analysis (0)] |
| 20. | Tan TE, Wong TY. Diabetic retinopathy: Looking forward to 2030. Front Endocrinol (Lausanne). 2022;13:1077669. [RCA] [PubMed] [DOI] [Full Text] [Full Text (PDF)] [Cited by in Crossref: 1] [Cited by in RCA: 184] [Article Influence: 61.3] [Reference Citation Analysis (0)] |
| 21. | Zhou J, Chen B. Retinal Cell Damage in Diabetic Retinopathy. Cells. 2023;12. [RCA] [PubMed] [DOI] [Full Text] [Full Text (PDF)] [Cited by in Crossref: 21] [Cited by in RCA: 40] [Article Influence: 20.0] [Reference Citation Analysis (0)] |
| 22. | Zhang Y, Xi X, Mei Y, Zhao X, Zhou L, Ma M, Liu S, Zha X, Yang Y. High-glucose induces retinal pigment epithelium mitochondrial pathways of apoptosis and inhibits mitophagy by regulating ROS/PINK1/Parkin signal pathway. Biomed Pharmacother. 2019;111:1315-1325. [RCA] [PubMed] [DOI] [Full Text] [Cited by in Crossref: 48] [Cited by in RCA: 122] [Article Influence: 20.3] [Reference Citation Analysis (0)] |
| 23. | Barone V, Surico PL, Cutrupi F, Mori T, Gallo Afflitto G, Di Zazzo A, Coassin M. The Role of Immune Cells and Signaling Pathways in Diabetic Eye Disease: A Comprehensive Review. Biomedicines. 2024;12. [RCA] [PubMed] [DOI] [Full Text] [Cited by in RCA: 4] [Reference Citation Analysis (0)] |
| 24. | Sheng X, Zhang C, Zhao J, Xu J, Zhang P, Ding Q, Zhang J. Microvascular destabilization and intricated network of the cytokines in diabetic retinopathy: from the perspective of cellular and molecular components. Cell Biosci. 2024;14:85. [RCA] [PubMed] [DOI] [Full Text] [Cited by in RCA: 4] [Reference Citation Analysis (0)] |
| 25. | Yang S, Qi S, Wang C. The role of retinal Müller cells in diabetic retinopathy and related therapeutic advances. Front Cell Dev Biol. 2022;10:1047487. [RCA] [PubMed] [DOI] [Full Text] [Cited by in Crossref: 3] [Cited by in RCA: 27] [Article Influence: 9.0] [Reference Citation Analysis (0)] |
| 26. | Potilinski MC, Lorenc V, Perisset S, Gallo JE. Mechanisms behind Retinal Ganglion Cell Loss in Diabetes and Therapeutic Approach. Int J Mol Sci. 2020;21. [RCA] [PubMed] [DOI] [Full Text] [Full Text (PDF)] [Cited by in Crossref: 11] [Cited by in RCA: 37] [Article Influence: 7.4] [Reference Citation Analysis (0)] |
| 27. | Kang Q, Dai H, Jiang S, Yu L. Advanced glycation end products in diabetic retinopathy and phytochemical therapy. Front Nutr. 2022;9:1037186. [RCA] [PubMed] [DOI] [Full Text] [Full Text (PDF)] [Cited by in Crossref: 7] [Cited by in RCA: 27] [Article Influence: 9.0] [Reference Citation Analysis (0)] |
| 28. | Wang W, Lo ACY. Diabetic Retinopathy: Pathophysiology and Treatments. Int J Mol Sci. 2018;19. [RCA] [PubMed] [DOI] [Full Text] [Full Text (PDF)] [Cited by in Crossref: 327] [Cited by in RCA: 743] [Article Influence: 106.1] [Reference Citation Analysis (0)] |
| 29. | Kern TS, Antonetti DA, Smith LEH. Pathophysiology of Diabetic Retinopathy: Contribution and Limitations of Laboratory Research. Ophthalmic Res. 2019;62:196-202. [RCA] [PubMed] [DOI] [Full Text] [Cited by in Crossref: 26] [Cited by in RCA: 28] [Article Influence: 4.7] [Reference Citation Analysis (0)] |
| 30. | Stitt AW, Lois N, Medina RJ, Adamson P, Curtis TM. Advances in our understanding of diabetic retinopathy. Clin Sci (Lond). 2013;125:1-17. [RCA] [PubMed] [DOI] [Full Text] [Cited by in Crossref: 132] [Cited by in RCA: 132] [Article Influence: 11.0] [Reference Citation Analysis (0)] |
| 31. | Spencer BG, Estevez JJ, Liu E, Craig JE, Finnie JW. Pericytes, inflammation, and diabetic retinopathy. Inflammopharmacology. 2020;28:697-709. [RCA] [PubMed] [DOI] [Full Text] [Cited by in Crossref: 22] [Cited by in RCA: 71] [Article Influence: 11.8] [Reference Citation Analysis (0)] |
| 32. | Bahr HI, Abdelghany AA, Galhom RA, Barakat BM, Arafa EA, Fawzy MS. Duloxetine protects against experimental diabetic retinopathy in mice through retinal GFAP downregulation and modulation of neurotrophic factors. Exp Eye Res. 2019;186:107742. [RCA] [PubMed] [DOI] [Full Text] [Cited by in Crossref: 16] [Cited by in RCA: 16] [Article Influence: 2.7] [Reference Citation Analysis (0)] |
| 33. | Hernández C, Simó-Servat O, Porta M, Grauslund J, Harding SP, Frydkjaer-Olsen U, García-Arumí J, Ribeiro L, Scanlon P, Cunha-Vaz J, Simó R; European Consortium for the Early Treatment of Diabetic Retinopathy (EUROCONDOR). Serum glial fibrillary acidic protein and neurofilament light chain as biomarkers of retinal neurodysfunction in early diabetic retinopathy: results of the EUROCONDOR study. Acta Diabetol. 2023;60:837-844. [RCA] [PubMed] [DOI] [Full Text] [Cited by in RCA: 8] [Reference Citation Analysis (0)] |
| 34. | Pomeroy B, Venanzi AW, Li W, Hackam AS, Abdulreda MH. Fluorescence Angiography with Dual Fluorescence for the Early Detection and Longitudinal Quantitation of Vascular Leakage in Retinopathy. Biomedicines. 2023;11. [RCA] [PubMed] [DOI] [Full Text] [Cited by in RCA: 2] [Reference Citation Analysis (0)] |
| 35. | Zou S, Tong Q, Liu B, Huang W, Tian Y, Fu X. Targeting STAT3 in Cancer Immunotherapy. Mol Cancer. 2020;19:145. [RCA] [PubMed] [DOI] [Full Text] [Full Text (PDF)] [Cited by in Crossref: 335] [Cited by in RCA: 677] [Article Influence: 135.4] [Reference Citation Analysis (0)] |
| 36. | Golus M, Bugajski P, Chorbińska J, Krajewski W, Lemiński A, Saczko J, Kulbacka J, Szydełko T, Małkiewicz B. STAT3 and Its Pathways' Dysregulation-Underestimated Role in Urological Tumors. Cells. 2022;11. [RCA] [PubMed] [DOI] [Full Text] [Full Text (PDF)] [Cited by in RCA: 16] [Reference Citation Analysis (0)] |
| 37. | Chaurasia S, Thool AR, Ansari KK, Saifi AI. Advancement in Understanding Diabetic Retinopathy: A Comprehensive Review. Cureus. 2023;15:e49211. [RCA] [PubMed] [DOI] [Full Text] [Cited by in RCA: 6] [Reference Citation Analysis (0)] |
| 38. | Nakao S, Arima M, Ishikawa K, Kohno R, Kawahara S, Miyazaki M, Yoshida S, Enaida H, Hafezi-Moghadam A, Kono T, Ishibashi T. Intravitreal anti-VEGF therapy blocks inflammatory cell infiltration and re-entry into the circulation in retinal angiogenesis. Invest Ophthalmol Vis Sci. 2012;53:4323-4328. [RCA] [PubMed] [DOI] [Full Text] [Cited by in Crossref: 48] [Cited by in RCA: 55] [Article Influence: 4.2] [Reference Citation Analysis (0)] |


