Published online Sep 15, 2024. doi: 10.4239/wjd.v15.i9.1932
Revised: June 17, 2024
Accepted: July 18, 2024
Published online: September 15, 2024
Processing time: 139 Days and 6.6 Hours
Diabetes mellitus type 2 (T2DM) is formed by defective insulin secretion with the addition of peripheral tissue resistance of insulin action. It has been affecting over 400 million people all over the world.
To explore the pathogenesis of T2DM and to develop and implement new pre
Receiver operating characteristic (ROC) curve analysis was used to conduct diag
We found that NPAS2 was significantly up-regulated in islet β cell apoptosis of T2DM. The ROC curve revealed that NPAS2 was capable of accurately diagnosing T2DM. NPAS2 overexpression did increase the level of KANK1. In addition, the CCK-8 test revealed knocking down NPAS2 and KANK1 increased the proliferation of MIN6 cells. At last, we found that gastric bypass may treat type 2 diabetes by down-regulating NPAS2 and KANK1.
This study demonstrated that NPAS2 induced β cell dysfunction by regulating KANK1 expression in type 2 diabetes, and it may be an underlying therapy target of T2DM.
Core Tip: Diabetes mellitus type 2 (T2DM) is formed by defective insulin secretion with the addition of peripheral tissue resistance of insulin action. This study demonstrated that NPAS2 induced β cell dysfunction by regulating KANK1 expression in type 2 diabetes, and it may be an underlying therapy target of T2DM.
- Citation: Yin YB, Ji W, Liu YL, Gao QH, He DD, Xu SL, Fan JX, Zhang LH. cNPAS2 induced β cell dysfunction by regulating KANK1 expression in type 2 diabetes. World J Diabetes 2024; 15(9): 1932-1941
- URL: https://www.wjgnet.com/1948-9358/full/v15/i9/1932.htm
- DOI: https://dx.doi.org/10.4239/wjd.v15.i9.1932
Diabetes mellitus is mainly divided into 2 categories, type 1 diabetes is caused by autoimmune destruction of beta cells, and diabetes mellitus type 2 (T2DM) is formed by errors of insulin secretion and the addition of peripheral tissue resistance of insulin action. Both of the two types are polygenic. There are also 2%-5% of diabetes cases caused by muta
Proteins are crucial in human different biological processes, about 2500 proteins are regarded as binding to chromatin, such as DNA transcription, DNA replication, DNA repair. Moreover, there are approximately 1500 transcription factors among these proteins. Transcription factor is a specific kind of proteins which combine DNA helix at regulatory seque
The transcription factors are organized in various families reflecting homologies in their DNA-binding domains and, so are DNA-binding sequences[4,5]. They could be organized into 71 different families, some of which have more me
Here, we found that transcription factor (NPAS2) made the expression of KANK1 significantly increase in the pancreas of T2DM rats. We also explore the role of KANK1and NPAS2 in β-cell dysfunction in T2DM, which could lead to a novel strategy for the mechanism of T2DM.
In this study, we used C57BL/6J male mice (weighing 22 + 2 g, Institute of laboratory animal sciences, Beijing, China) to established the animal model. The animal investigation described in this report was approved by the Biological and Medical Research Ethics Committee of Jiamusi University (2021-0330).
We put the male mice in a temperature-controlled room with a 12-hour light/dark cycle. The high-fat diet as well as low-dose intraperitoneal injection of streptozocin (STZ) was used to create the T2DM model, as previously described. The mice were fed adaptively for one week before being randomly divided into two groups. We chose 5 10% kcal% fat diet mice(D12450B) as the normal control group and 5 60% kcal% high-fat diet mice(D12492i) as T2DM model group.
After 28 days, T2DM group was given 100 mg/kg STZ. Meanwhile, the control group also received 100 mg/kg citrate buffer. After 7 days, the tail cutting was used to test the fasting blood glucose (FBG) of mice and FBG between 7.8 and 15 mmol/L were included for analysis as diabetic cases. After feeding for 16 weeks, the mice were subjected to glucose-stimulated insulin secretion test (GSIS) and the glucose tolerance test (OGTT). Afterwards, mice were anesthetized using 100 mg/kg pentobarbital injection. The serum which was from orbital venous plexus was centrifuged for 15 minutes at 3500 g. Total cholesterol (TC), serum FBG, triglyceride (TG), and insulin, which were form Abcam, United Kingdom, were determined. The pancreas tissues from the mice was washed and half-fixed with 10% formalin, then stored at minus 80 degrees Celsius in liquid nitrogen until needed.
The procedure of Roux-en-Y gastric bypass (RYGB) surgery has been described in detail by Hao et al[8]. Briefly, created little gastric pouch with around 5 percent of the total stomach content and remained the Roux and biliopancreatic limbs 6-7 cm long. The jejunum was sliced open it’s distal end was anastomosed end-to-end with the stomach pouch. Mice in the control group performed laparotomy without severing jejunum and stomach transection. On the stomach's front wall, a simple continuous suture was employed. After surgery, all mice fasted only with tap water for one day, and for liquid food freely for 2 days.
In order to perform OGTT, mice were fasted for half a day, and took 2 g/kg of glucose dissolved in water orally. The concentration of blood glucose, which was from tail tip, was determined every 30 minutes for 2 hours. In order to perform GSIS, blood was taken from mice's ocular venous sinuses for 0 min. The stomach was then infused with 40 percent (w/v) glucose. Blood samples were taken every 15 minutes for 1 hour. Insulin ELISA kit (Merck Millipore Corporation, Germany) was used to detect insulin in serum, and we recorded and calculated the area under curve.
Islet β-cell MIN6 cells (ATCC, United States) were cultivated in DMEM (25 mmol/L glucose) containing 1% penicillin-streptomycin (PS), 10% fetal bovine serum (FBS) as well as 1% β-mercaptoethanol at 37 degrees Celsius in a 5% CO2 environment. The MIN6 cell injury model was grown in 24 well plates with 2 × 10⁴ cells per well or in six well plates with 105 cells per well. The cells were cultivated in DMEM which contained 10% FBS as well as 1% β-mercaptoethanol. Transfection started after the cells had reached 60%-70% confluence. For the first 5 minutes, we diluted plasmid, transfected mimic, as well as Lipofectamine 2000 in Opti-MEM. After that, we added the diluted plasmid and mimic to the transfection reagent for double mixing for 20 minutes. In the end, we added the double mixed solution into the culture plate well, cultivated for 4 hours in Opti-MEM without FBS, and then changed for normal DMEM (with 25 mmol/L glucose, 1% β-mercaptoethanol, 1% PS, 10% FBS) culture. All reagents were from Gibco (United States).
We seeded MIN6 cells in 96 well plates. Then we set up the blank control group as well as the treatment group with various concentrations of palmitic acid (0.1-1.0 mmol/L), as soon as the fusion degree of cells reached about 80%. Cell counting kit-8 (CCK-8) tests was used to determine the cell survival rate after 24 hours of treatment, and the ideal concentration of palmitic acid was chosen to create the MIN6 cell damage model.
We used western blot to test the protein concentration as previously reported[9]. Briefly, total protein which from MIN6 cells or pancreatic tissue was tested by BCA protein assay kit (Thermo Fisher Scientific, United States). Each specimen was isolated from twelve alkyl sulfonate polyacrylamide gel, transferred to a polyvinylidene fluoride membrane (Bio-Rad, China), then sealed with 5 percent (w/V) BSA for 2 hours. Next, membranes were detected overnight at 4 degrees Celsius with suitable primary antibodies (Caspase-3, SIRT1, β-actin). The membranes were cultured with secondary antibodies at room temperature for 2 hours after washing three times with TBST [150 mmol/L NaCl, 10 mm Tris-HCl, as well as 0.1 percent (V/V) Tween-20]. Protein bands were shown using enhanced chemiluminescence, and pictures were created using GENE Imaging system (Tannon, China).
We seeded MIN6 cells in 24 well plates. The cells were divided into groups and treated respectively as soon as the fusion degree of cells reached about 80%. After collecting the supernatant and cell protein, the insulin content in the supernatant was detected by insulin ELISA kit (Merck, Germany).
The expression levels of gene was detected by reverse transcription-PCR (RT-PCR) as previously reported[10]. Briefly, TRIzol (Merck, Germany) was used to extract the total RNAs, followed the instruction by the manufacturer. The primer was used to detect the mRNA level. One µg extracted RNA was reverse transcribed to cDNA, using the kit from Madison, United States. On an ABI 7300, RT-PCR was carried out using Fast Start universal SYBR Green Master (Roche, United States). 2-△△CT was used to evaluate the expression levels in comparison to the control.
Cell viability was detected by the CCK-8 assay as indicated by the protocol from the manufacturer. Briefly, the cells were grown in 96-well plates with appropriate amount of tumor cells. Then the varied amounts of temozolomide or a dime-thyl sulfoxide control was incubated with the cells. After that, the CCK-8 solution was supplemented into the wells. Cells were found in a microplate reader at 450 nm of absorbance.
For statistical analysis, we utilized SPSS 23.0 (SPSS, United States). The final data were presented as the average SD of three separate studies. To compare two or three groups, the Student's t-test or ANOVA were utilized, accordingly. A value of P less than 0.05 was regarded statistically significant.
Table 1 showed the amount of change in lipid-related parameters in T2DM mice. The findings showed, compared with the control group, the levels of TG (P < 0.05), low-density lipoprotein cholesterol (P < 0.05), TC (P less than 0.01) as well as FBG (P < 0.01) were remarkably increase, but the levels of fasting insulin (P < 0.05) as well as high-density lipoprotein cholesterol (P < 0.05) was significantly decreased in T2DM mice.
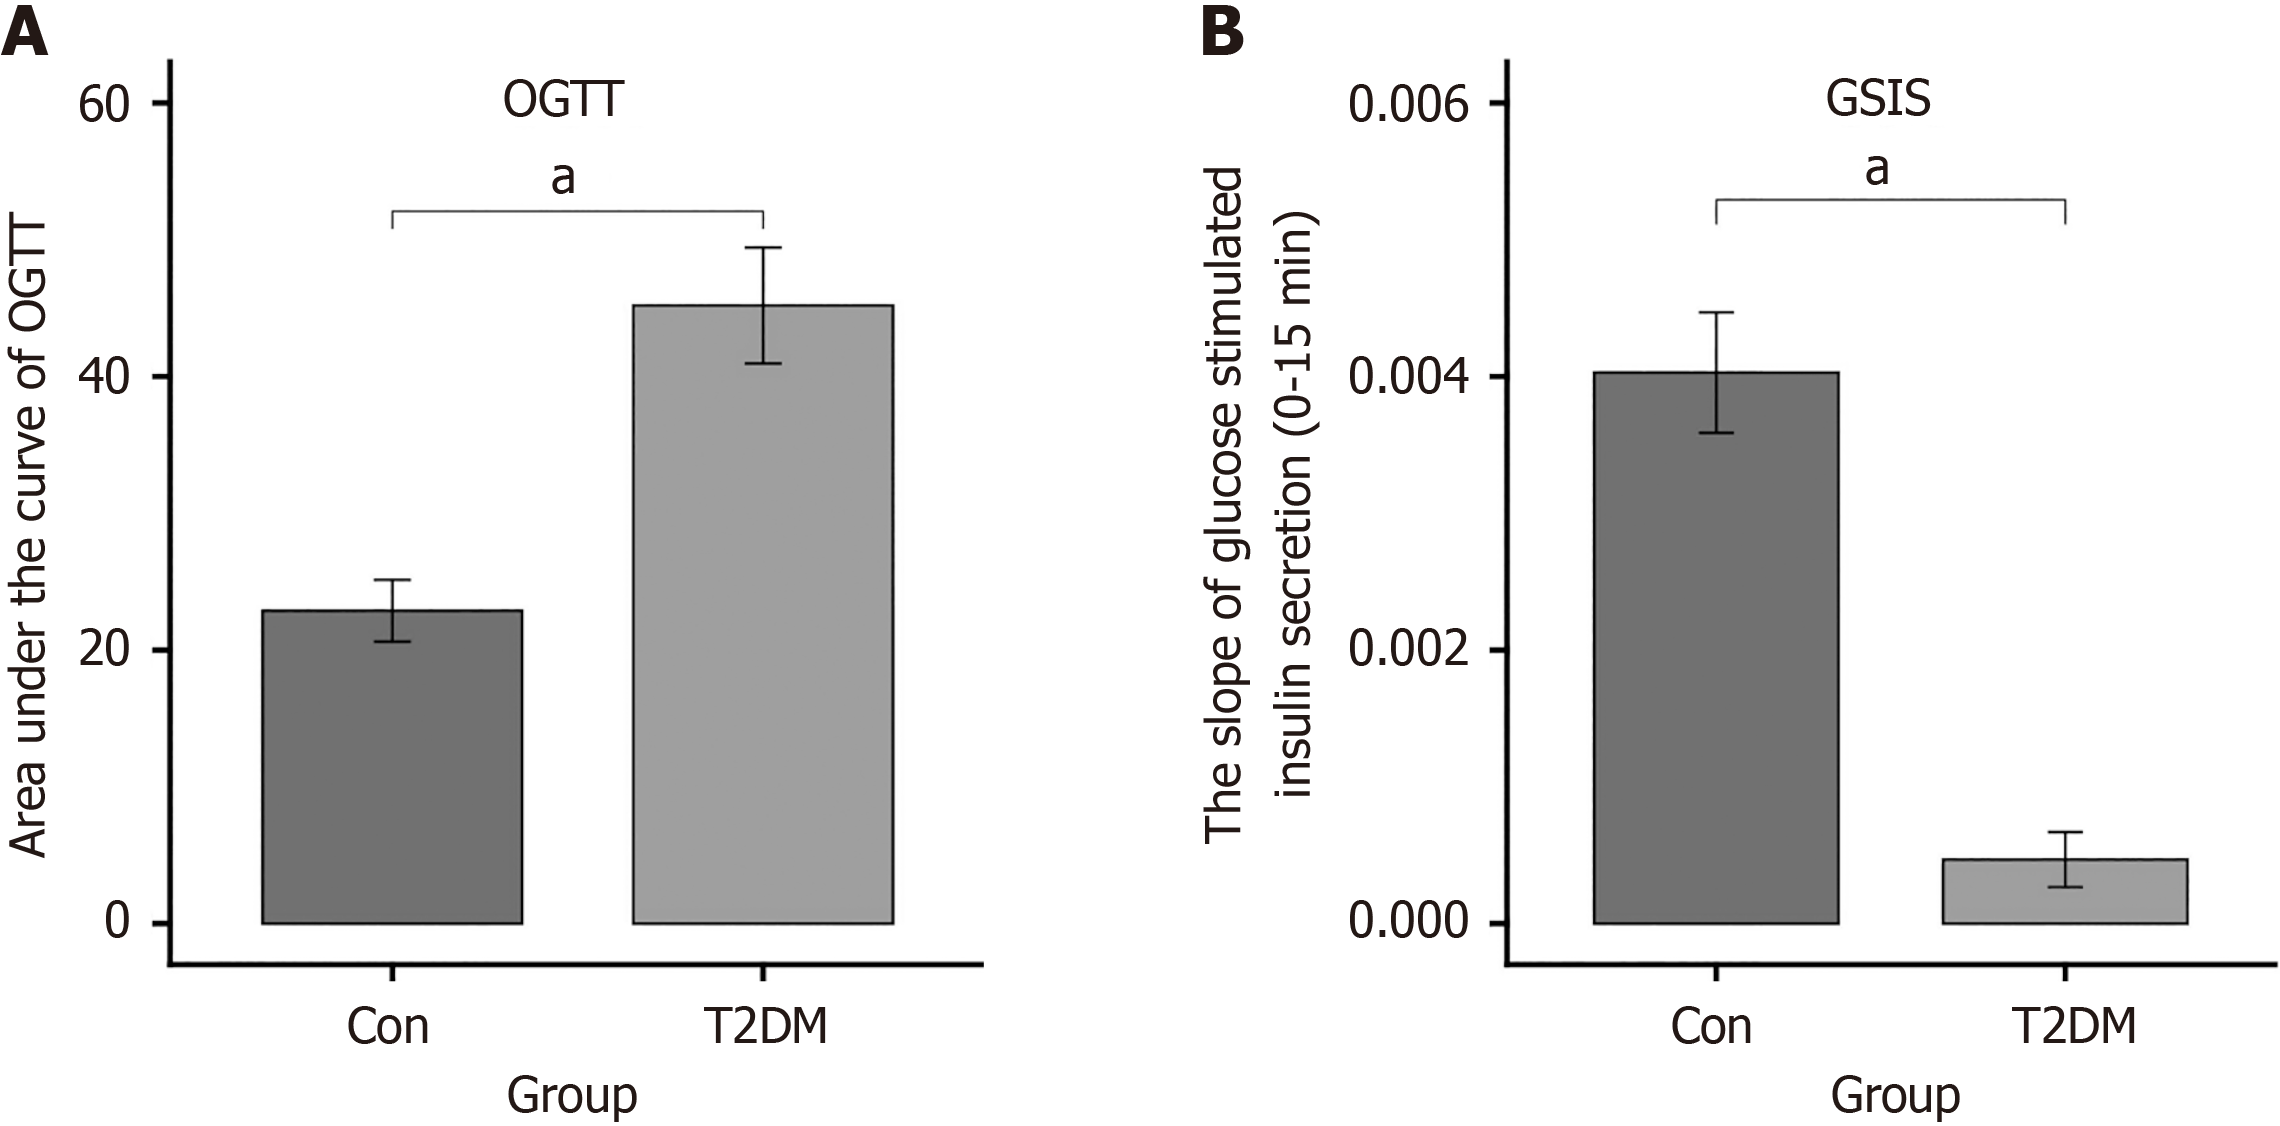
The area under the glucose concentration curve of the OGTT (P < 0.0001) as well as GSIS (P < 0.0001) showed that the glucose tolerance was damaged in the model group, and insulin secretion sensitivity was markedly reduced following glucose stimulation (Figure 1).
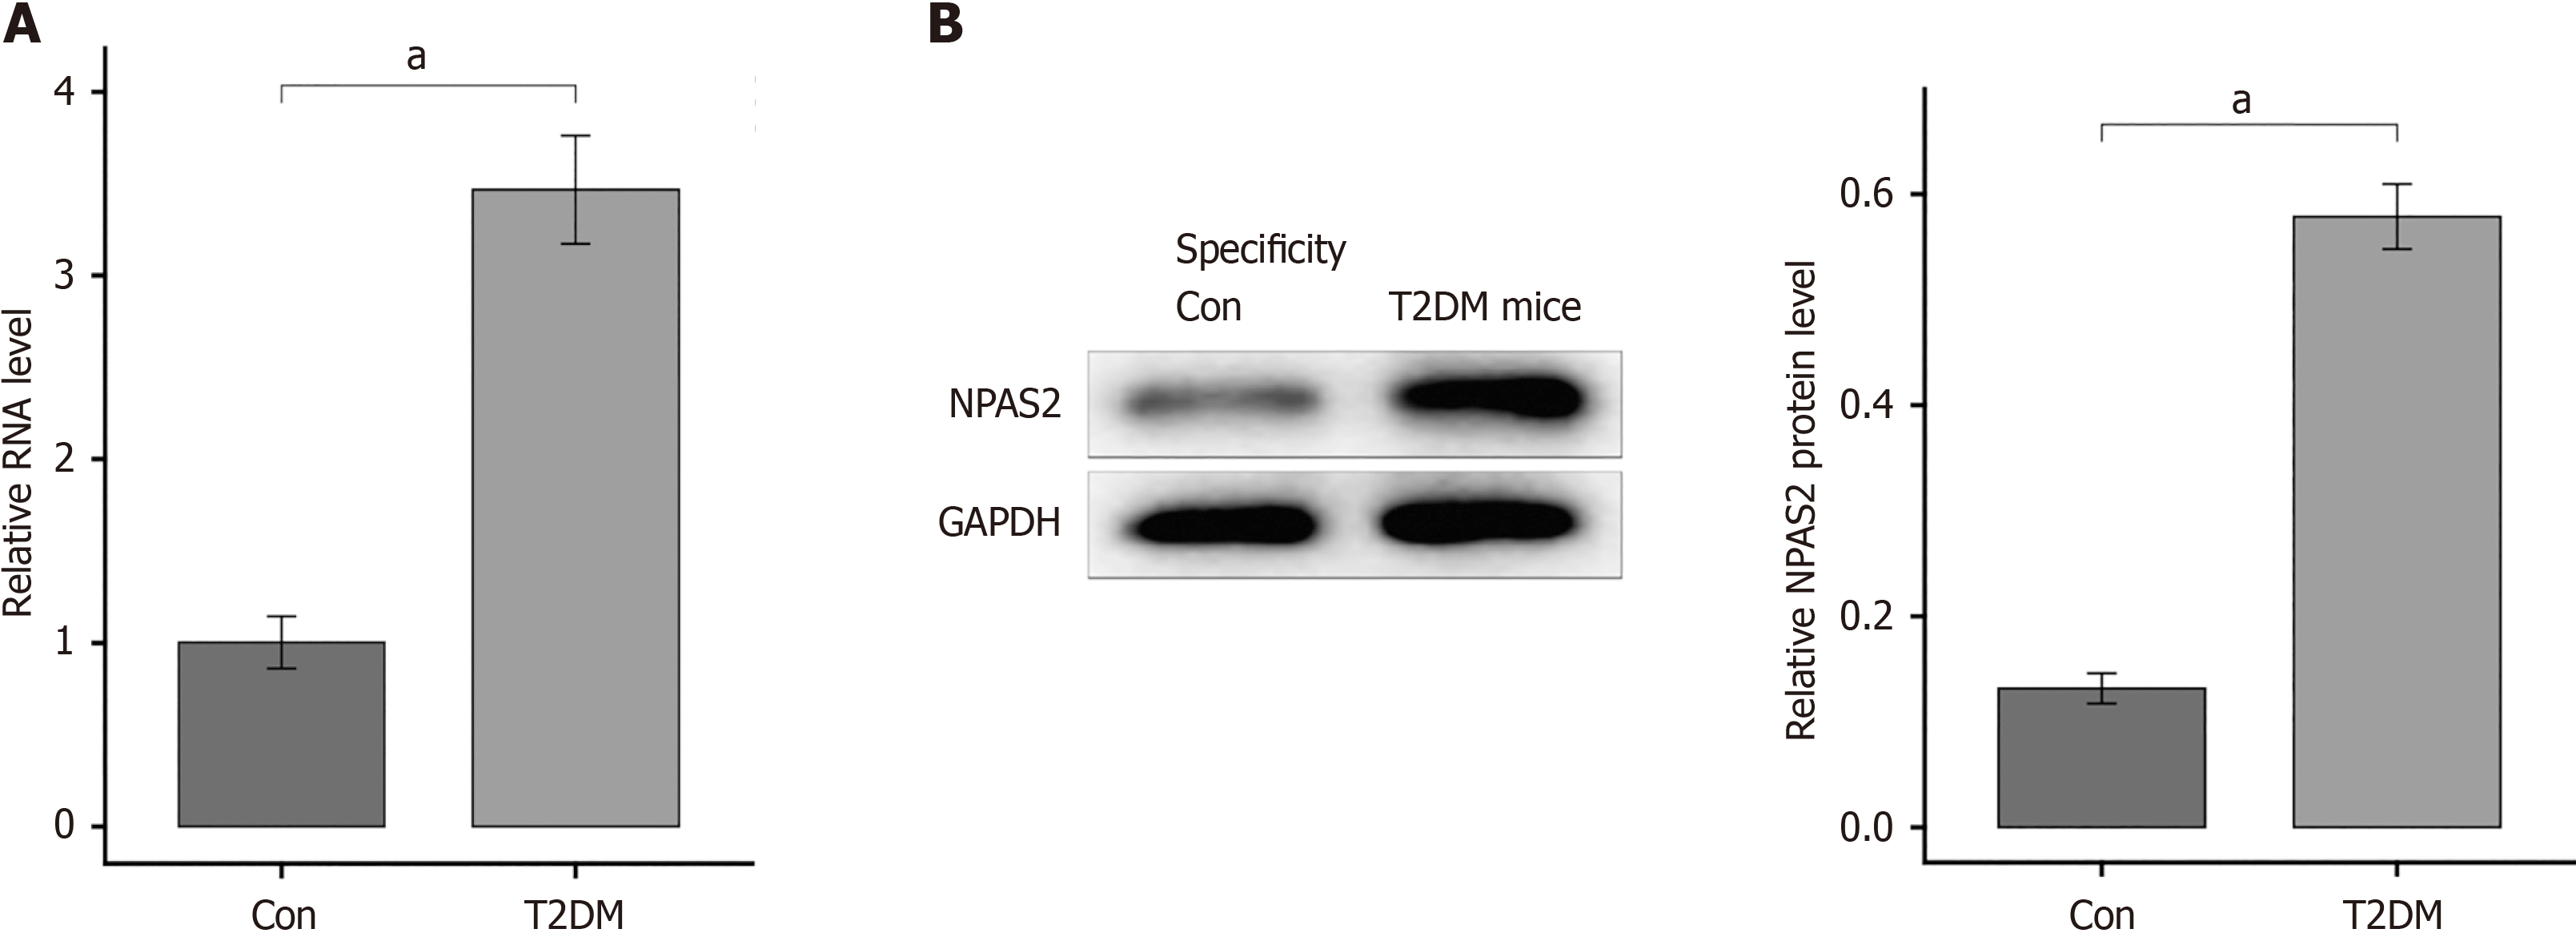
To verify if the above results were connected with NPAS2 in T2DM mice or not, the mRNA of NPAS2 in islet tissue was determined with RT-PCR. The expression of NPAS2 in β-cell of T2DM mice was notably increase compare with that in control group (P < 0.0001; Figure 2A). And western blotting showed the overexpression of NPAS2 in T2DM groups (P < 0.0001; Figure 2B). The above results show that NPAS2 was significantly up-regulated in islet β cell of T2DM.
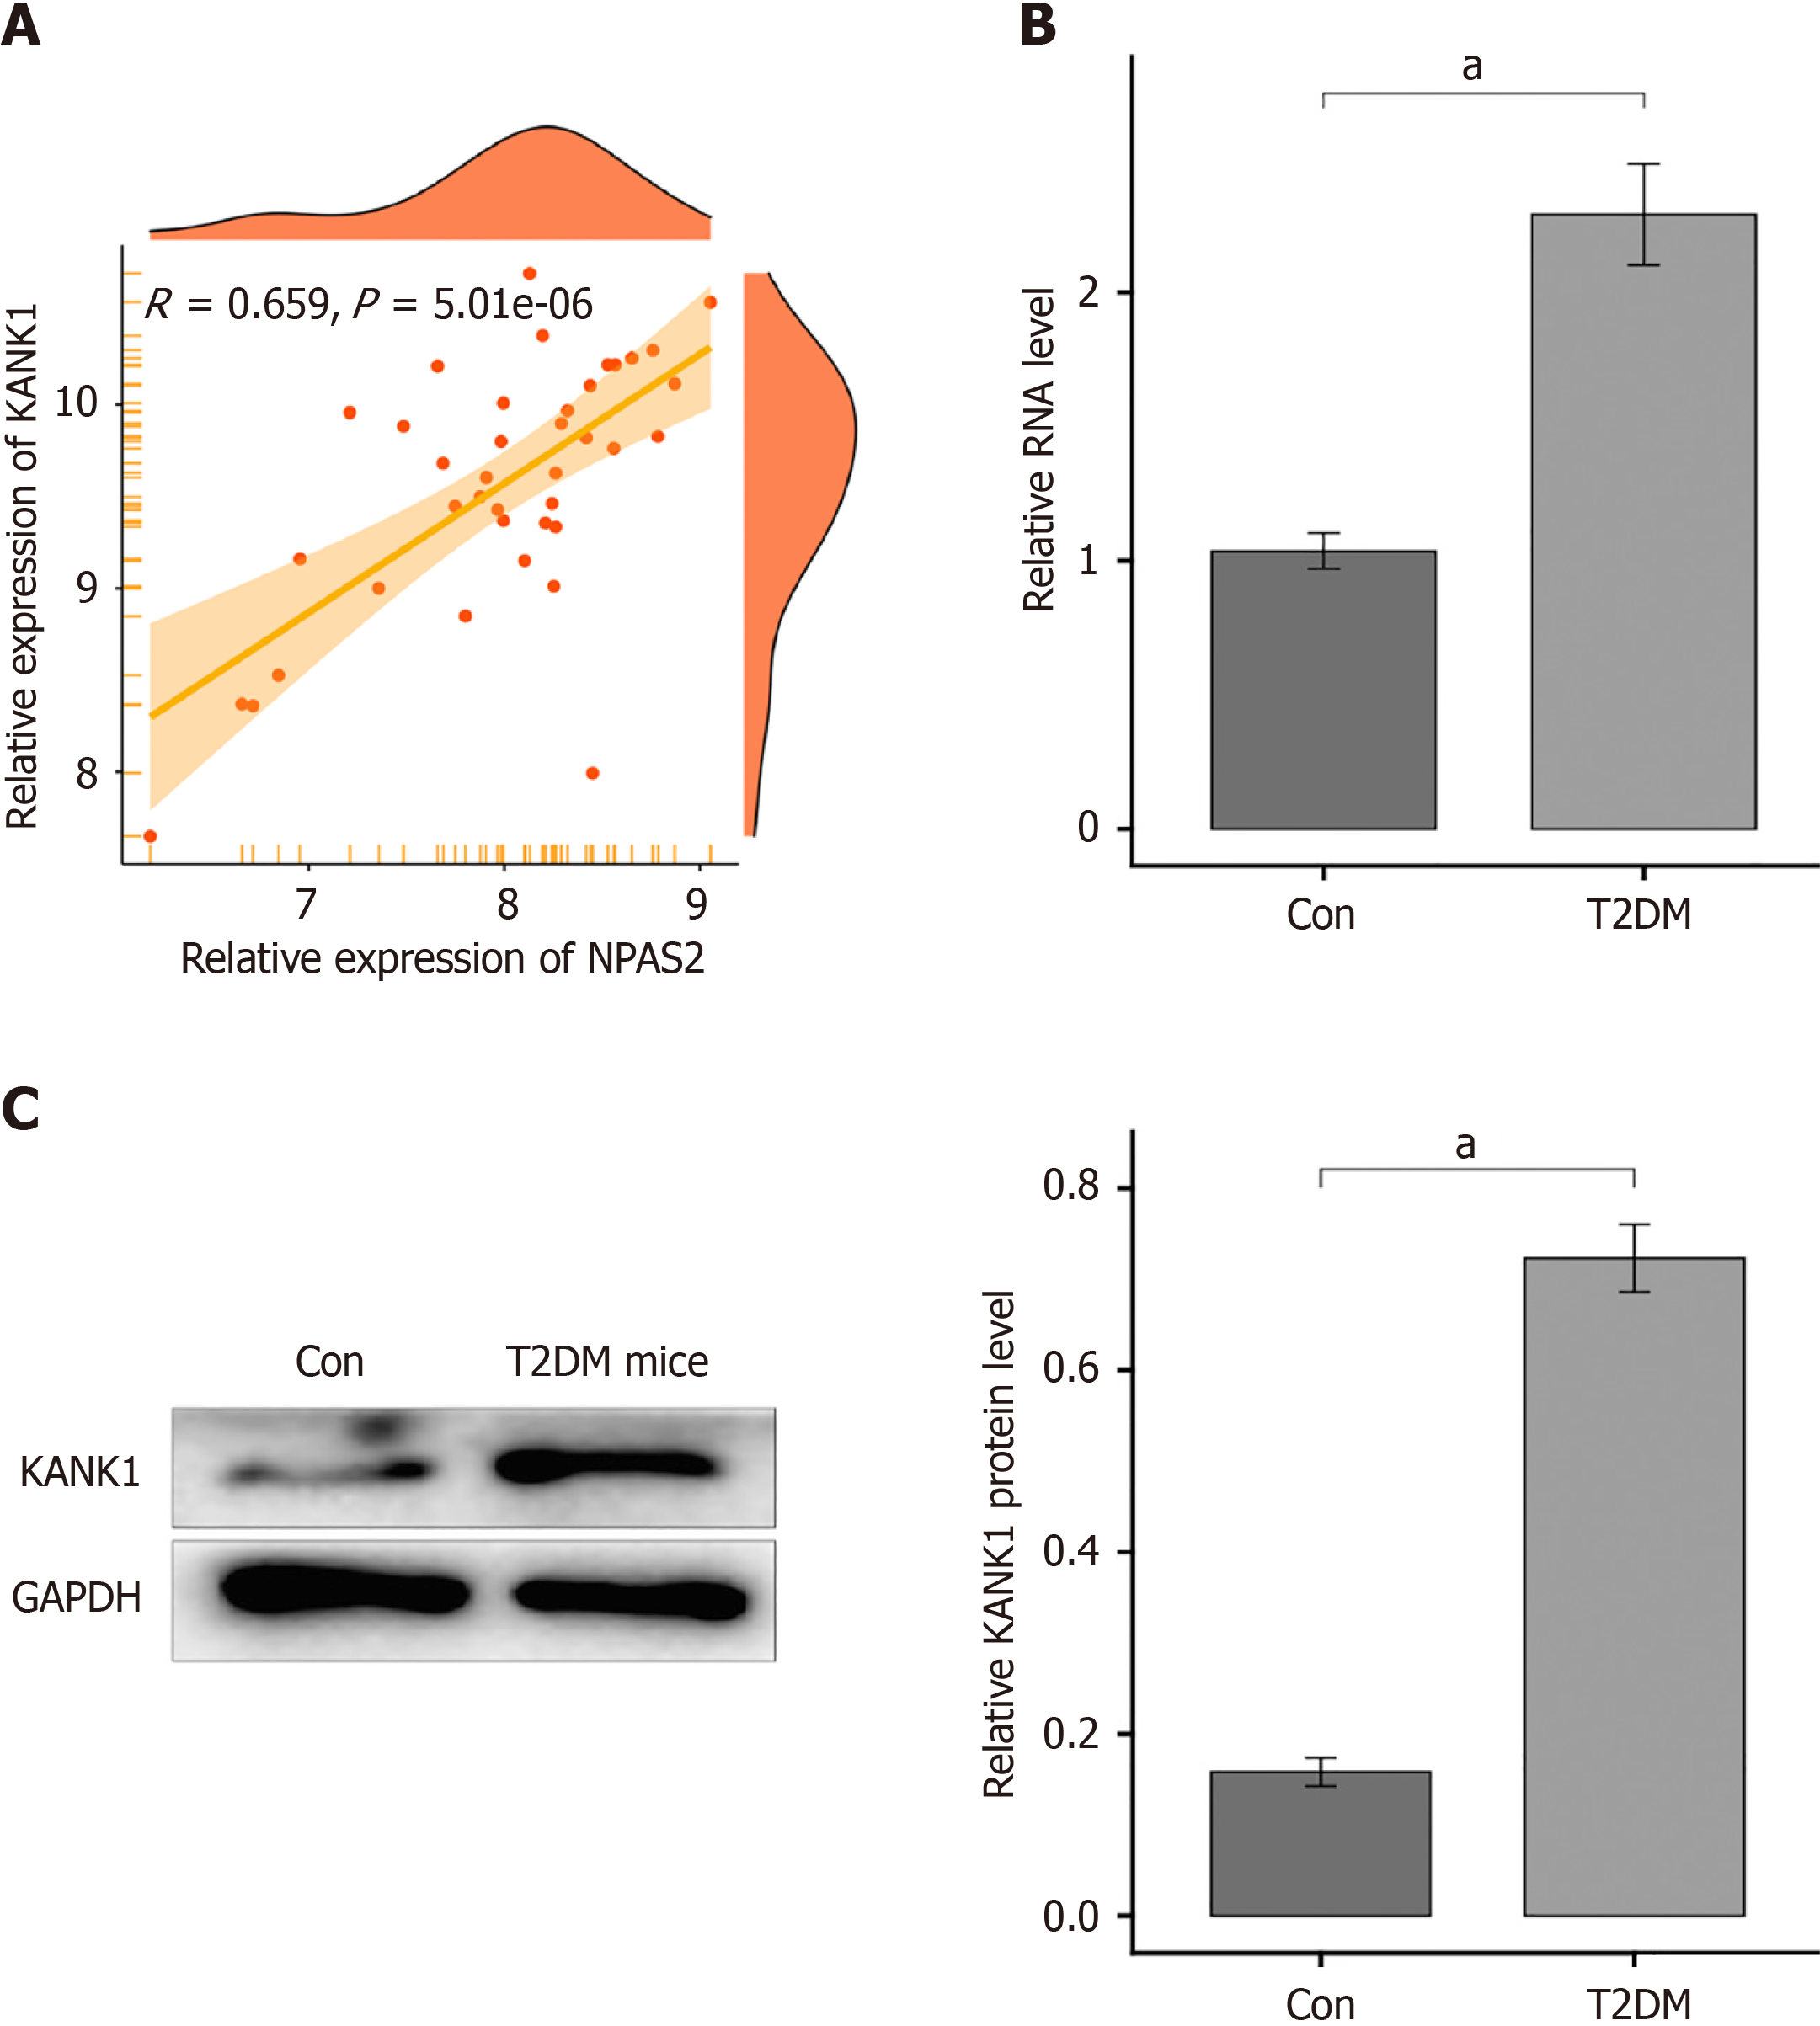
Using the R package "Dorothea" to look for NPAS2 downstream target genes, we discovered that NPAS2 may influence KANK1 expression. In T2DM, a scatter plot revealed a favorable connection between KANK1 and NPAS2 (r = 0.659, P = 5.01e-06; Figure 3A).
To see whether KANK1 is expressed in T2DM. We observed KANK1 mRNA and protein levels in β-cells of T2DM mice and normal mice. According to the results, the mRNA level of KANK1 in T2DM group was higher than that in control group (P < 0.0001; Figure 3B and C).
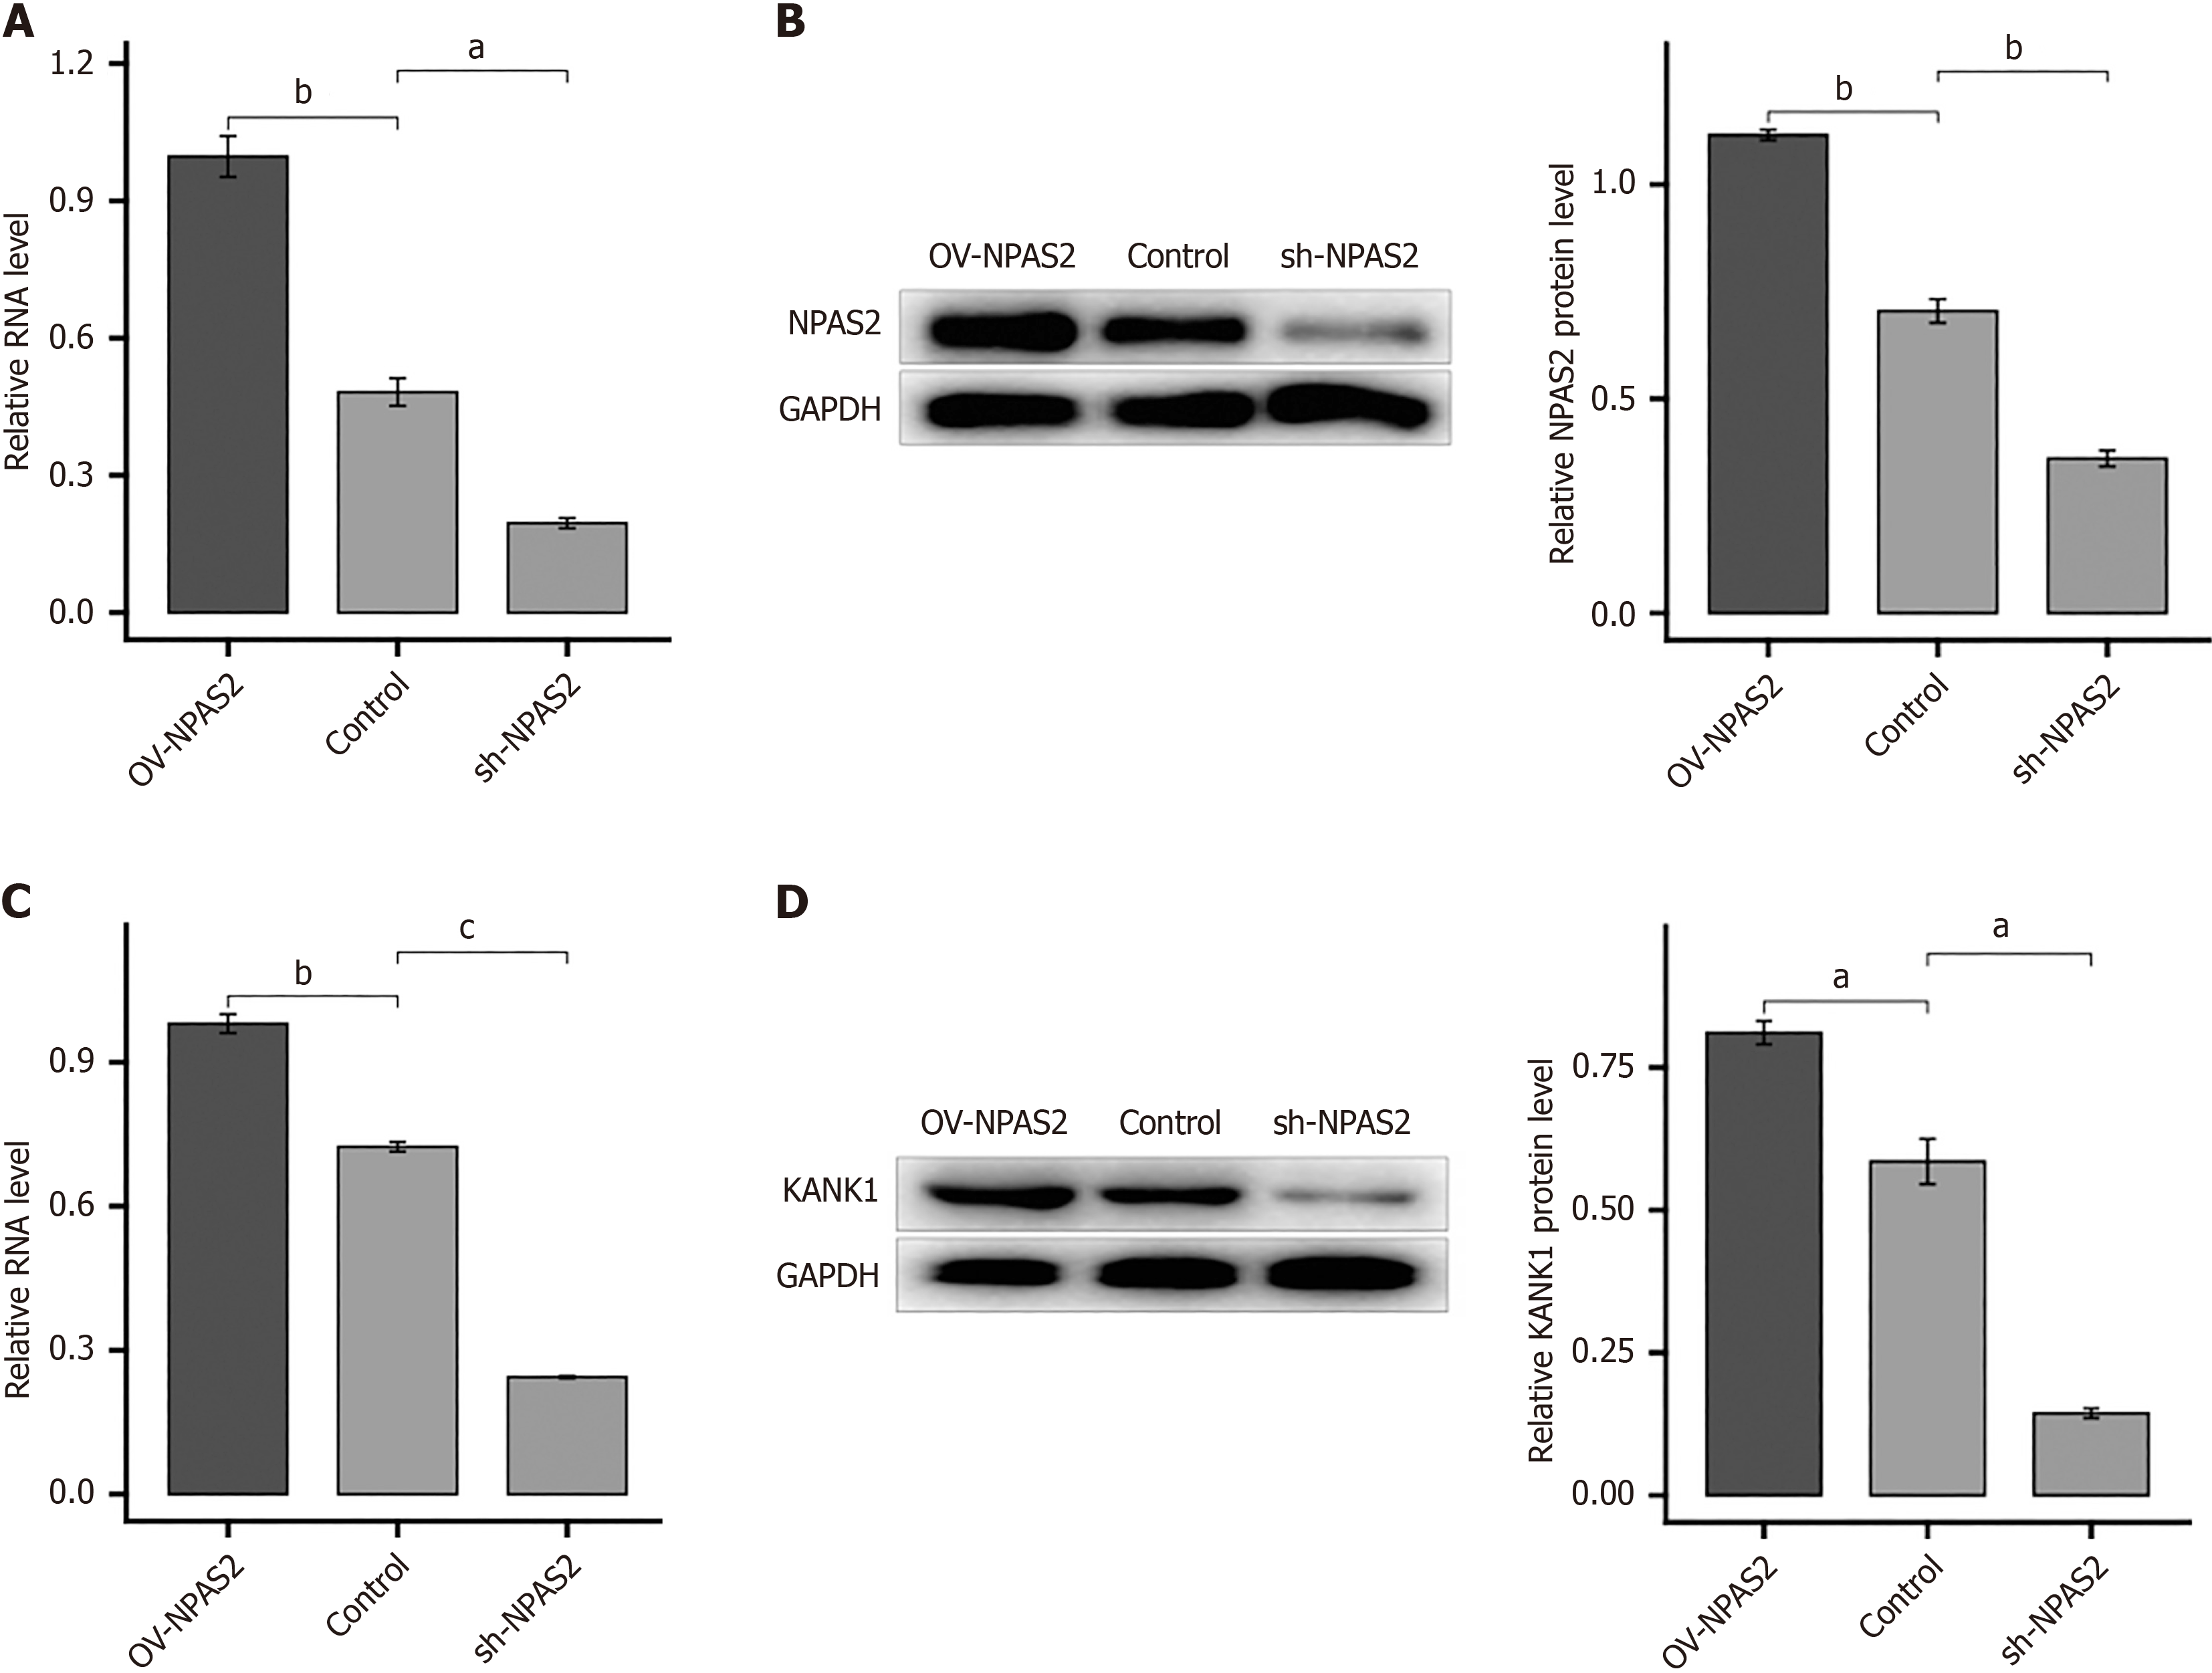
We created an NPAS2 overexpression construct and transfected it into a MIN6 cell injury model to further establish the regulatory link between NPAS2 and KANK1. MIN6 cell injury model were transfected using overexpression plasmids of KANK1 for 2 days and then for Western blotting and quantitative reverse transcriptase PCR. The findings showed that overexpression of NPAS2 did enhance KANK1 mRNA and protein levels (P < 0.001; Figure 4A and B), On the contrary, knocking down NPAS2 with shRNA had the opposite effect (Figure 4C and D), demonstrating that NPAS2 controls KANK1 expression. Above results showed that NPAS2 positively regulates KANK1 expression.
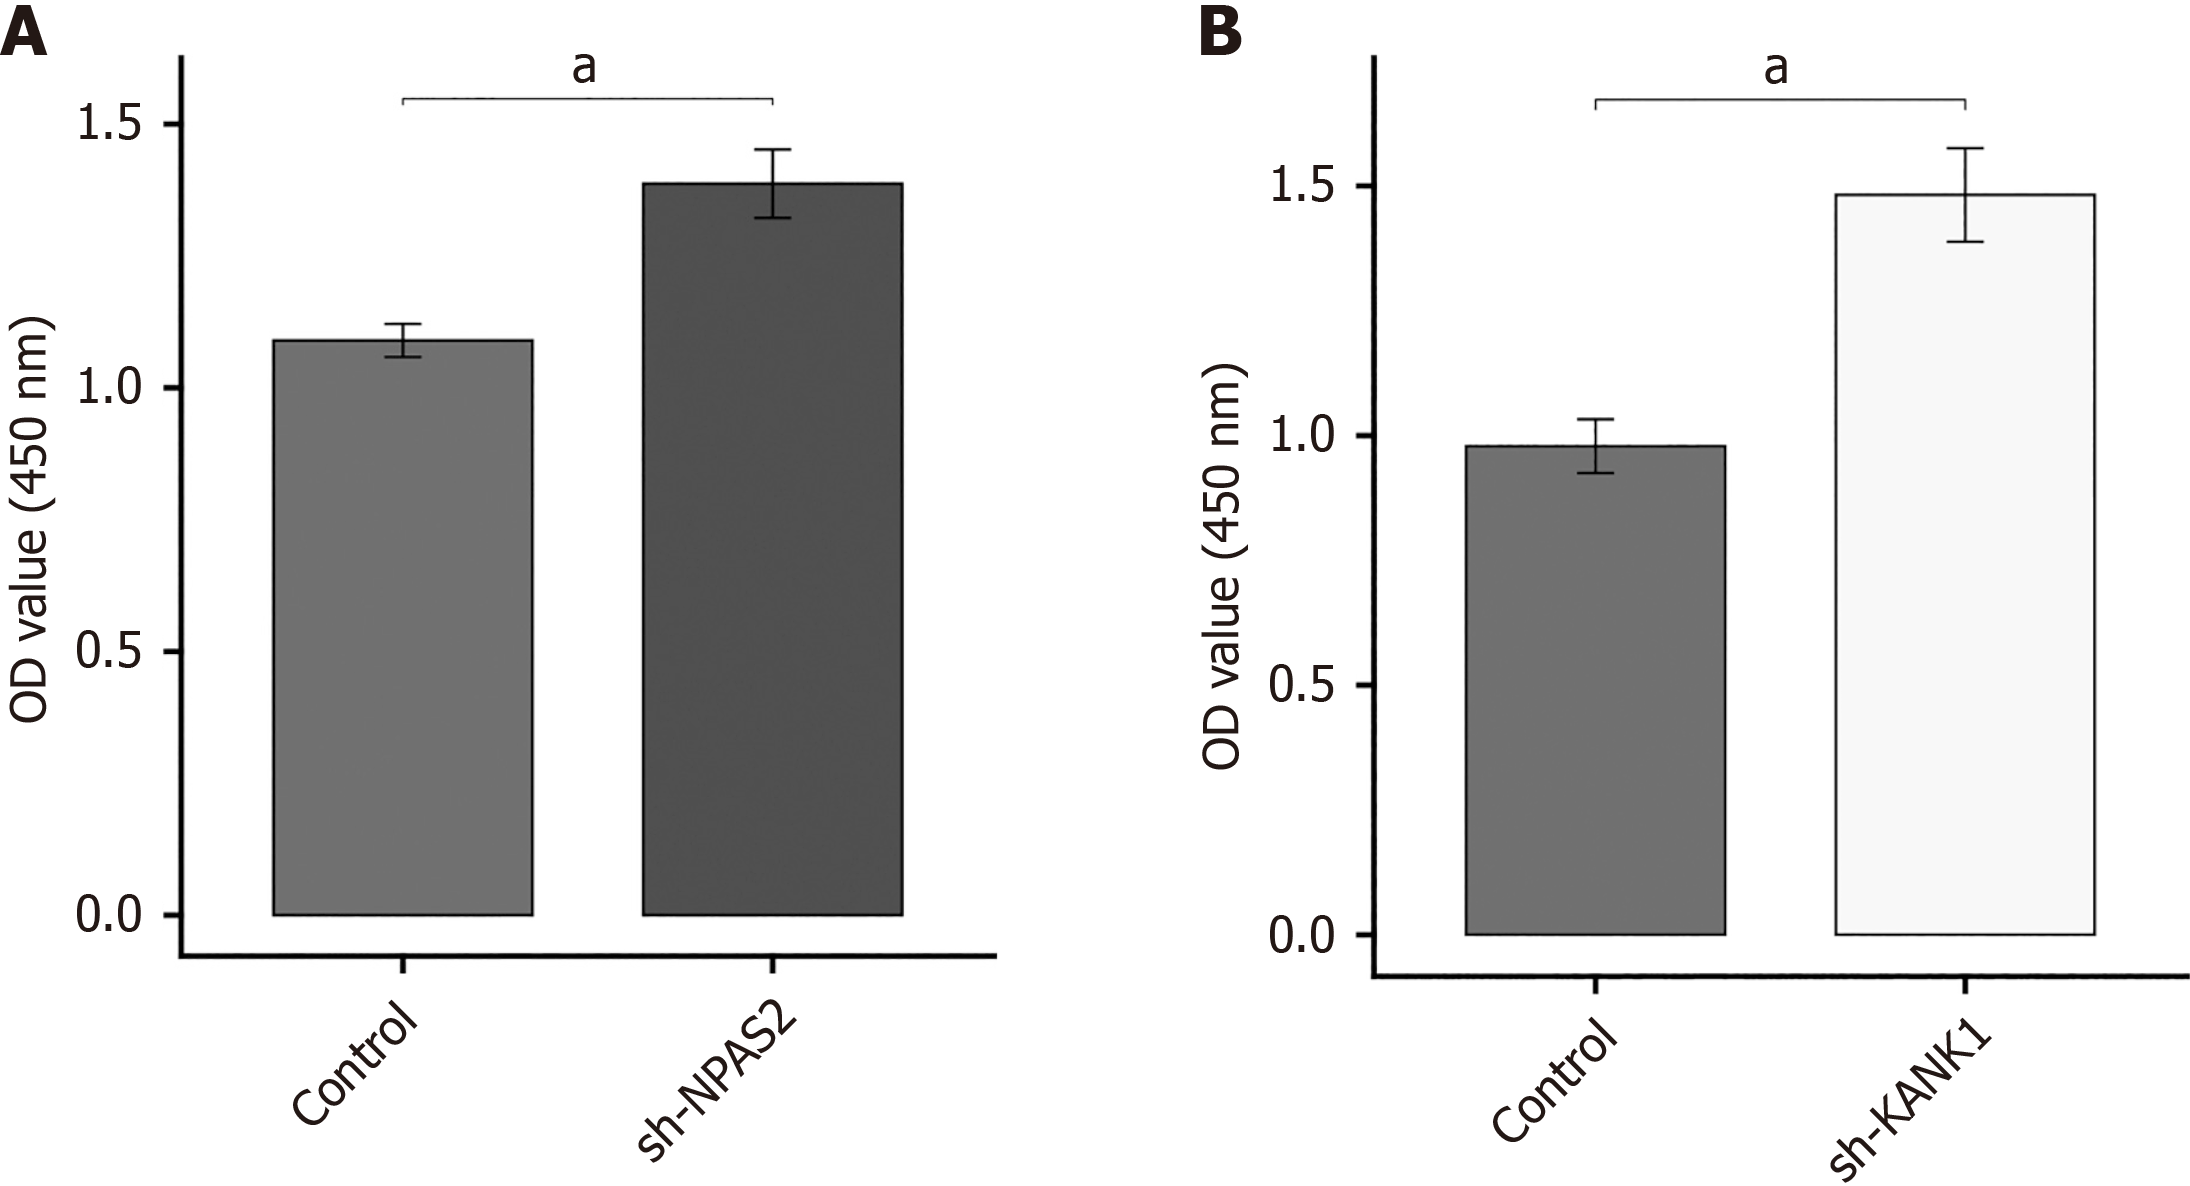
This study investigated if NPAS2 and KANK1 deceased β-cell survival or not. Using sh-strategy, we were able to knockdown gene expression in MIN6 cell damage model. CCK-8 tests were used to assess cell proliferation. The results showed that knocking down NPAS2 and KANK1 increased the proliferation of MIN6 cells (P < 0.01; Figure 5).
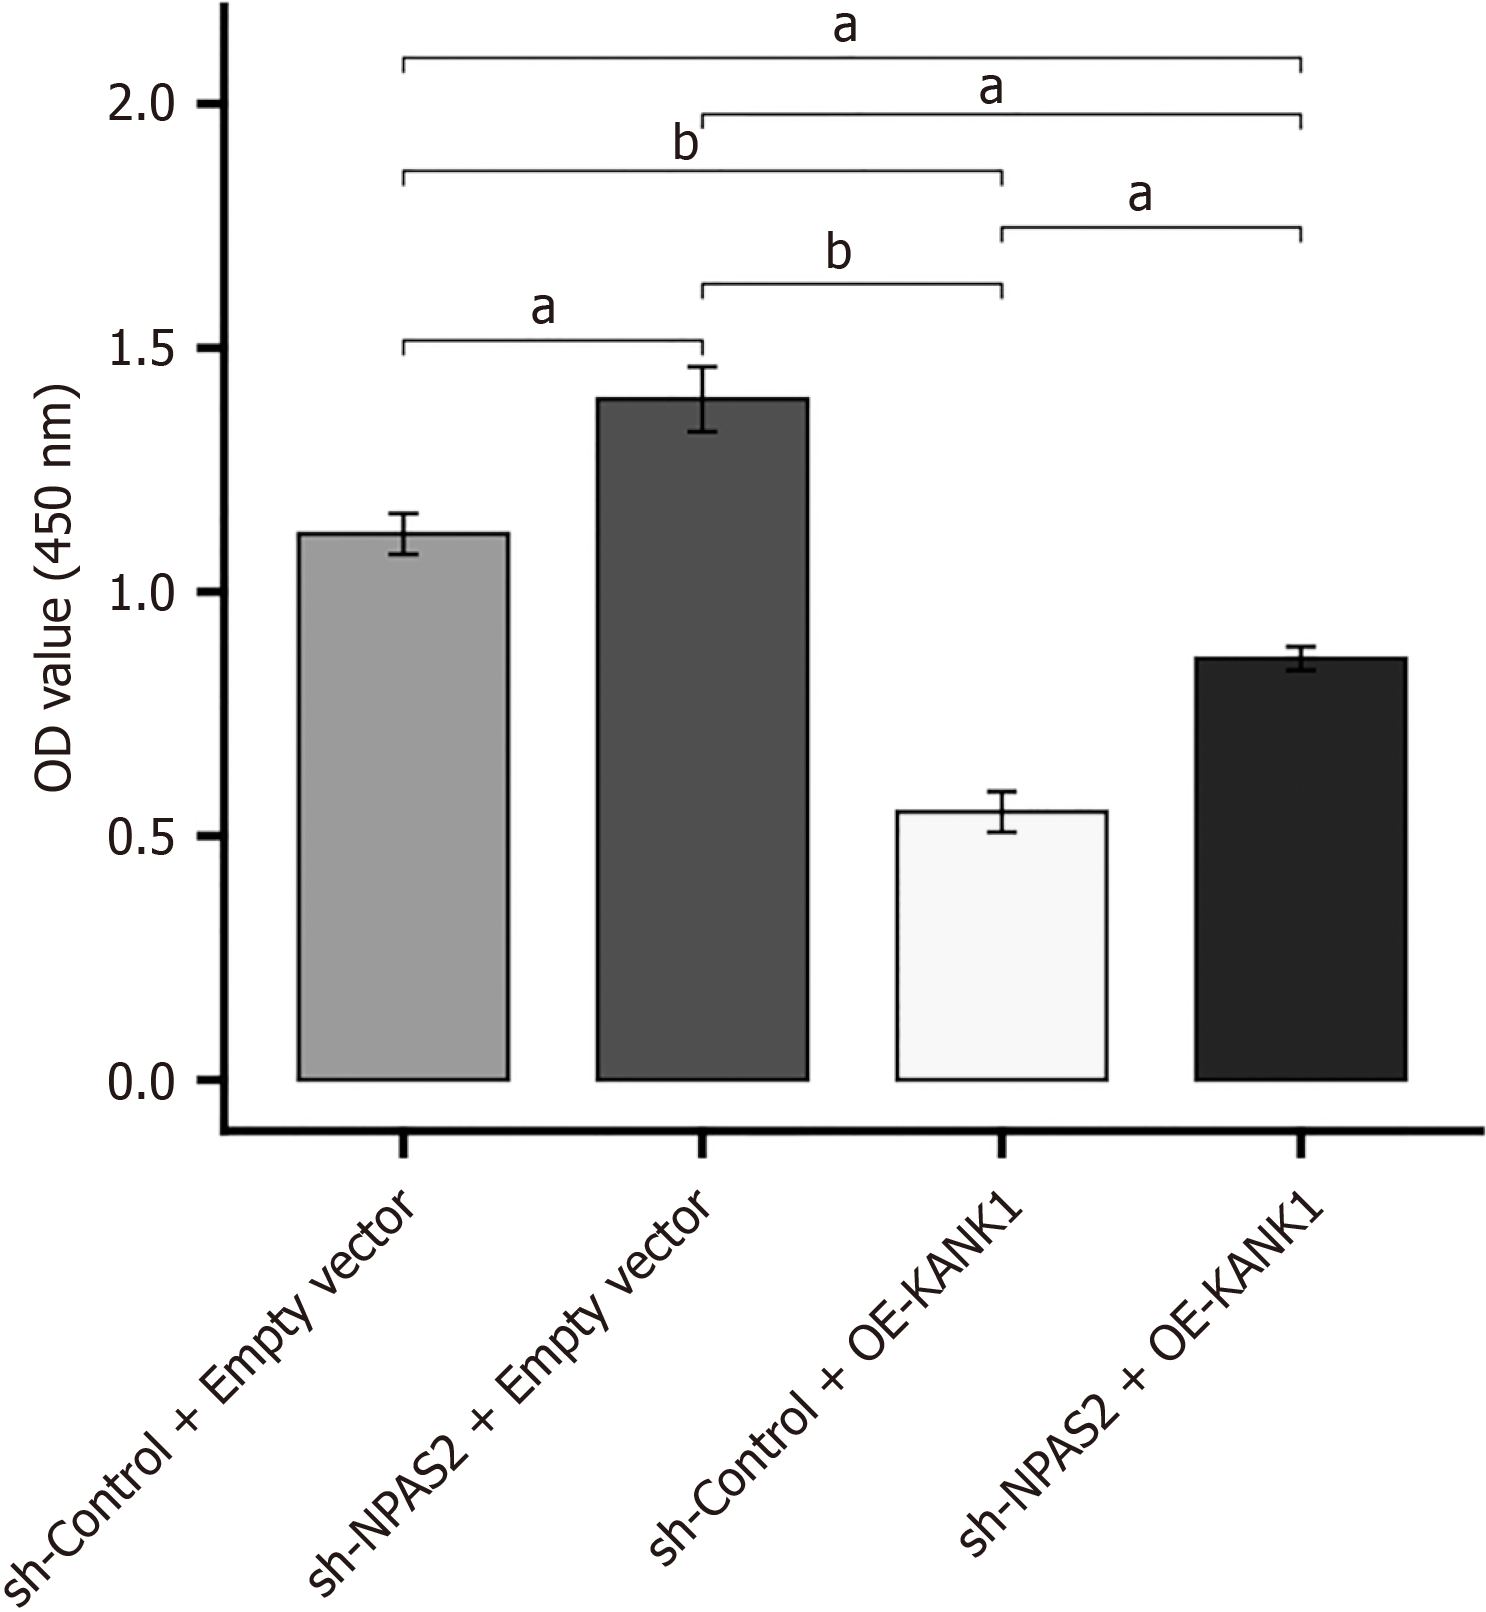
These findings proved that KANK1 and NPAS2 are important in inducing β cell dysfunction. According to the above assays, we conjectured that KANK1 was an effector of NPAS2. To verify this conjecture, KANK1 was knocked down in NPAS2 overexpressing MIN6 cell injury model. The CCK-8 test revealed that cell proliferation rate was higher in the sh-NPAS2 + empty vector MIN6 cell injury model compared to the sh-Control + empty vector model (P < 0.01). However, it was reversed by KANK1 overexpression (sh-NPAS2 + OE-KANK1), showing that NPAS2 suppressed MIN6 cell proliferation through KANK1 (P < 0.01; Figure 6). These results suggested that NPAS2 deceased β-cell survival by regulating KANK1 expression.
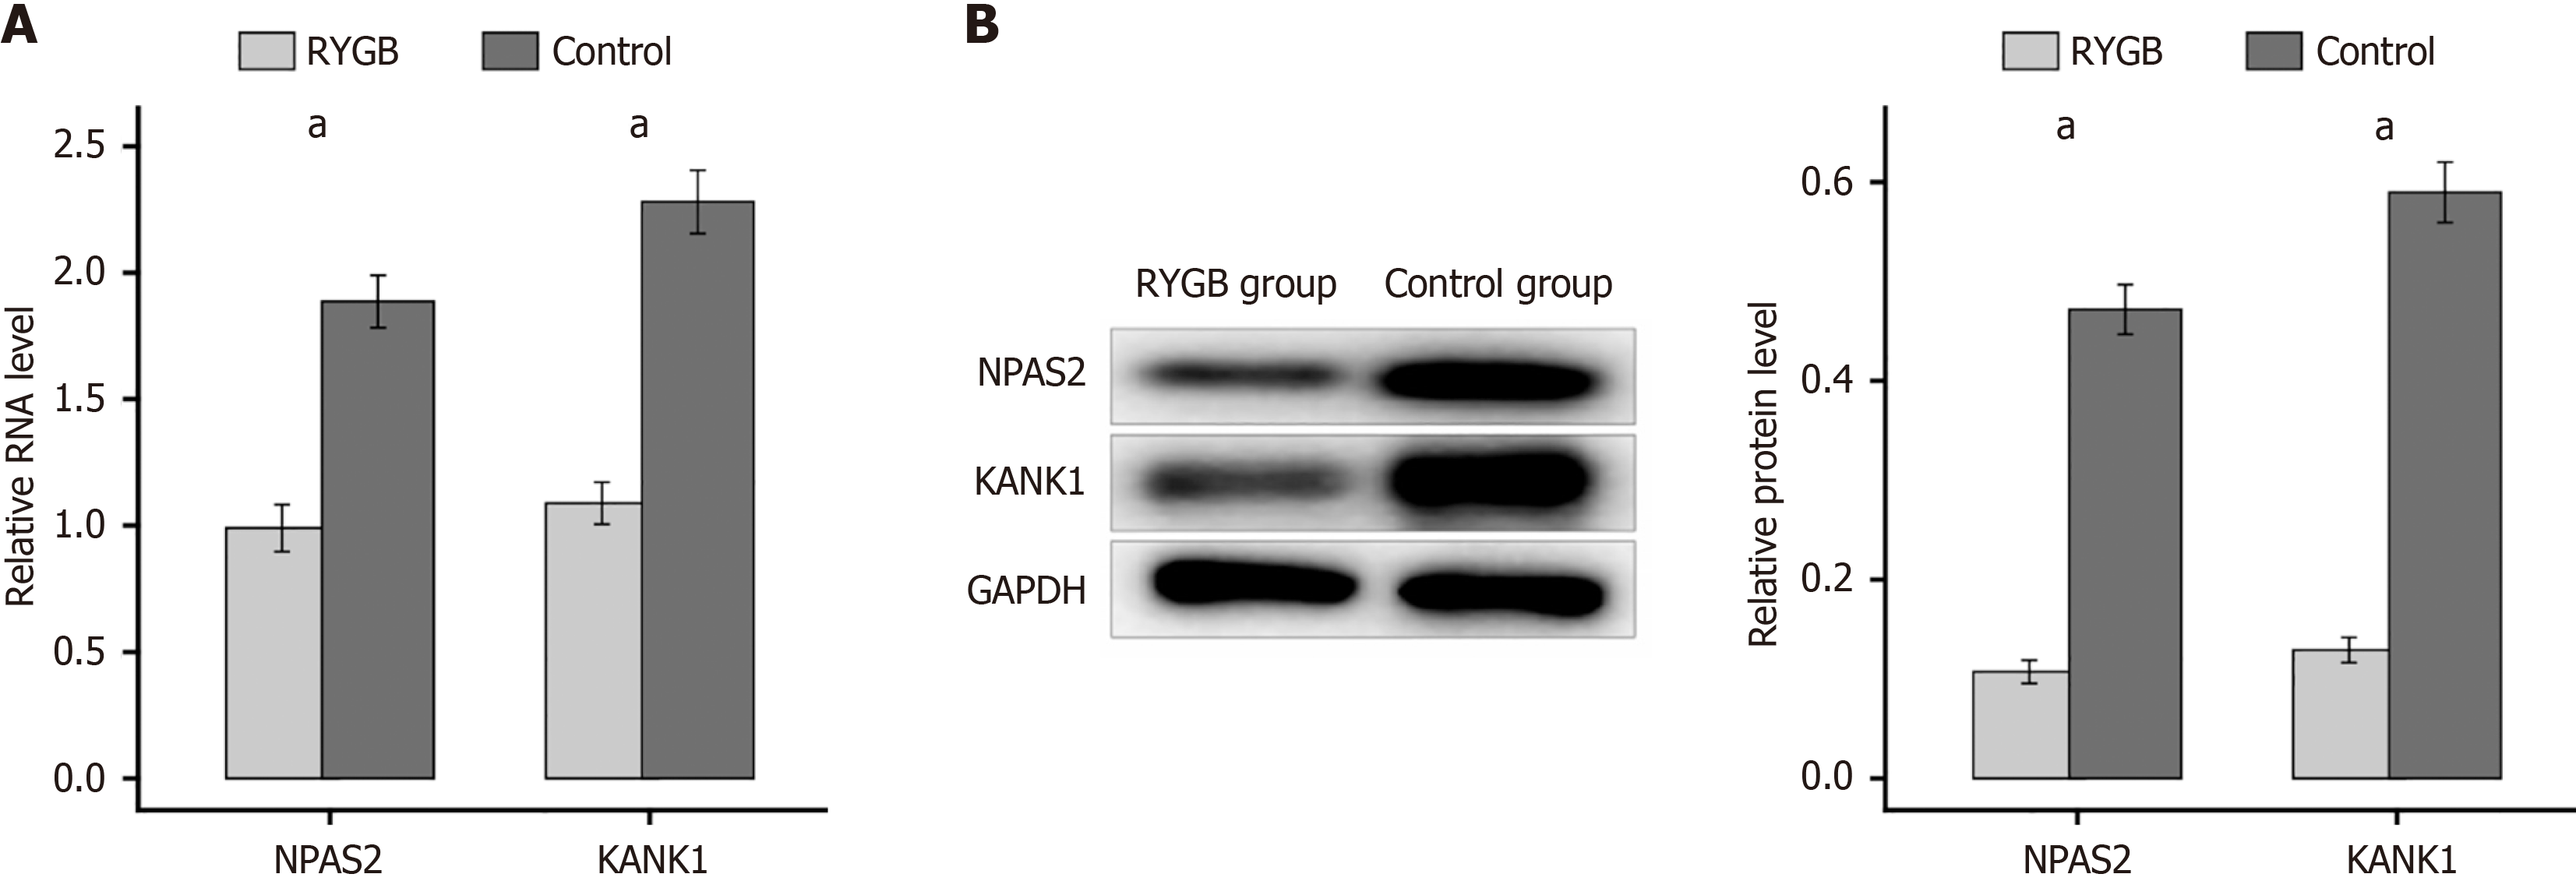
RYGB surgery is a usual method for T2DM. To investigate the role of NPAS2 and KANK1 in this surgery, T2DM mice underwent RYGB surgery. In the RYGB group, the mRNA content of KANK1and NPAS2 in the β-cell of mice was much lower than that in control group (P < 0.0001; Figure 7A). Meanwhile western blotting showed the same result. These findings implied that RYGB surgery, by inhibiting the NPAS2/KANK1 signaling pathway, may prevent β-cell dysfunction (P < 0.0001; Figure 7B).
As a matter of fact, T2DM has been affecting over 400 million people all over the world[11]. In addition, the incidence of T2DM may keep growing and, it is projected to influence approximately 33 percent people of the United States by 2050[12]. The Global Burden of Diseases study showed T2DM as well as its complications was the reason for the 22% increase in disability in the past decade[13]. For the past few years, tremendous advance has been made in the prevention and therapy of diabetes[14]. It is well known that T2DM is a kind of multifactorial endocrine illness. At present, the major treatment in T2DM involved lifestyle intervention, the use of anti-diabetic drugs and monitoring of arterial pressure and lipid profile[15,16]. However, if the patients with T2DM have poor glycemic control, long-term hyperglycemia will cause great damage to the blood vessels and nerves. While studies on molecular mechanisms could suggest a new therapeutic option. As a result, there is an urgent need to explore the molecules that can be used as diagnostic marker in order to develop the novel preventative and treatment strategies. In the present study, we found that NPAS2 was capable of accurately diagnosing T2DM. Furthermore, our results revealed that NPAS2 induced β cell dysfunction by regulating KANK1 expression in type 2 diabetes.
Recent studies have revealed that the NPAS2 can play an vital role in oncogenesis as an oncogene or tumor suppressor in tumor and endocrine diseases[17-20]. To study the function of NPAS2 in T2DM, we first created a T2DM model. The t-test results indicated that NPAS2 was considerably elevated in islet tissues of T2DM patients. In addition, the ROC curve revealed that NPAS2 was capable of accurately diagnosing T2DM. What’s more, NPAS2 is link to multiple endocrine diseases such as obesity, thyroid gland, osteoporosis as well as gout[21,22]. Kovanen et al[23] elevated that NPAS2 mRNA amounts are strongly related to higher disease free survival and overall rate in thyroid gland. Englund et al[18] found that NPAS2 has a closely relationship with hypertension. Not only fetal liver metabolism, but also non-alcoholic fatty liver disease were linked to NPAS2[24]. The above studies illustrated the importance of NPAS2 in endocrine diseases.
Diabetes mellitus is a kind of endocrine diseases. But studies on the relationship between NPAS2 and T2DM have not been carried out in depth. This paper is to further investigate the impact of NPAS2 on T2DM. In the study we discovered that NPAS2 may influence KANK1 expression. Previous study demonstrated that KANK1 was not only related to cir
However, there is still room for further improvement in future experiments. For example, using more advanced sequencing technology, we can determine the cellular origin of NPAS2 and the mode of cell interaction. It is also a good treatment method to analyze the susceptibility of T2DM based on a large clinical sample, so as to target therapeutic drugs for susceptible genes. The high incidence of T2DM makes it more and more important to explore the depth and breadth of its mechanism.
This study demonstrated that NPAS2 induced β cell dysfunction by regulating KANK1 expression in type 2 diabetes, and it may be an underlying therapy target of T2DM.
| 1. | Schwitzgebel VM. Many faces of monogenic diabetes. J Diabetes Investig. 2014;5:121-133. [RCA] [PubMed] [DOI] [Full Text] [Full Text (PDF)] [Cited by in Crossref: 63] [Cited by in RCA: 52] [Article Influence: 4.7] [Reference Citation Analysis (0)] |
| 2. | Guariguata L. Contribute data to the 6th edition of the IDF Diabetes Atlas. Diabetes Res Clin Pract. 2013;100:280-281. [RCA] [PubMed] [DOI] [Full Text] [Cited by in Crossref: 29] [Cited by in RCA: 31] [Article Influence: 2.6] [Reference Citation Analysis (0)] |
| 3. | Badis G, Berger MF, Philippakis AA, Talukder S, Gehrke AR, Jaeger SA, Chan ET, Metzler G, Vedenko A, Chen X, Kuznetsov H, Wang CF, Coburn D, Newburger DE, Morris Q, Hughes TR, Bulyk ML. Diversity and complexity in DNA recognition by transcription factors. Science. 2009;324:1720-1723. [RCA] [PubMed] [DOI] [Full Text] [Full Text (PDF)] [Cited by in Crossref: 858] [Cited by in RCA: 761] [Article Influence: 47.6] [Reference Citation Analysis (0)] |
| 4. | Bernstein DA. Identification of small molecules that disrupt SSB-protein interactions using a high-throughput screen. Methods Mol Biol. 2012;922:183-191. [RCA] [PubMed] [DOI] [Full Text] [Cited by in Crossref: 2] [Cited by in RCA: 4] [Article Influence: 0.3] [Reference Citation Analysis (0)] |
| 5. | Vaquerizas JM, Kummerfeld SK, Teichmann SA, Luscombe NM. A census of human transcription factors: function, expression and evolution. Nat Rev Genet. 2009;10:252-263. [RCA] [PubMed] [DOI] [Full Text] [Cited by in Crossref: 1330] [Cited by in RCA: 1150] [Article Influence: 71.9] [Reference Citation Analysis (0)] |
| 6. | Li J, Du H, Zhang M, Zhang Z, Teng F, Zhao Y, Zhang W, Yu Y, Feng L, Cui X, Zhang M, Lu T, Guan F, Chen L. Amorphous solid dispersion of Berberine mitigates apoptosis via iPLA(2)β/Cardiolipin/Opa1 pathway in db/db mice and in Palmitate-treated MIN6 β-cells. Int J Biol Sci. 2019;15:1533-1545. [RCA] [PubMed] [DOI] [Full Text] [Full Text (PDF)] [Cited by in Crossref: 11] [Cited by in RCA: 27] [Article Influence: 4.5] [Reference Citation Analysis (0)] |
| 7. | Zhang M, Lv XY, Li J, Xu ZG, Chen L. The characterization of high-fat diet and multiple low-dose streptozotocin induced type 2 diabetes rat model. Exp Diabetes Res. 2008;2008:704045. [RCA] [PubMed] [DOI] [Full Text] [Full Text (PDF)] [Cited by in Crossref: 293] [Cited by in RCA: 412] [Article Influence: 25.8] [Reference Citation Analysis (0)] |
| 8. | Hao Z, Zhao Z, Berthoud HR, Ye J. Development and verification of a mouse model for Roux-en-Y gastric bypass surgery with a small gastric pouch. PLoS One. 2013;8:e52922. [RCA] [PubMed] [DOI] [Full Text] [Full Text (PDF)] [Cited by in Crossref: 39] [Cited by in RCA: 50] [Article Influence: 4.2] [Reference Citation Analysis (0)] |
| 9. | Yu Y, Du H, Wei S, Feng L, Li J, Yao F, Zhang M, Hatch GM, Chen L. Adipocyte-Derived Exosomal MiR-27a Induces Insulin Resistance in Skeletal Muscle Through Repression of PPARγ. Theranostics. 2018;8:2171-2188. [RCA] [PubMed] [DOI] [Full Text] [Full Text (PDF)] [Cited by in Crossref: 111] [Cited by in RCA: 227] [Article Influence: 32.4] [Reference Citation Analysis (0)] |
| 10. | Kroh EM, Parkin RK, Mitchell PS, Tewari M. Analysis of circulating microRNA biomarkers in plasma and serum using quantitative reverse transcription-PCR (qRT-PCR). Methods. 2010;50:298-301. [RCA] [PubMed] [DOI] [Full Text] [Cited by in Crossref: 867] [Cited by in RCA: 932] [Article Influence: 62.1] [Reference Citation Analysis (0)] |
| 11. | NCD Risk Factor Collaboration (NCD-RisC). Worldwide trends in diabetes since 1980: a pooled analysis of 751 population-based studies with 4.4 million participants. Lancet. 2016;387:1513-1530. [RCA] [PubMed] [DOI] [Full Text] [Full Text (PDF)] [Cited by in Crossref: 2594] [Cited by in RCA: 2533] [Article Influence: 281.4] [Reference Citation Analysis (0)] |
| 12. | Gregg EW, Buckley J, Ali MK, Davies J, Flood D, Mehta R, Griffiths B, Lim LL, Manne-Goehler J, Pearson-Stuttard J, Tandon N, Roglic G, Slama S, Shaw JE; Global Health and Population Project on Access to Care for Cardiometabolic Diseases. Improving health outcomes of people with diabetes: target setting for the WHO Global Diabetes Compact. Lancet. 2023;401:1302-1312. [RCA] [PubMed] [DOI] [Full Text] [Cited by in Crossref: 66] [Cited by in RCA: 106] [Article Influence: 53.0] [Reference Citation Analysis (0)] |
| 13. | GBD 2015 Disease and Injury Incidence and Prevalence Collaborators. Global, regional, and national incidence, prevalence, and years lived with disability for 310 diseases and injuries, 1990-2015: a systematic analysis for the Global Burden of Disease Study 2015. Lancet. 2016;388:1545-1602. [RCA] [PubMed] [DOI] [Full Text] [Full Text (PDF)] [Cited by in Crossref: 5206] [Cited by in RCA: 4834] [Article Influence: 537.1] [Reference Citation Analysis (0)] |
| 14. | Ogurtsova K, da Rocha Fernandes JD, Huang Y, Linnenkamp U, Guariguata L, Cho NH, Cavan D, Shaw JE, Makaroff LE. IDF Diabetes Atlas: Global estimates for the prevalence of diabetes for 2015 and 2040. Diabetes Res Clin Pract. 2017;128:40-50. [RCA] [PubMed] [DOI] [Full Text] [Cited by in Crossref: 2306] [Cited by in RCA: 2511] [Article Influence: 313.9] [Reference Citation Analysis (0)] |
| 15. | Shen X, Wang C, Liang N, Liu Z, Li X, Zhu ZJ, Merriman TR, Dalbeth N, Terkeltaub R, Li C, Yin H. Serum Metabolomics Identifies Dysregulated Pathways and Potential Metabolic Biomarkers for Hyperuricemia and Gout. Arthritis Rheumatol. 2021;73:1738-1748. [RCA] [PubMed] [DOI] [Full Text] [Cited by in Crossref: 13] [Cited by in RCA: 70] [Article Influence: 17.5] [Reference Citation Analysis (0)] |
| 16. | Leibowitz G, Kaiser N, Cerasi E. Balancing needs and means: the dilemma of the beta-cell in the modern world. Diabetes Obes Metab. 2009;11 Suppl 4:1-9. [RCA] [PubMed] [DOI] [Full Text] [Cited by in Crossref: 9] [Cited by in RCA: 10] [Article Influence: 0.6] [Reference Citation Analysis (0)] |
| 17. | Hoshino A, Ariyoshi M, Okawa Y, Kaimoto S, Uchihashi M, Fukai K, Iwai-Kanai E, Ikeda K, Ueyama T, Ogata T, Matoba S. Inhibition of p53 preserves Parkin-mediated mitophagy and pancreatic β-cell function in diabetes. Proc Natl Acad Sci U S A. 2014;111:3116-3121. [RCA] [PubMed] [DOI] [Full Text] [Cited by in Crossref: 138] [Cited by in RCA: 188] [Article Influence: 17.1] [Reference Citation Analysis (0)] |
| 18. | Englund A, Kovanen L, Saarikoski ST, Haukka J, Reunanen A, Aromaa A, Lönnqvist J, Partonen T. NPAS2 and PER2 are linked to risk factors of the metabolic syndrome. J Circadian Rhythms. 2009;7:5. [RCA] [PubMed] [DOI] [Full Text] [Full Text (PDF)] [Cited by in Crossref: 102] [Cited by in RCA: 108] [Article Influence: 6.8] [Reference Citation Analysis (0)] |
| 19. | Garcia JA, Zhang D, Estill SJ, Michnoff C, Rutter J, Reick M, Scott K, Diaz-Arrastia R, McKnight SL. Impaired cued and contextual memory in NPAS2-deficient mice. Science. 2000;288:2226-2230. [RCA] [PubMed] [DOI] [Full Text] [Cited by in Crossref: 169] [Cited by in RCA: 182] [Article Influence: 7.3] [Reference Citation Analysis (0)] |
| 20. | O'Neil D, Mendez-Figueroa H, Mistretta TA, Su C, Lane RH, Aagaard KM. Dysregulation of Npas2 leads to altered metabolic pathways in a murine knockout model. Mol Genet Metab. 2013;110:378-387. [RCA] [PubMed] [DOI] [Full Text] [Cited by in Crossref: 19] [Cited by in RCA: 23] [Article Influence: 1.9] [Reference Citation Analysis (0)] |
| 21. | Kim HI, Lee HJ, Cho CH, Kang SG, Yoon HK, Park YM, Lee SH, Moon JH, Song HM, Lee E, Kim L. Association of CLOCK, ARNTL, and NPAS2 gene polymorphisms and seasonal variations in mood and behavior. Chronobiol Int. 2015;32:785-791. [RCA] [PubMed] [DOI] [Full Text] [Cited by in Crossref: 43] [Cited by in RCA: 40] [Article Influence: 4.0] [Reference Citation Analysis (0)] |
| 22. | Partonen T. Clock gene variants in mood and anxiety disorders. J Neural Transm (Vienna). 2012;119:1133-1145. [RCA] [PubMed] [DOI] [Full Text] [Cited by in Crossref: 61] [Cited by in RCA: 72] [Article Influence: 5.5] [Reference Citation Analysis (0)] |
| 23. | Kovanen L, Saarikoski ST, Aromaa A, Lönnqvist J, Partonen T. ARNTL (BMAL1) and NPAS2 gene variants contribute to fertility and seasonality. PLoS One. 2010;5:e10007. [RCA] [PubMed] [DOI] [Full Text] [Full Text (PDF)] [Cited by in Crossref: 68] [Cited by in RCA: 84] [Article Influence: 5.6] [Reference Citation Analysis (0)] |
| 24. | Smith AK, Fang H, Whistler T, Unger ER, Rajeevan MS. Convergent genomic studies identify association of GRIK2 and NPAS2 with chronic fatigue syndrome. Neuropsychobiology. 2011;64:183-194. [RCA] [PubMed] [DOI] [Full Text] [Cited by in Crossref: 53] [Cited by in RCA: 51] [Article Influence: 3.6] [Reference Citation Analysis (0)] |
| 25. | Huyghe JR, Jackson AU, Fogarty MP, Buchkovich ML, Stančáková A, Stringham HM, Sim X, Yang L, Fuchsberger C, Cederberg H, Chines PS, Teslovich TM, Romm JM, Ling H, McMullen I, Ingersoll R, Pugh EW, Doheny KF, Neale BM, Daly MJ, Kuusisto J, Scott LJ, Kang HM, Collins FS, Abecasis GR, Watanabe RM, Boehnke M, Laakso M, Mohlke KL. Exome array analysis identifies new loci and low-frequency variants influencing insulin processing and secretion. Nat Genet. 2013;45:197-201. [RCA] [PubMed] [DOI] [Full Text] [Cited by in Crossref: 213] [Cited by in RCA: 214] [Article Influence: 16.5] [Reference Citation Analysis (0)] |


