Copyright
©The Author(s) 2018.
World J Diabetes. Dec 15, 2018; 9(12): 239-251
Published online Dec 15, 2018. doi: 10.4239/wjd.v9.i12.239
Published online Dec 15, 2018. doi: 10.4239/wjd.v9.i12.239
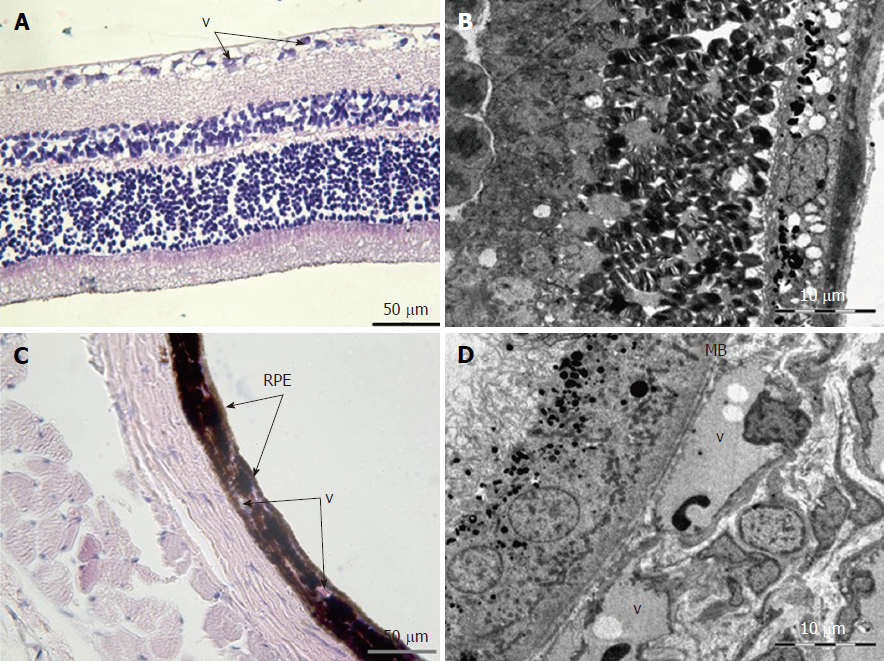
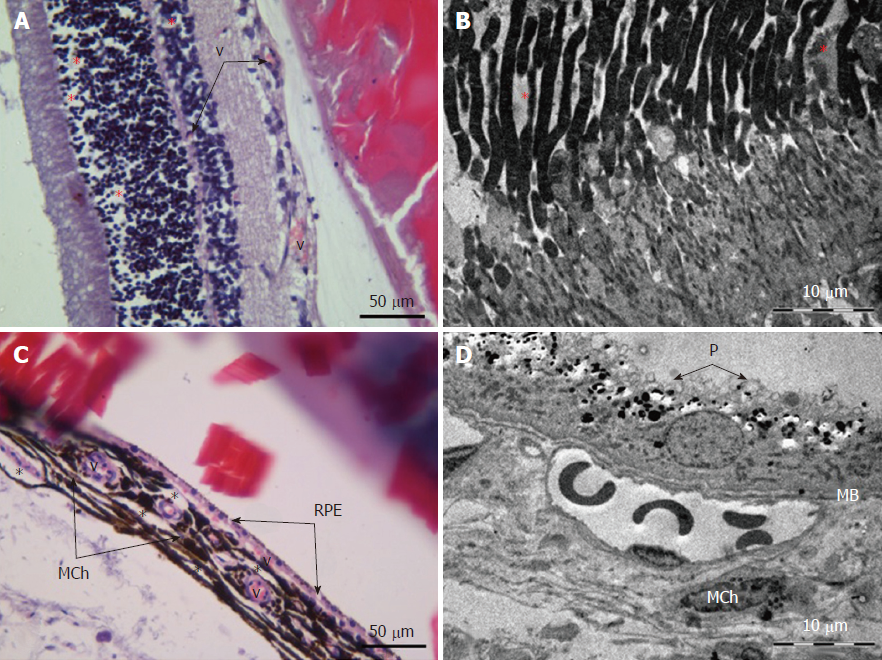
Figure 1 Back of the eye of a control animal.
A: Light microscopy visualization of the retina. v: blood vessels; B: Electron microscopy of the outer layers of the retina; C: Light microscopy of the choroid and sclera of the eye. v: choroid vessels; RPE: pigment epithelium of the retina; D: Electron microscopy of the retinal pigment epithelium and choroid. v: choroid vessels; Light microscopy: staining with hematoxylin and eosin, magnification × 400, bar 50 μm; Electron microscopy: bar 10 μm.
Figure 2 Cell processes of retinal pigment epithelium.
A: Control animals (group 1); B: Diabetes at 30 d (group 2); C: Diabetes at 60 d (group 3); Bar 2 μm. *: vacuolation of cell processes.
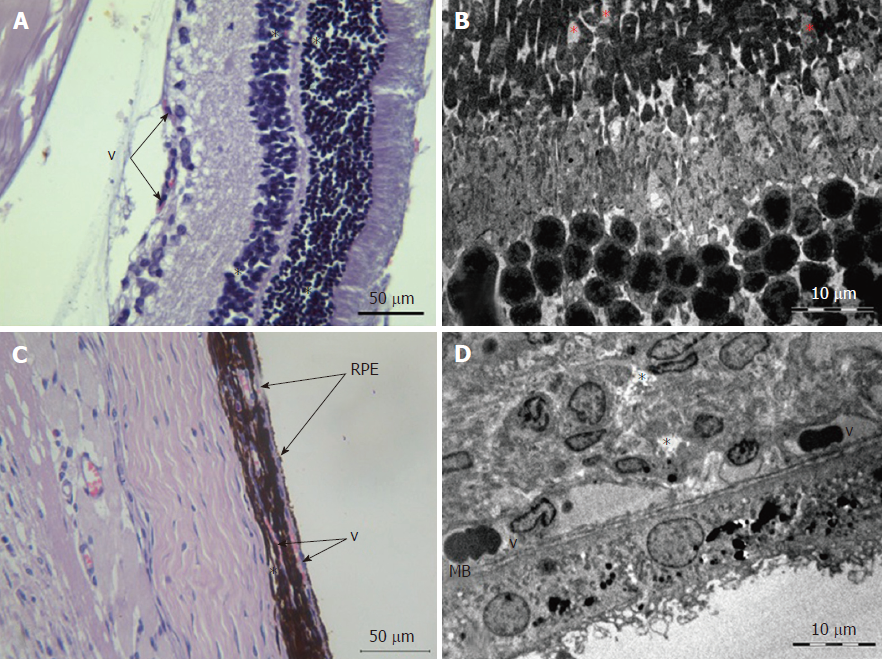
Figure 3 Posterior wall of the eye of an animal with diabetes at 30 d.
A: Light microscopy of the retina; *: interstitial edema; v: full blood vessels; B: Electron microscopy of the outer layers of the retina; *: destroying rods and cones; C: Light microscopy of the choroid and sclera of the eye; *: interstitial edema; v: full blood vessels; RPE: destructive changes in retinal pigment epithelial cells; D: Electron microscopy of the retinal pigment epithelium and choroid; *: interstitial edema; v: choroid vessels with sludge complexes; MB: unevenly thickened Bruch’s membrane; Light microscopy: staining with hematoxylin and eosin, magnification × 400, bar 50 μm; Electron microscopy: bar 10 μm.
Figure 4 Photoreceptors of the retina.
A: control animals (group 1), bar 2 μm; B: diabetes at 30 d (group 2), bar 2 μm; C: diabetes at 60 d (group 3), bar 1 μm. *: destruction of photoreceptors.
Figure 5 Morphometric examination of the choroid of the eyes of animals in experimental groups.
A: The average number of choroidal vessels per unit area (0.01 mm2); B: Average number of pigment cells of the choroid per unit area (0.01 mm2). aDifferences compared to the control animals were significant at < 0.05.
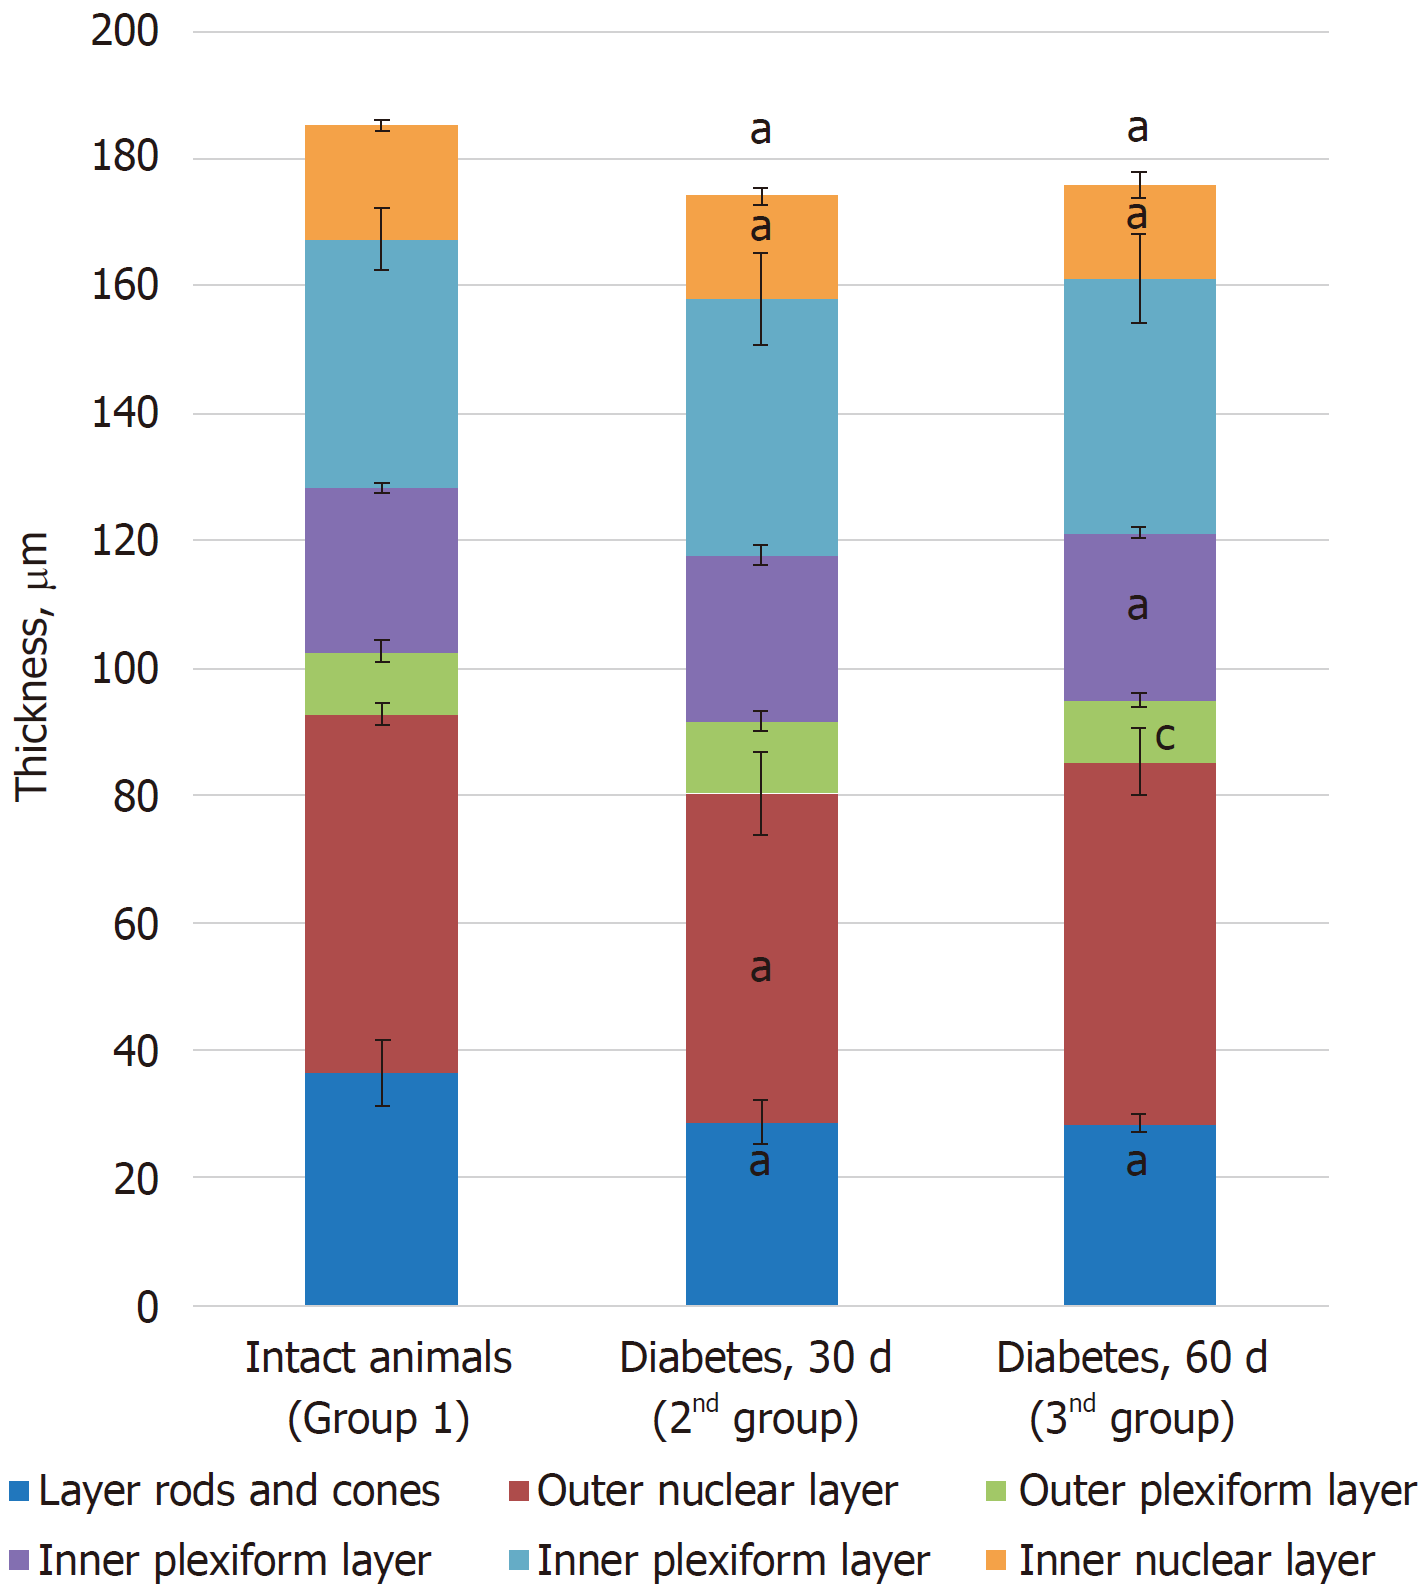
Figure 6 Morphometric examination of retinal layers of experimental groups.
aDifferences compared to control animals were significant at P < 0.05; cDifferences to animals with diabetes for 30 d were significant at P < 0.05.
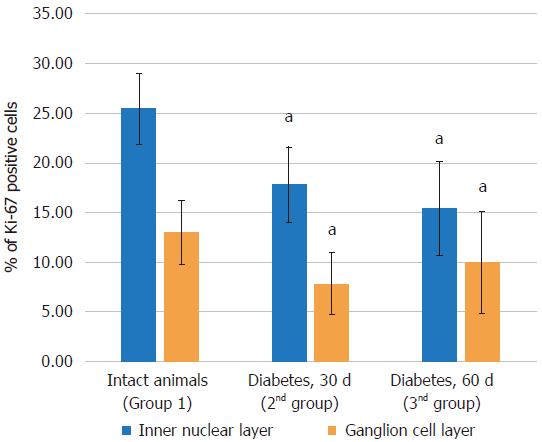
Figure 7 Relative content of Ki-67 positive cells from the total number of cells in the inner nuclear and ganglionic layers of the retina.
aDifferences compared to control animals were significant at P < 0.05.
Figure 8 Ki-67 staining of the retina.
A: Control animals; B: Diabetes at 30 d; C: Diabetes at 60 d.
Figure 9 Posterior wall of the eye of an animal with diabetes at 60 d.
A: Light microscopy of the retina; *: interstitial edema; v: full blood vessels; B: Electron microscopy of the outer layers of the retina; *: destruction of rods and cones; C: Light microscopy of the choroid of the eye; *: interstitial edema; v: full blood vessels with swollen endothelial cells; RPE: destructive changes in retinal pigment epithelial cells; MCh: destruction of pigment cells of the choroid; D: Electron microscopy of the retinal pigment epithelium and choroid; MB: uneven Bruch’s membrane with invagination sites; MCh: choroidal melanocyte with reduced amount of pigment granules; P: destructive changes in the outgrowths of retinal pigment epithelial cells; Light microscopy: staining with hematoxylin and eosin, magnification × 400, bar 50 μm; Electron microscopy: bar 10 μm.
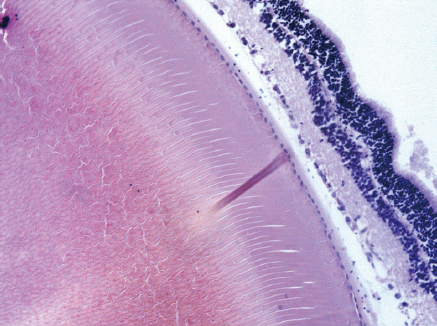
Figure 10 Fragment of the eye of an animal after alloxan administration at the dose of 30 mg/kg at 14 d.
No visible structural changes are detected. Light microscopy: staining with hematoxylin and eosin, magnification × 400.
- Citation: Danilova I, Medvedeva S, Shmakova S, Chereshneva M, Sarapultsev A, Sarapultsev P. Pathological changes in the cellular structures of retina and choroidea in the early stages of alloxan-induced diabetes. World J Diabetes 2018; 9(12): 239-251
- URL: https://www.wjgnet.com/1948-9358/full/v9/i12/239.htm
- DOI: https://dx.doi.org/10.4239/wjd.v9.i12.239


