Copyright
©The Author(s) 2017.
World J Diabetes. Apr 15, 2017; 8(4): 154-164
Published online Apr 15, 2017. doi: 10.4239/wjd.v8.i4.154
Published online Apr 15, 2017. doi: 10.4239/wjd.v8.i4.154
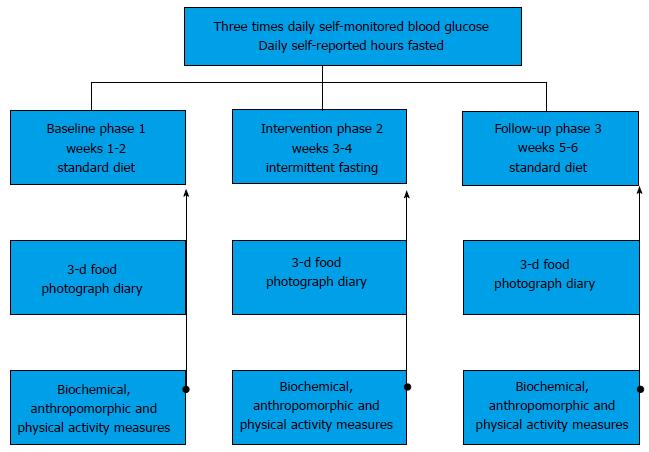
Figure 1 Study design.
During the three-phase, 6 wk study, participants engaged in normal dietary patterns (breakfast, lunch and dinner) during weeks 1-2 (Phase 1, baseline) and 5-6 (Phase 3, follow-up). For weeks 3-4 (Phase 2, intervention) participants followed the IF meal timing pattern with a goal of daily fasts for 18-20 h per day, and a 4-6 h feeding period. Ad libidum zero-calorie intake, including coffee and tea during fasting hours, was permitted. Hours fasted and self-monitored blood glucose (fasted a.m., random afternoon pre-meal, postprandial evening) was reported daily throughout the study. On the last day (day 14, 28 and 42) of each phase, biochemical (fasting bloodwork), anthropomorphic (clinical assessment), and YPAS physical activity was collected. A 3-d consecutive photographic food diary was collected during each of the three phases. YPAS: Yale Physical Activity Survey; IF: Intermittent fasting.
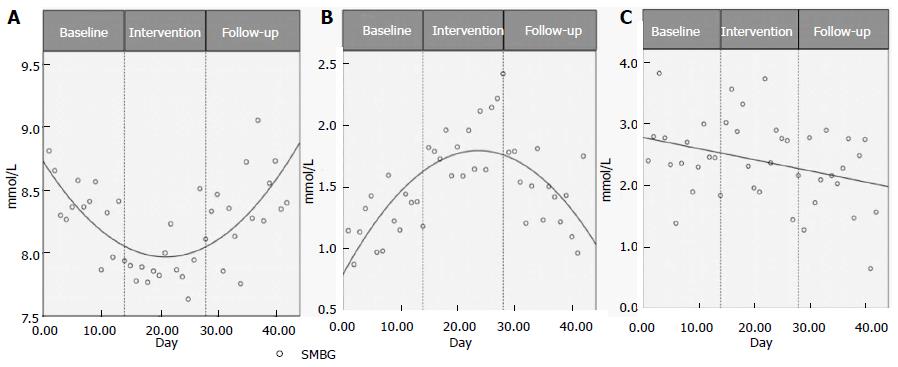
Figure 2 Intermittent Fasting improves morning fasted glucose levels and decreases postprandial variability.
The daily means for fasting morning glucose levels (from personal glucometers) on days 1 through 42 are shown in Figure 2A, with the three phases indicated. Means were calculated from pooled SMBG data from the nine individuals that provided complete log sets. Figure 2B represents the daily variance from the mean for fasting morning SMBG, days 1-42, using the Kolmogorov-Smirnov (KS) test. Figure 2C shows the daily variance from the mean for evening postprandial SMBG values on days 1-42. Inflection points of quadratic equations were calculated using the formula [f 1 (y) of C + Ax + B × 2 = 0] rounded down to the nearest full integer. A: Mean morning fasted SMBG; B: Morning fasted SMBG variability; C: Evening random SMBG variability. SMBG: Self-monitored blood glucose.
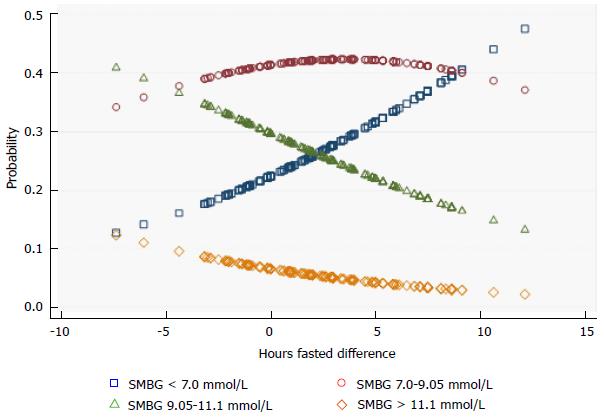
Figure 3 Positive relationship between hours fasted and morning glucose levels.
Ordinal logistic regression (OLR) tested the association between the increase in hours fasted from baseline, and the morning fasting glucose levels within the four glucose ranges noted. OLR was performed using data from the 8 individuals who had completed both their full SMBG logs and daily hours fasted logs. OLR models used the non-equalized data. Hours Fasted Difference (HFD) was calculated for baseline and intervention phases only. SMBG: Self-monitored blood glucose.
- Citation: Arnason TG, Bowen MW, Mansell KD. Effects of intermittent fasting on health markers in those with type 2 diabetes: A pilot study. World J Diabetes 2017; 8(4): 154-164
- URL: https://www.wjgnet.com/1948-9358/full/v8/i4/154.htm
- DOI: https://dx.doi.org/10.4239/wjd.v8.i4.154


