Copyright
©The Author(s) 2017.
World J Diabetes. Mar 15, 2017; 8(3): 104-111
Published online Mar 15, 2017. doi: 10.4239/wjd.v8.i3.104
Published online Mar 15, 2017. doi: 10.4239/wjd.v8.i3.104
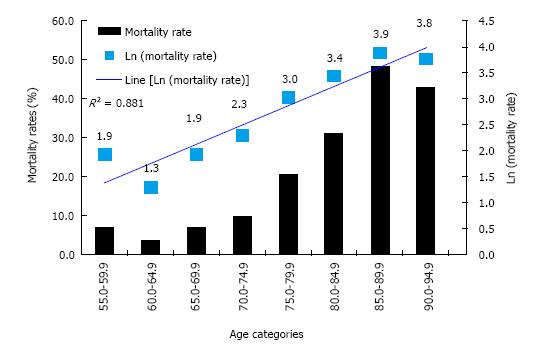
Figure 1 Association between Ln (mortality rate) and age.
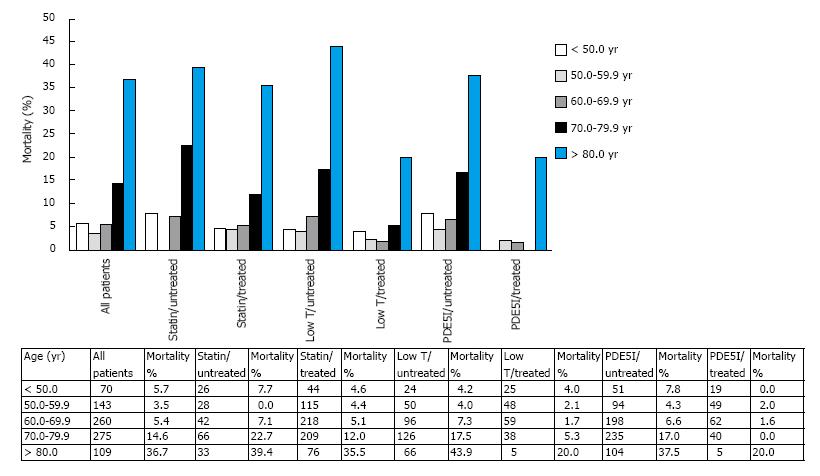
Figure 2 Mortality rates by age at death or final visit observed in the total group and treatment categories.
PDE5I: Phosphodiesterase 5-inhibitors.
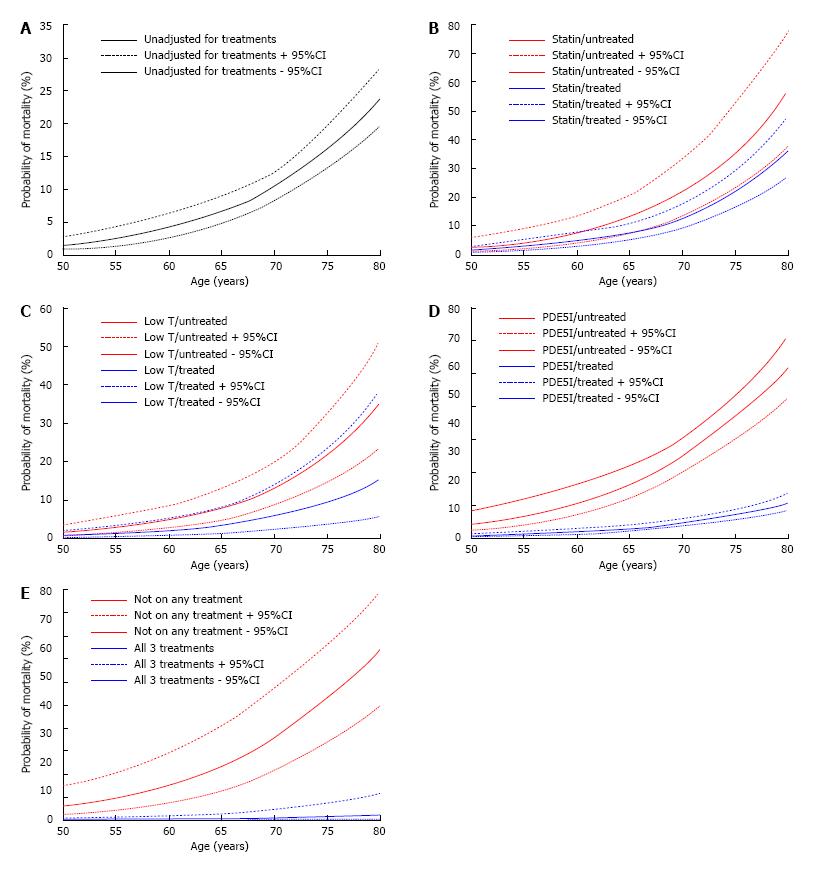
Figure 3 Association between probability of mortality and age.
The estimated mortality probability and 95%CI from the fitted logistic regression (Table 2) were calculated from the logistic regression analyses seen in Table 2 and plotted against age at death or final visit in the following groups. Age was restricted to between 50-80 years due to reduced patient numbers in the treatment (Low T/treated and PDE5I/treated) groups (> 80 years) and the exponential pattern only being evident in the total group over the age of 50 years (Figure 1). A: Total group (from Model a in Table 2); B: Men stratified by statin treatment (from Model b in Table 2); C: Men stratified by testosterone treatment (from Model c in Table 2); D: Men stratified by PDE5I treatment (from Model d in Table 2); E: Men on all and none of the above treatments (from Model e in Table 2). PDE5I: Phosphodiesterase 5-inhibitors.
- Citation: Hackett G, Jones PW, Strange RC, Ramachandran S. Statin, testosterone and phosphodiesterase 5-inhibitor treatments and age related mortality in diabetes. World J Diabetes 2017; 8(3): 104-111
- URL: https://www.wjgnet.com/1948-9358/full/v8/i3/104.htm
- DOI: https://dx.doi.org/10.4239/wjd.v8.i3.104


