Copyright
©The Author(s) 2016.
World J Diabetes. Jun 10, 2016; 7(11): 230-238
Published online Jun 10, 2016. doi: 10.4239/wjd.v7.i11.230
Published online Jun 10, 2016. doi: 10.4239/wjd.v7.i11.230
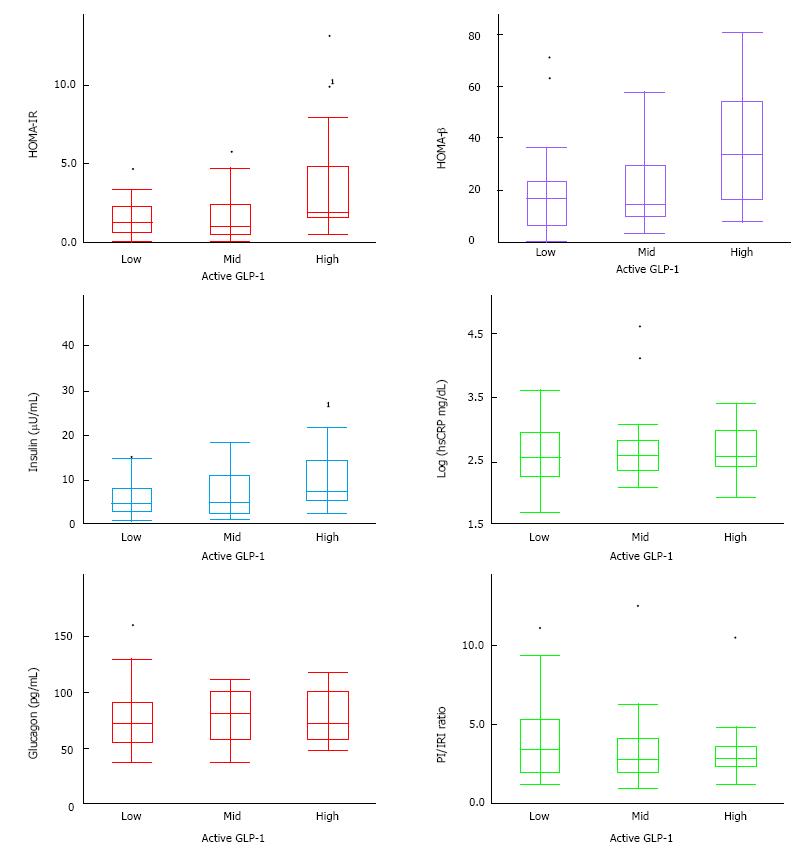
Figure 1 Baseline measurements of homeostasis model assessment of insulin resistance, HOMA-β, insulin, high sensitive C reactive protein, glucagon, and PI/insulin resistance index ratio.
Patients’ insulin resistance, insulin and glucagon secretion, and hsCRP at baseline is stratified against plasma active GLP-1 level. Data has been presented by boxplot. 1Mean statistical significance P < 0.05. GLP-1: Glucagon-like peptide-1; hsCRP: High sensitive C reactive protein.
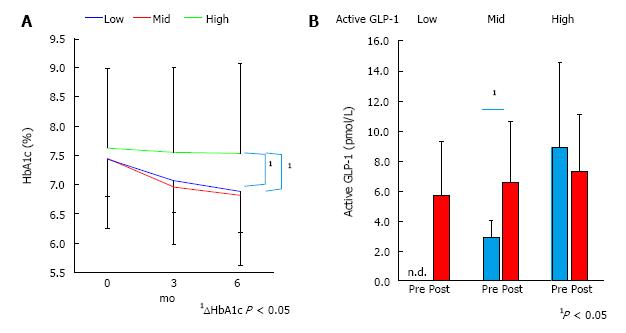
Figure 2 Hemoglobin A1c and active glucagon-like peptide-1 change by sitagliptin administration.
A: Change of HbA1c by sitagliptin administration over six months, the data is presented in mean and S.D. 1Statistical significance of change of HbA1c between the high active GLP-1 group and the low or middle groups; B: Active GLP-1 level before sitagliptin administration and after three months, stratified by plasma active GLP-1 level. Data is presented as the mean and S.D. 1Mean statistical significance P < 0.05. GLP-1: Glucagon-like peptide-1; HbA1c: Hemoglobin A1c.
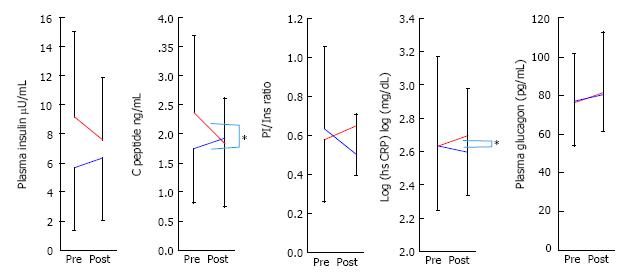
Figure 3 Change in insulin and glucagon secretion, high sensitive C reactive protein during three months of sitagliptin administration stratified against plasma active glucagon-like peptide-1 level at baseline.
The data is presented as mean and S.D. *statistical significance of change of HbA1c between the high active GLP-1 group and the low or middle groups. GLP-1: Glucagon-like peptide-1; HbA1c: Hemoglobin A1c.
- Citation: Kushiyama A, Kikuchi T, Tanaka K, Tahara T, Takao T, Onishi Y, Yoshida Y, Kawazu S, Iwamoto Y. Prediction of the effect on antihyperglycaemic action of sitagliptin by plasma active form glucagon-like peptide-1. World J Diabetes 2016; 7(11): 230-238
- URL: https://www.wjgnet.com/1948-9358/full/v7/i11/230.htm
- DOI: https://dx.doi.org/10.4239/wjd.v7.i11.230


