Copyright
©The Author(s) 2015.
World J Diabetes. Apr 15, 2015; 6(3): 489-499
Published online Apr 15, 2015. doi: 10.4239/wjd.v6.i3.489
Published online Apr 15, 2015. doi: 10.4239/wjd.v6.i3.489
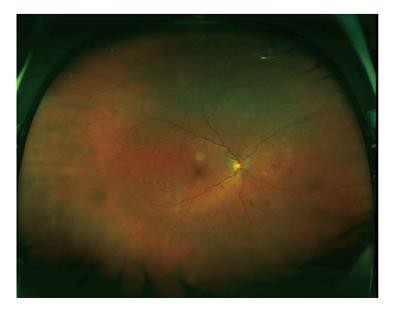
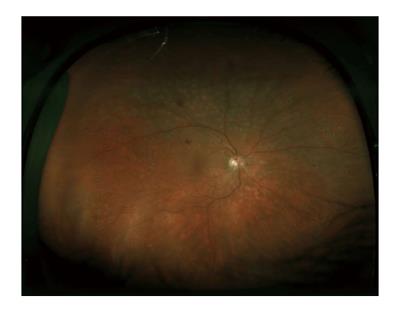
Figure 1 Non-proliferative diabetic retinopathy.
Wide-field fundus photo of a 65-year-old female patient (right eye) showing several retinal hemorrhages.
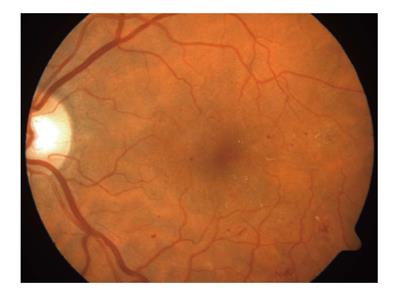
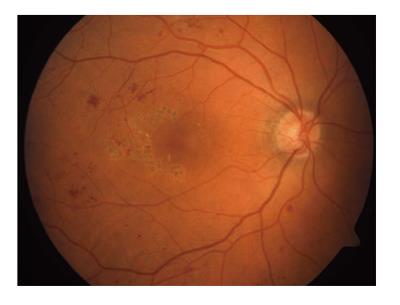
Figure 2 Non-proliferative diabetic retinopathy.
Color fundus photo of a 51-year-old male patient with micro-aneurysms and lipid exudates.
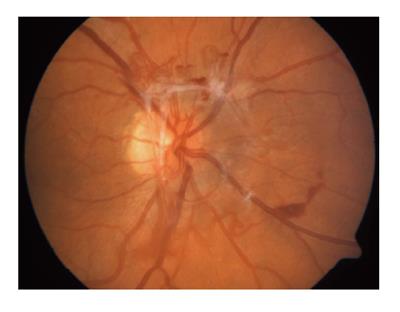
Figure 3 Proliferative diabetic retinopathy with neovascularization at disk.
Figure 4 Advanced proliferative diabetic retinopathy with neovascularization and limited vitreous hemorrhage.
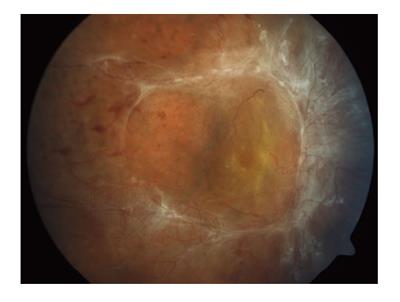
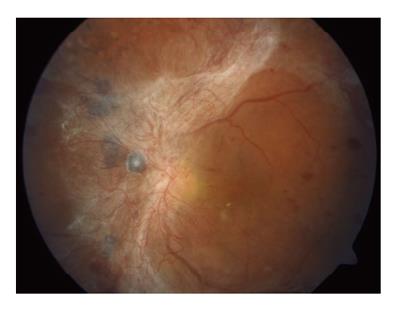
Figure 5 Advanced proliferative diabetic retinopathy with tractional retinal detachment.
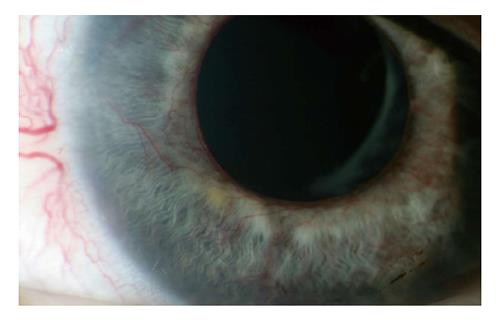
Figure 6 Neovascularization of the iris.
These neovascular vessels may block the trabecular meshwork and cause neovascular glaucoma.
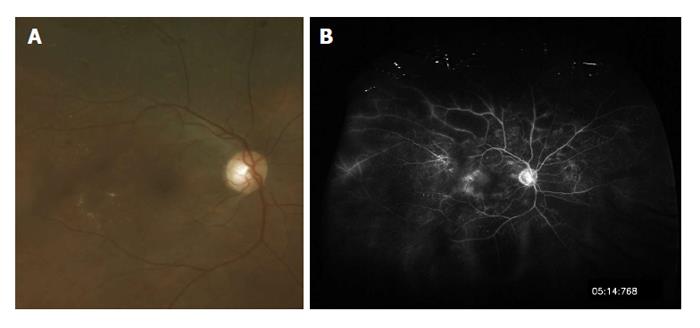
Figure 7 Clinically significant diabetic macular edema without involvement of the fovea.
A: Fundus photo; B: Fluorescein angiogram depicting leakage of perifoveal retinal blood vessels.
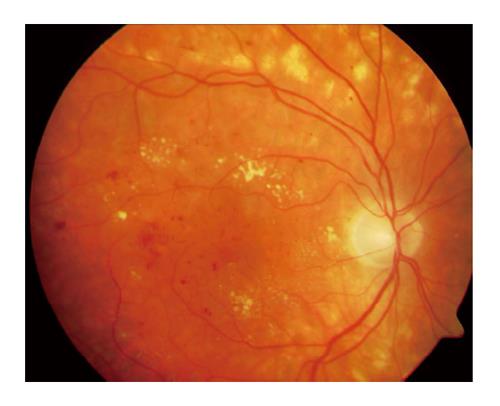
Figure 8 Center-involving diabetic macular edema with subfoveal edema and numerous lipid exudates.
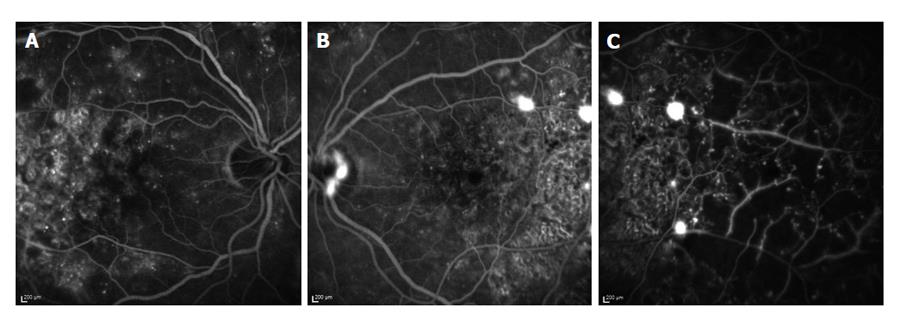
Figure 9 Fluorescein angiogram of a 49-year-old female patient.
A: Fluorescein angiogram of the right eye 50 s after intravenous injection of fluorescein dye. Here, leaking micro-aneurysms in the macula can be seen; B: Fluorescein angiogram of the left eye 25 s after intravenous injection of fluorescein dye. Leakage from neovascular blood vessels causes spots of increased fluorescence at the optic disk and temporal to the fovea; C: Fluorescein angiogram of the temporal part of the left eye 30 s after intravenous injection of fluorescein dye. Areas of retinal non-perfusion can be seen as reason for neovascularization.
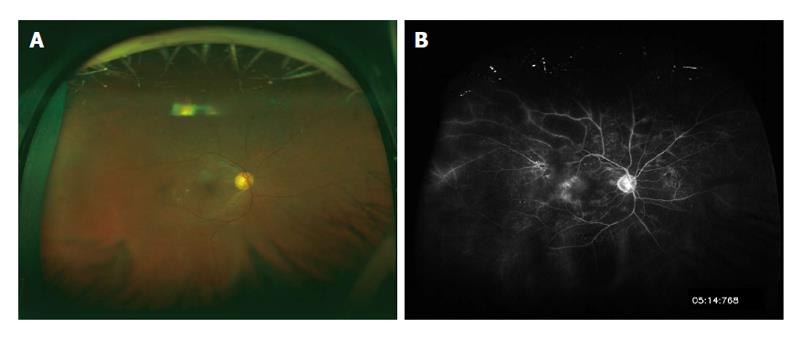
Figure 10 Wide-field picture of the right eye of a 65-year-old female patient.
A: On scanning-laser-ophthalmoscope-Imaging some micro-aneurysms and lipid exudates can be seen; B: Fluorescein angiogram shows leakage from micro-aneurysms and extensive areas of retinal non-perfusion.
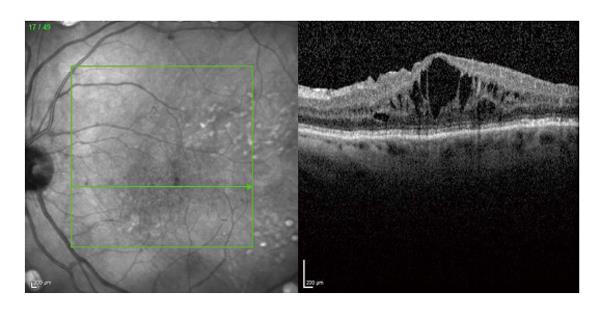
Figure 11 Spectral-domain optical coherence tomography of a female patient with center-involving diabetic macular edema.
On the left side of the picture, an infra-red image shows the exact location of the OCT-scan on the right. The OCT-scan visualizes intraretinal edema with thickening of the fovea. OCT: Optical coherence tomography.
Figure 12 Color fundus photo of a 53-year-old male patient several months after focal laser photocoagulation because of clinical significant diabetic macular edema.
While the laser scars and some remaining dot-hemorrhages are visible, lipid exudates and retinal edema have disappeared.
Figure 13 Wide-field picture of the right eye of a 48-year-old male patient after pan-retinal laser photocoagulation because of proliferative diabetic retinopathy.
The peripheral laser scars can be seen in the picture, while neovascularization have regressed.
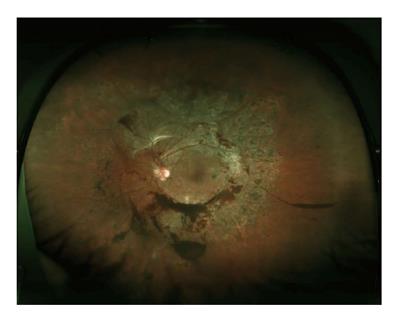
Figure 14 Proliferative diabetic retinopathy with extensive fibro-vascular membranes.
- Citation: Nentwich MM, Ulbig MW. Diabetic retinopathy - ocular complications of diabetes mellitus. World J Diabetes 2015; 6(3): 489-499
- URL: https://www.wjgnet.com/1948-9358/full/v6/i3/489.htm
- DOI: https://dx.doi.org/10.4239/wjd.v6.i3.489


