Copyright
©2014 Baishideng Publishing Group Inc.
World J Diabetes. Aug 15, 2014; 5(4): 415-419
Published online Aug 15, 2014. doi: 10.4239/wjd.v5.i4.415
Published online Aug 15, 2014. doi: 10.4239/wjd.v5.i4.415
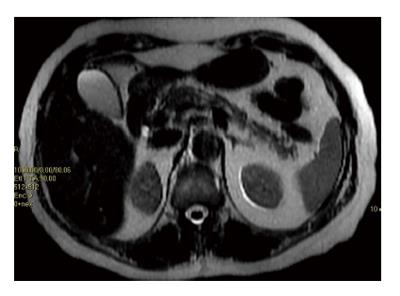
Figure 1 Magnetic resonance imaging using force sensitive resistor T2 sequence, showing the presence of fat infiltration in body and tail of the pancreas.
The fat present is hyperintense (white) as the abdominal fat, while the pancreatic normal tissue is hypointense.
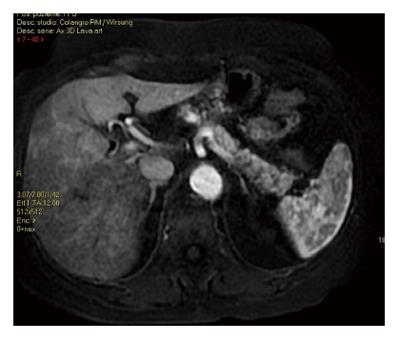
Figure 2 Magnetic resonance imaging during the arterial phase showing the presence of diffuse fat infiltration in the body and tail of the pancreas.
The fat present in the pancreatic gland is black using LAVA sequence (LAVA combines contrast-enhanced, multi-phase imaging of the abdomen with high resolution, large coverage and uniform fat suppression).
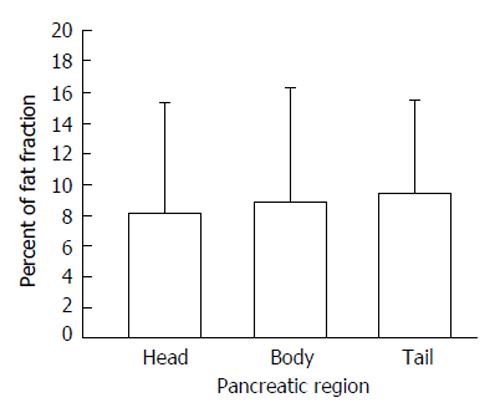
Figure 3 Percent of fat fraction according to three pancreatic regions; data are reported as mean and standard deviation (modified from reference[13]).
- Citation: Pezzilli R, Calculli L. Pancreatic steatosis: Is it related to either obesity or diabetes mellitus? World J Diabetes 2014; 5(4): 415-419
- URL: https://www.wjgnet.com/1948-9358/full/v5/i4/415.htm
- DOI: https://dx.doi.org/10.4239/wjd.v5.i4.415


