Copyright
©2014 Baishideng Publishing Group Inc.
World J Diabetes. Jun 15, 2014; 5(3): 364-371
Published online Jun 15, 2014. doi: 10.4239/wjd.v5.i3.364
Published online Jun 15, 2014. doi: 10.4239/wjd.v5.i3.364
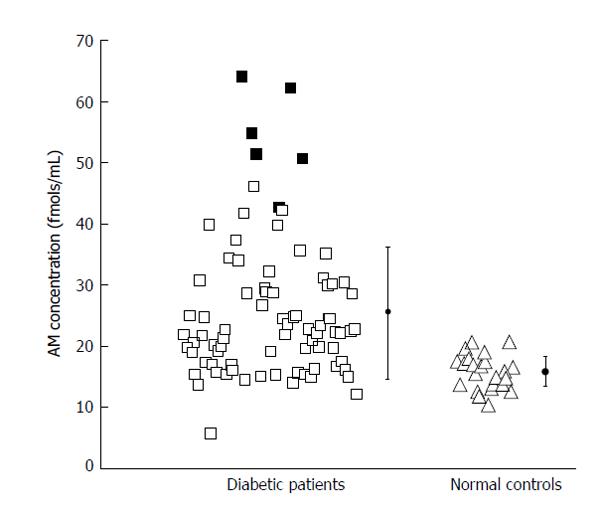
Figure 1 Adrenomedullin concentrations in blood serum from type 2 diabetic patients (in squares) and normal controls (in triangles), shaded squares are outliers.
Reprinted from [63].
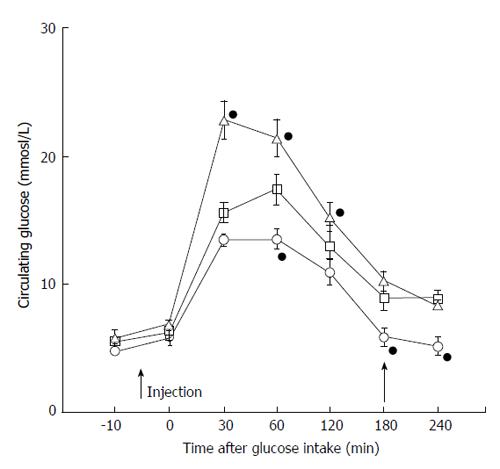
Figure 2 Glucose tolerance test in obese diabetic SHR/N-cp rats after injection of saline (squares), adrenomedullin (triangles) and anti-adrenomedullin monoclonal antibody MoAb-G6 (circles).
Black spots indicates point with significant difference compared with saline controls. Modified and reprinted from [63].
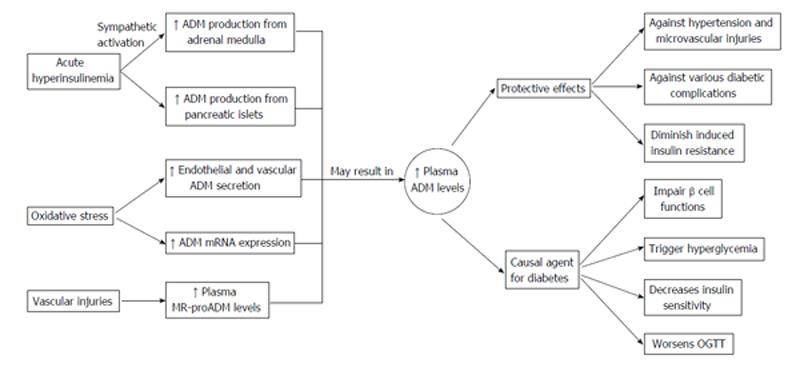
Figure 3 Effects of different disease stresses on subsequent adrenomedullin production and plasma adrenomedullin levels, and the possible roles of increased adrenomedullin levels in type 2 diabetes.
ADM: Adrenomedullin.
- Citation: Wong HK, Tang F, Cheung TT, Cheung BMY. Adrenomedullin and diabetes. World J Diabetes 2014; 5(3): 364-371
- URL: https://www.wjgnet.com/1948-9358/full/v5/i3/364.htm
- DOI: https://dx.doi.org/10.4239/wjd.v5.i3.364


