Copyright
©2013 Baishideng Publishing Group Co.
World J Diabetes. Dec 15, 2013; 4(6): 339-348
Published online Dec 15, 2013. doi: 10.4239/wjd.v4.i6.339
Published online Dec 15, 2013. doi: 10.4239/wjd.v4.i6.339
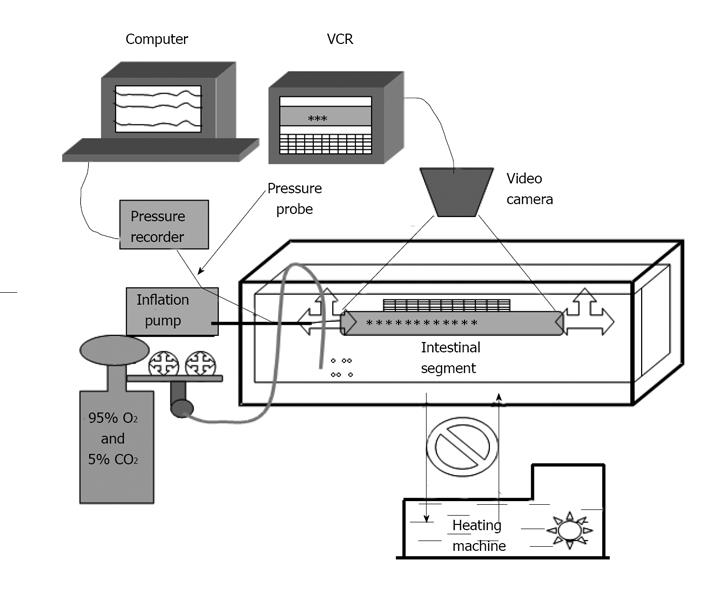
Figure 1 Experimental set-up.
The organ bath is composed of an inside chamber and an outside chamber. The Krebs solution contained in the small chamber was maintained constant at 37 °C by circulating hot water in the big chamber using a heating machine. The intestinal segment was placed in the small organ bath in the Krebs solution. The intestinal distension was applied by a pump and a pressure probe was used to measure the pressures. The diameter changes of the intestinal segments were videotaped through a stereomicroscope.
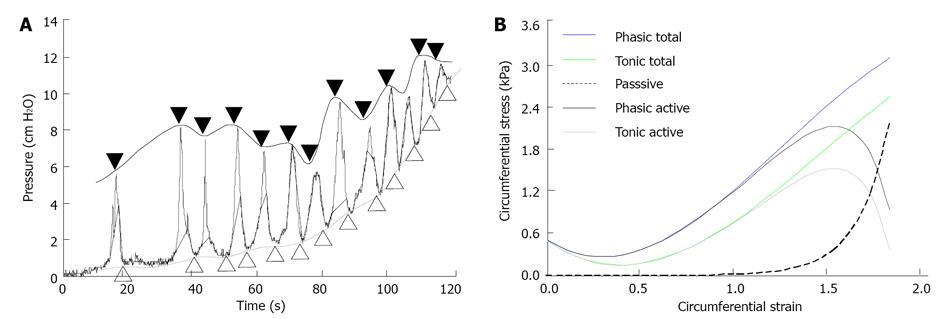
Figure 2 Pressure-diameter curve used for set-up maximum and baseline of contraction, and example of stress-strain curves.
A: Maximum amplitudes during contraction and the baseline between the contractions during distension. The closed symbols above the curve mark the phasic part (black line). The open symbols under the curve mark the tonic part (gray line). The pressures from the phasic and tonic parts were used to compute the total phasic and tonic stresses; B: An example of passive, total phasic, total tonic, phasic active and tonic active stresses as function of strains from a normal animal. The passive stress increased exponentially as function of strain, whereas the total phasic and tonic stresses increased in a polynomial way. The phasic and tonic active stresses were obtained by the total phasic and tonic stresses minus the passive stress.
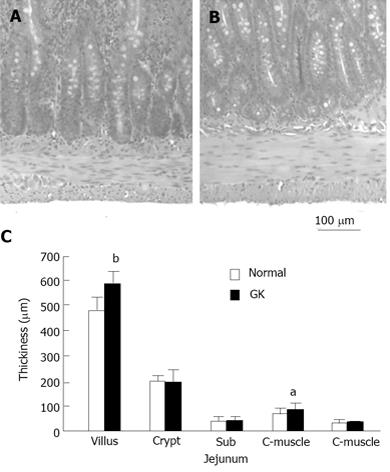
Figure 3 Histological dada.
The top figure illustrates the example of jejunal muscle layer in Normal (A) and GK (B) rats. The increasing muscle layer thickness was noted in GK diabetic rat. The bottom figure (C) shows the jejunal layer thickness in two different groups. The villous height and circumferential muscle layer thickness were significantly bigger in GK group (Compared with normal group: aP < 0.05, bP < 0.01). GK: Goto-Kakizaki.
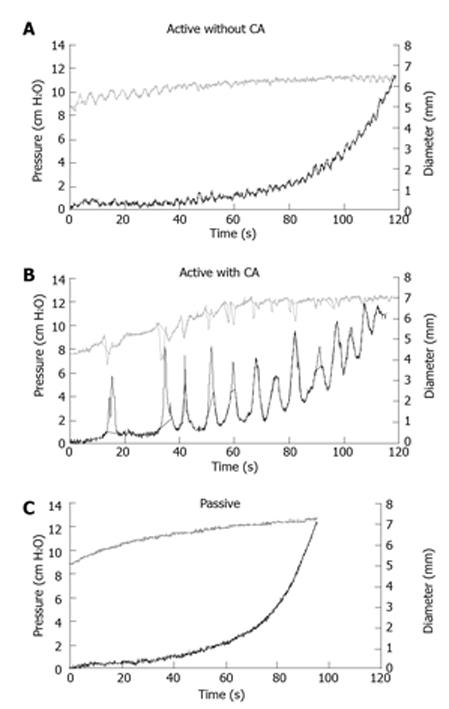
Figure 4 Examples of pressure-diameter curves.
Illustration of ramp distension curves of the pressure and diameter of jejunal segment with and without CA application obtained from a Normal rat. Waves of peristaltic contraction were clearly observed (top and middle). The smooth muscle contraction was abolished by papaverine (bottom). The CA application enhanced the peristaltic contraction (middle). CA: Carbachol.
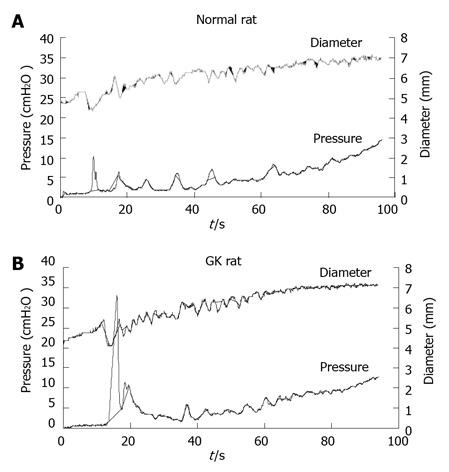
Figure 5 Pressure-diameter curves from normal and goto-Kakizaki groups.
Illustration of ramp distension curves of the pressure and diameter of jejunal segment with carbachol application obtained from a Normal (top) and a GK diabetic (bottom) rats. Higher peak of contraction was observed in the GK diabetic rat. CA: Carbachol; GK: Goto-Kakizaki.
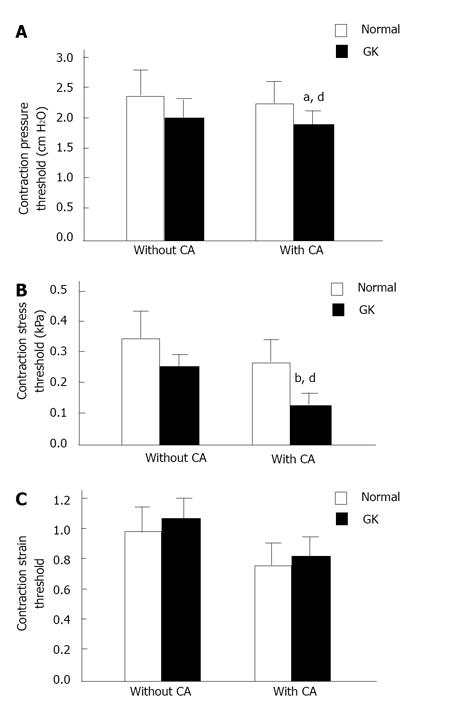
Figure 6 Contraction thresholds.
Illustration of the pressures (top), stresses (middle) and strains (bottom) at the contraction threshold in two different groups. The pressure and stress thresholds were significantly decreased in GK group after CA stimulation (compared with Normal group, pressure threshold, aP < 0.05; stress threshold, bP < 0.01). Furthermore, the pressure and stress thresholds were significantly decreased in GK group with CA application (compared with without CA, dP < 0.01) but not in Normal group (P > 0.05). The strain at the contraction threshold did not differ between two different groups (P > 0.05) and between before and after CA application (P > 0.05). CA: Carbachol; GK: Goto-Kakizaki.
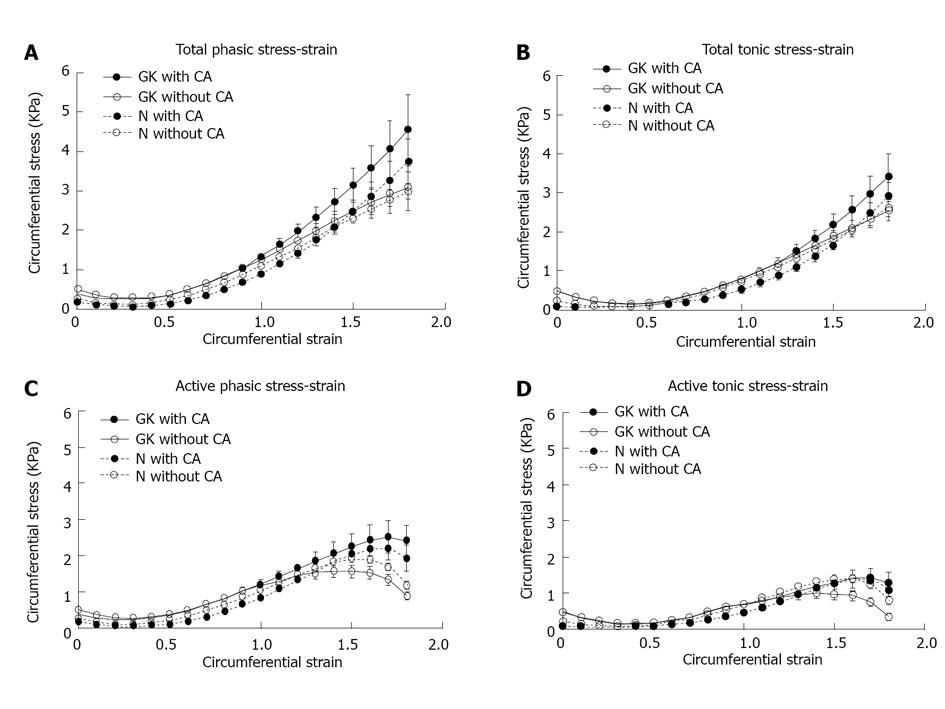
Figure 7 Phasic and tonic stresses as function of strains.
The total phasic (A) and tonic stresses (B) as function of strains are presented in the top and the computed active phasic (C) and tonic stresses (D) as function of strain in the bottom. The amplitude of total phasic, total tonic, active phasic and active tonic circumferential stresses did not differ without CA application but significantly increased after CA application in GK group compared those with Normal group (P < 0.05). Furthermore, the maximum for the active phasic and active tonic stresses differed (P < 0.01). CA: Carbachol; GK: Goto-Kakizaki.
Figure 8 Normalized active phasic and tonic stresses as function of strains.
The normalized active phasic (top) and tonic stresses (bottom) illustrated as function of strains. When normalized to muscle layer thickness, the amplitude of active stresses significantly decreased without CA application (P < 0.05) and did not differ after CA application (P > 0.05). CA: Carbachol.
- Citation: Zhao JB, Chen PM, Gregersen H. Changes of phasic and tonic smooth muscle function of jejunum in type 2 diabetic Goto-Kakizaki rats. World J Diabetes 2013; 4(6): 339-348
- URL: https://www.wjgnet.com/1948-9358/full/v4/i6/339.htm
- DOI: https://dx.doi.org/10.4239/wjd.v4.i6.339


