Copyright
©2012 Baishideng Publishing Group Co.
World J Diabetes. Apr 15, 2012; 3(4): 65-70
Published online Apr 15, 2012. doi: 10.4239/wjd.v3.i4.65
Published online Apr 15, 2012. doi: 10.4239/wjd.v3.i4.65
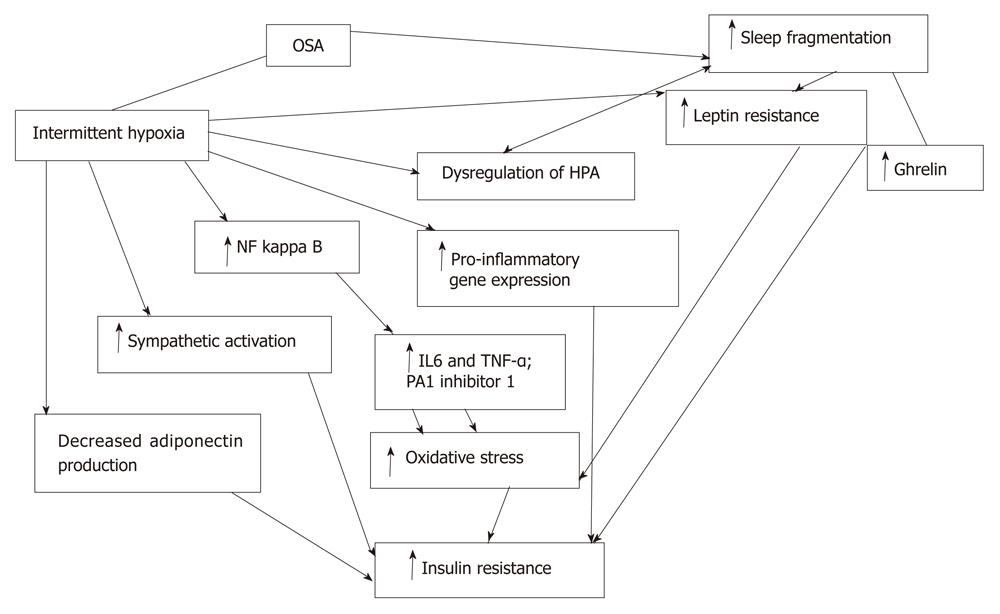
Figure 1 Flow diagram demonstrating interplay between intermittent hypoxia and sleep fragmentation, and insulin resistance.
OSA: Obstructive sleep apnea; NFκB: Nuclear factor kappa B; PA1: Plasminogen activator inhibitor 1; HPA: Hypothalamopituitary axis; IL: Interleukin; TNFα: Tumor necrosis factor-alpha; ISI: Insulin sensitivity index.
- Citation: Surani S, Subramanian S. Effect of continuous positive airway pressure therapy on glucose control. World J Diabetes 2012; 3(4): 65-70
- URL: https://www.wjgnet.com/1948-9358/full/v3/i4/65.htm
- DOI: https://dx.doi.org/10.4239/wjd.v3.i4.65


