Copyright
©The Author(s) 2025.
World J Diabetes. Aug 15, 2025; 16(8): 106967
Published online Aug 15, 2025. doi: 10.4239/wjd.v16.i8.106967
Published online Aug 15, 2025. doi: 10.4239/wjd.v16.i8.106967
Figure 1 Clarke Error Grid Analysis, Parkes 1 Error Grid Analysis, and Parkes 2 Error Grid Analysis comparing the sensor glucose readings from the FreeStyle Libre H flash continuous glucose monitoring system with plasma glucose values in women with gestational diabetes mellitus and type 2 diabetes mellitus.
Dots in zones A, B, and D are colored blue, yellow, and brown, respectively. A: Clarke Error Grid Analysis; B: Parkes 1 Error Grid Analysis; C: Parkes 2 Error Grid Analysis.
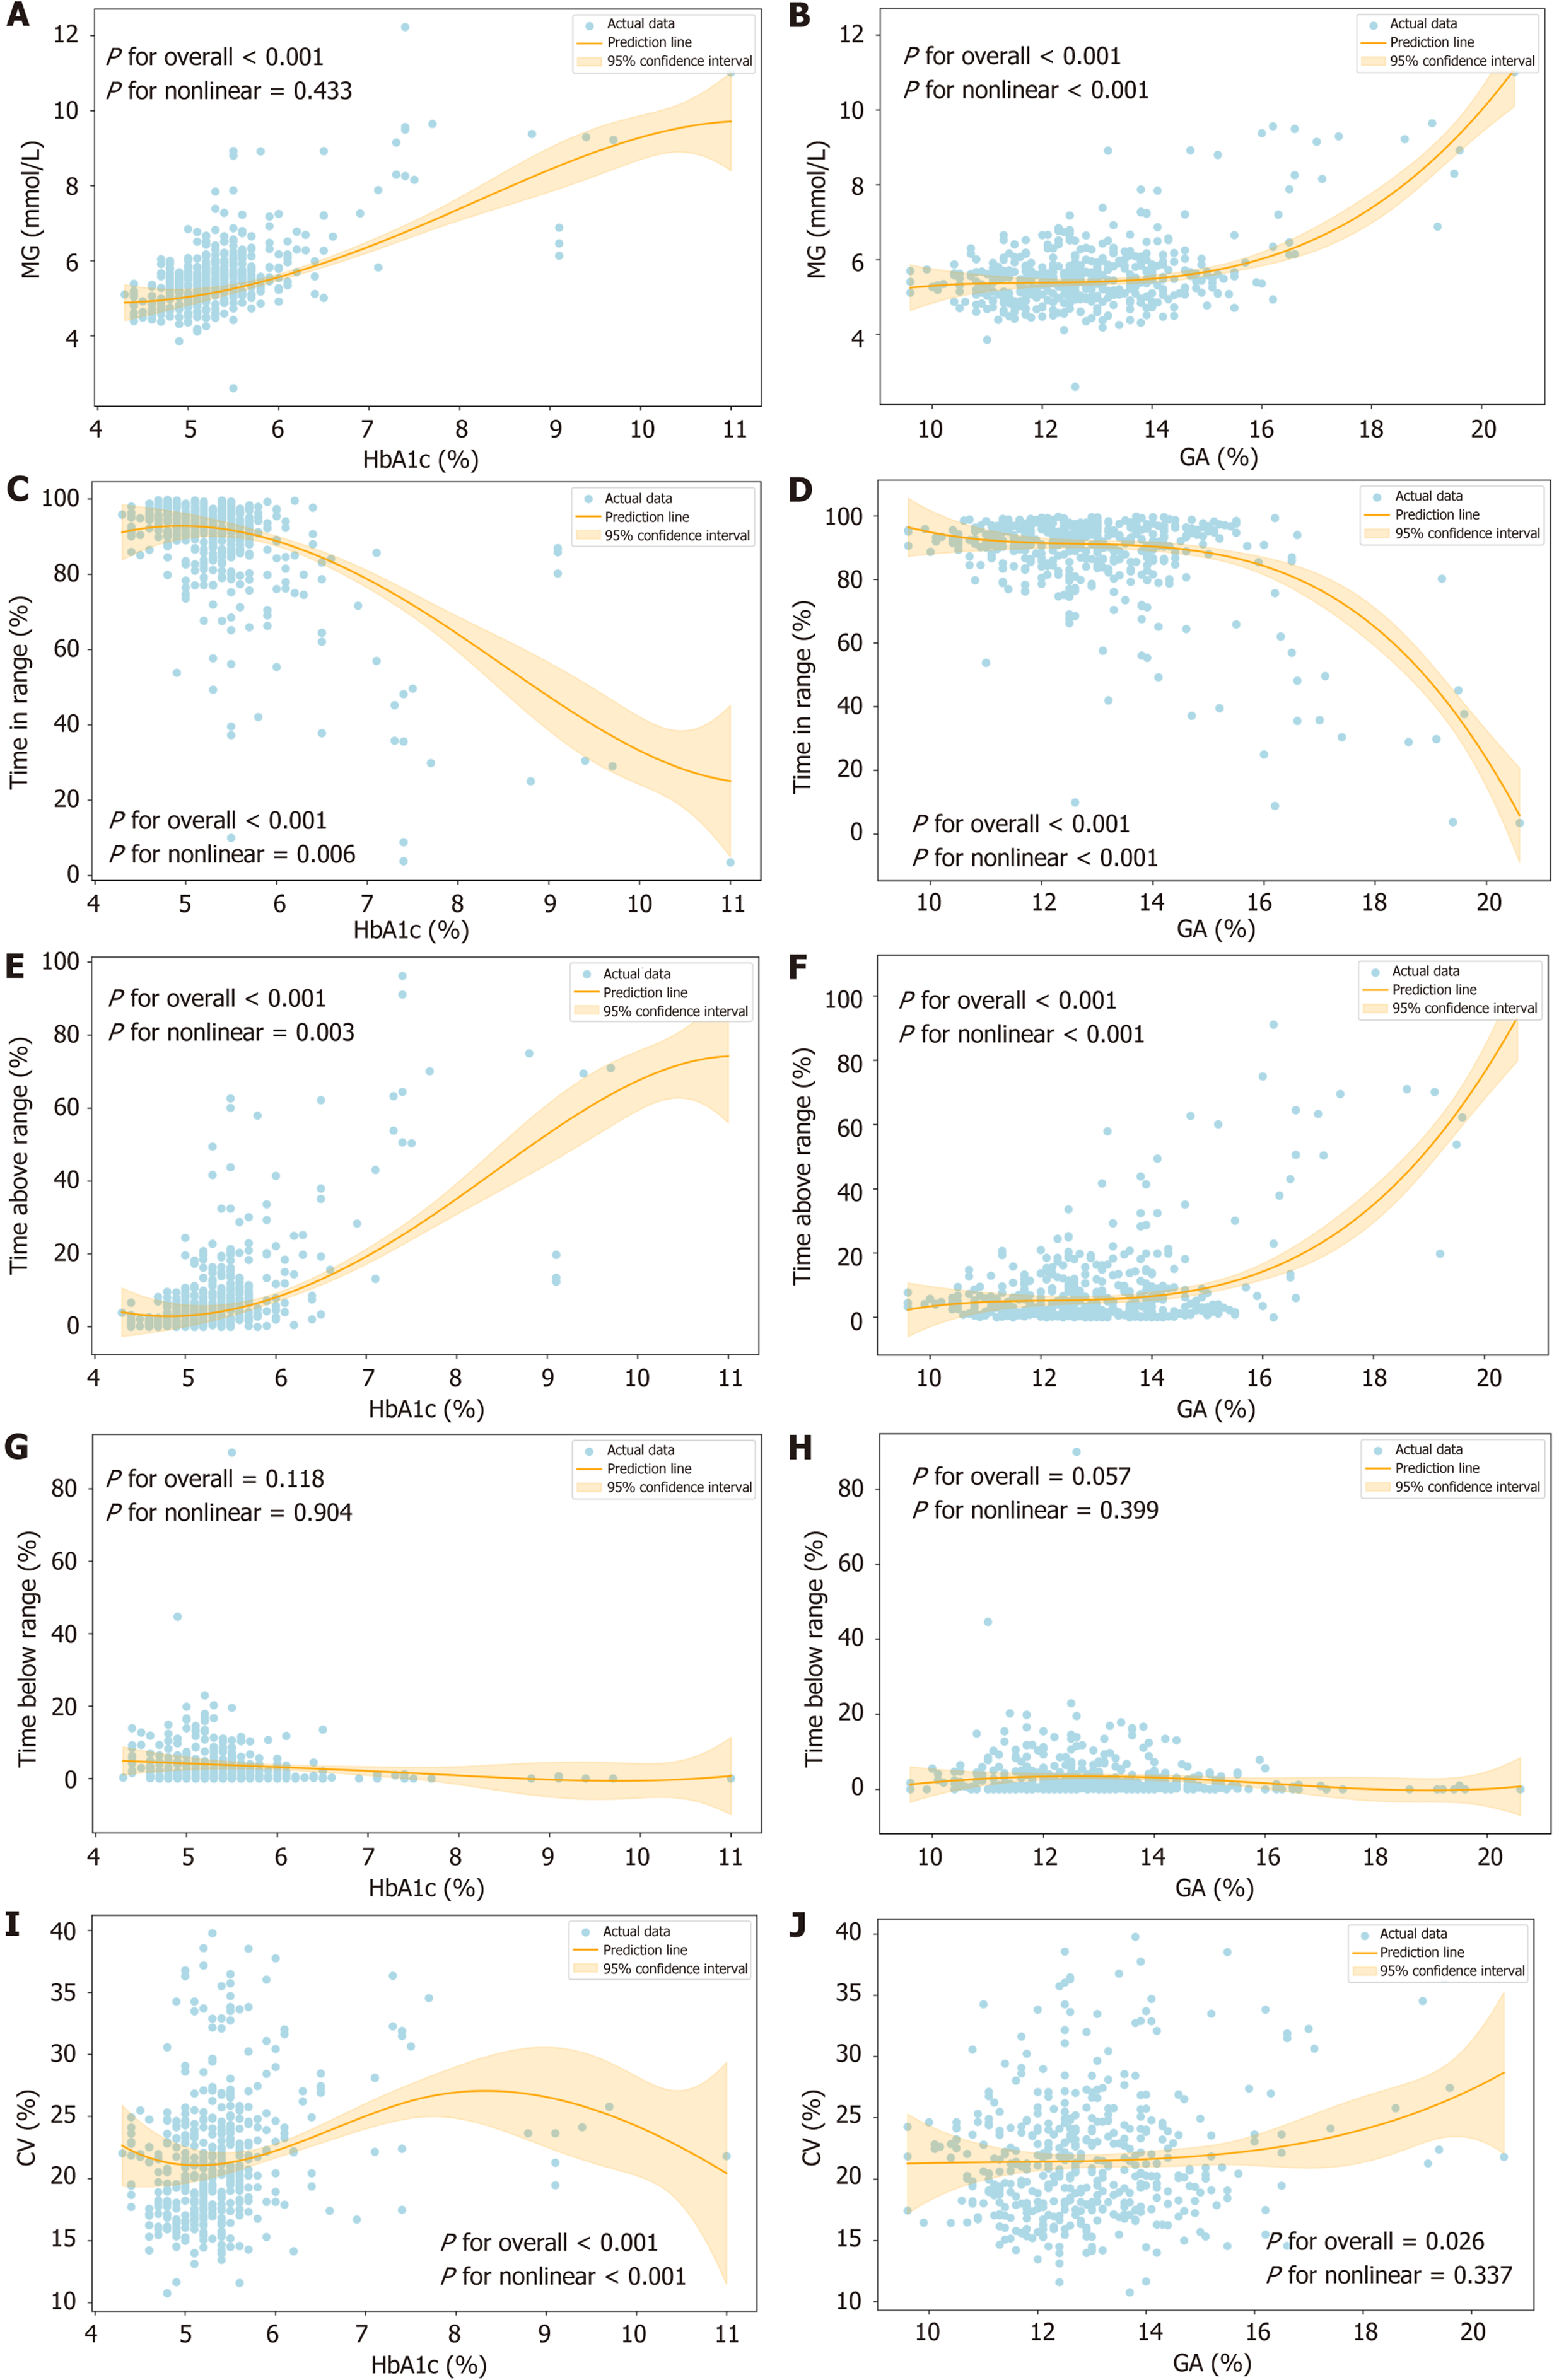
Figure 2 The relationship between flash continuous glucose monitoring metrics and hemoglobin A1c/glycated albumin during pregnancy.
Each solid line represents the best-fit curve derived from the restricted cubic spline (RCS) models. The shaded areas represent the 95% confidence intervals. Time in range (TIR) is defined as the proportion of time spent within the target blood glucose range (3.5-7.8 mmol/L). Time above range (TAR) indicates the percentage of time with glucose levels > 7.8 mmol/L, while time below range (TBR) indicates the percentage of time with glucose levels < 3.5 mmol/L. A: RCS illustrating the relationship between hemoglobin A1c (HbA1c) and mean glucose; B: RCS illustrating the relationship between glycated albumin (GA) and mean glucose; C: RCS illustrating the relationship between HbA1c and TIR; D: RCS illustrating the relationship between GA and TIR; E: RCS illustrating the relationship between HbA1c and TAR; F: RCS illustrating the relationship between GA and TAR; G: RCS illustrating the relationship between HbA1c and TBR; H: RCS illustrating the relationship between GA and TBR; I: RCS illustrating the relationship between HbA1c and coefficient of variation; J: RCS illustrating the relationship between GA and coefficient of variation. HbA1c: Hemoglobin A1c; GA: Glycated albumin; MG: Mean glucose; CV: Coefficient of variation.
- Citation: Lyu L, Huang YL, Huang Y, Wu ZY, Ping F, Li YX. Performance of flash continuous glucose monitoring and glycemic marker correlations in Chinese pregnant women with non-type 1 diabetes. World J Diabetes 2025; 16(8): 106967
- URL: https://www.wjgnet.com/1948-9358/full/v16/i8/106967.htm
- DOI: https://dx.doi.org/10.4239/wjd.v16.i8.106967


