Copyright
©The Author(s) 2025.
World J Diabetes. Jul 15, 2025; 16(7): 107019
Published online Jul 15, 2025. doi: 10.4239/wjd.v16.i7.107019
Published online Jul 15, 2025. doi: 10.4239/wjd.v16.i7.107019
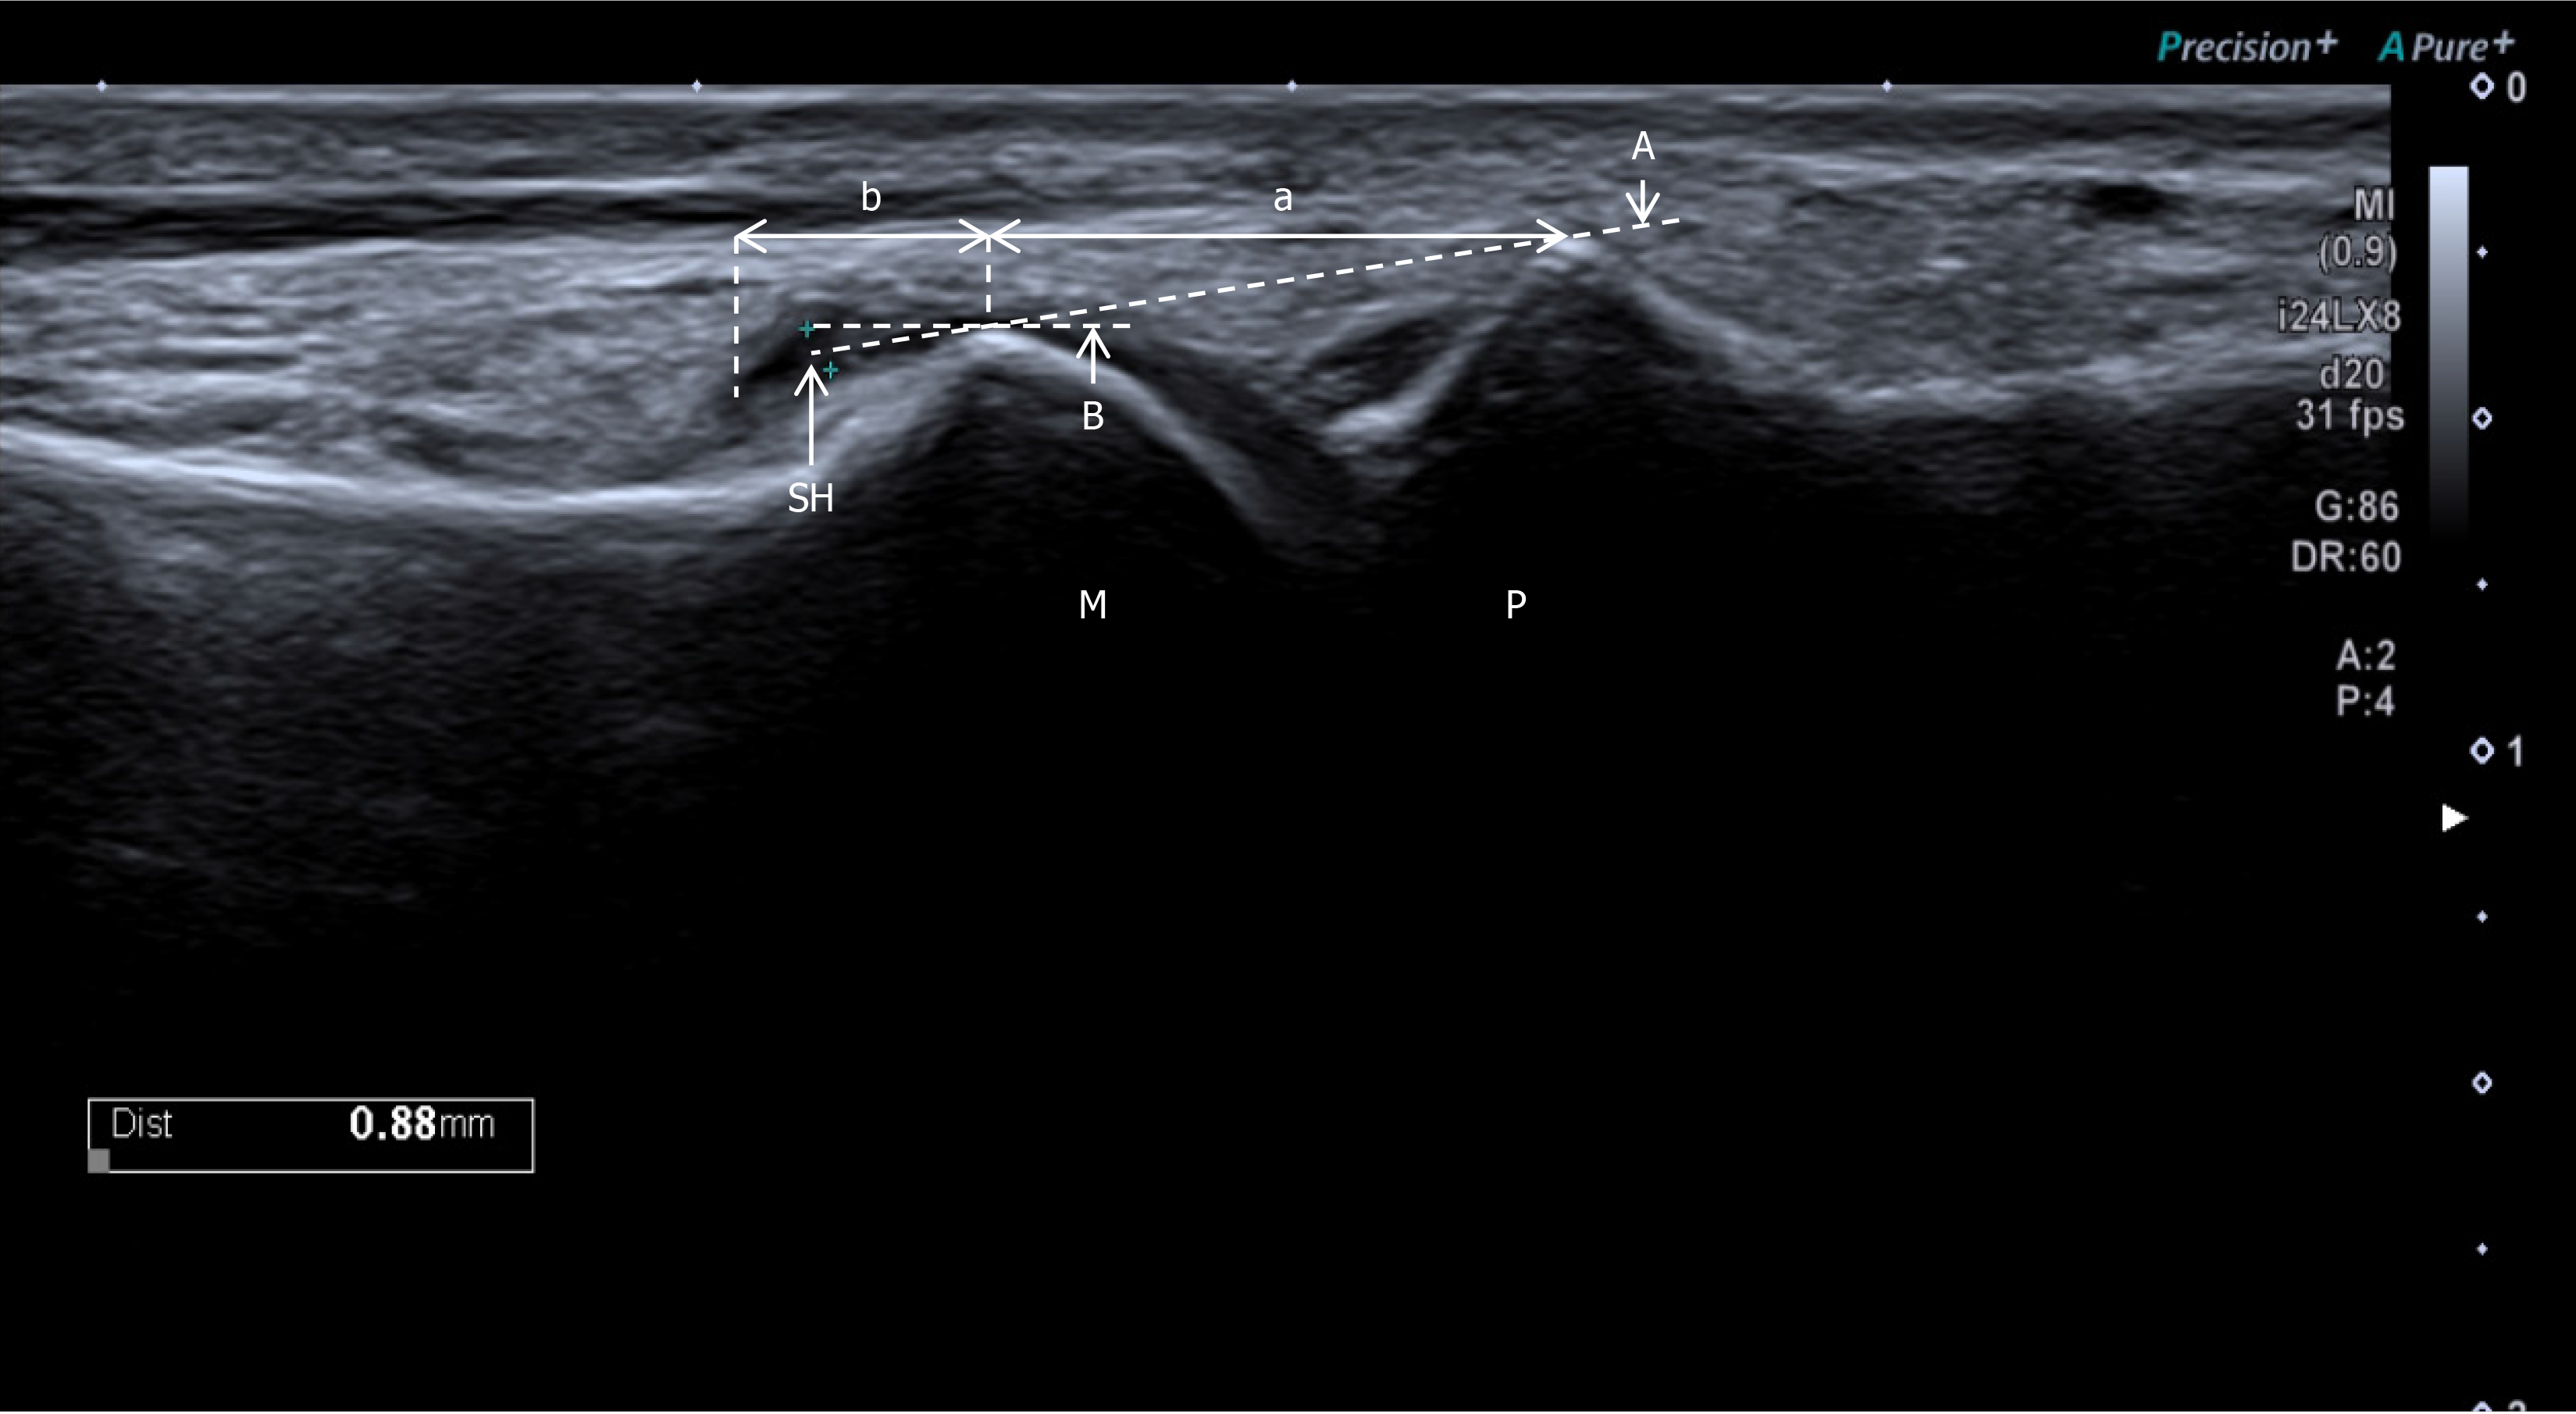
Figure 1 Schematic diagram of ultrasonographic semi-quantitative grading of synovial hypertrophy of the metatarsophalangeal joint.
M: Metatarsal head; P: Proximal phalanx; SH: Synovial hypertrophy; A: The line connecting the apices; B: The horizontal line of the metatarsal head apex; a: The region between the articulating bones apices; b: The region from metatarsal head apex to diaphysis. For synovial hypertrophy (thickness 0.88 mm) in region b, using line A as the reference line, synovial hypertrophy will be judged as grade 2, and using line B as the reference line, it will be judged as grade 1.
Figure 2 Ultrasound characteristics of semi-quantitative grading of metatarsophalangeal joint synovial hypertrophy located in the region from metatarsal head apex to diaphysis.
A: Mild synovial hypertrophy (1b); B: Moderate synovial hypertrophy (2b); C: Severe synovial hypertrophy (3b). M: Metatarsal head; P: Proximal phalanx; SH: Synovial hypertrophy; Dashed line: The horizontal line of the metatarsal head apex.
- Citation: Li QS, Xiao XH, Cai YY, Xiao XP, Hu PX, Li H. First metatarsophalangeal joint synovial hypertrophy associated with vitamin D status in type 2 diabetes mellitus: An ultrasound-graded study. World J Diabetes 2025; 16(7): 107019
- URL: https://www.wjgnet.com/1948-9358/full/v16/i7/107019.htm
- DOI: https://dx.doi.org/10.4239/wjd.v16.i7.107019


