Copyright
©The Author(s) 2025.
World J Diabetes. Jul 15, 2025; 16(7): 106890
Published online Jul 15, 2025. doi: 10.4239/wjd.v16.i7.106890
Published online Jul 15, 2025. doi: 10.4239/wjd.v16.i7.106890
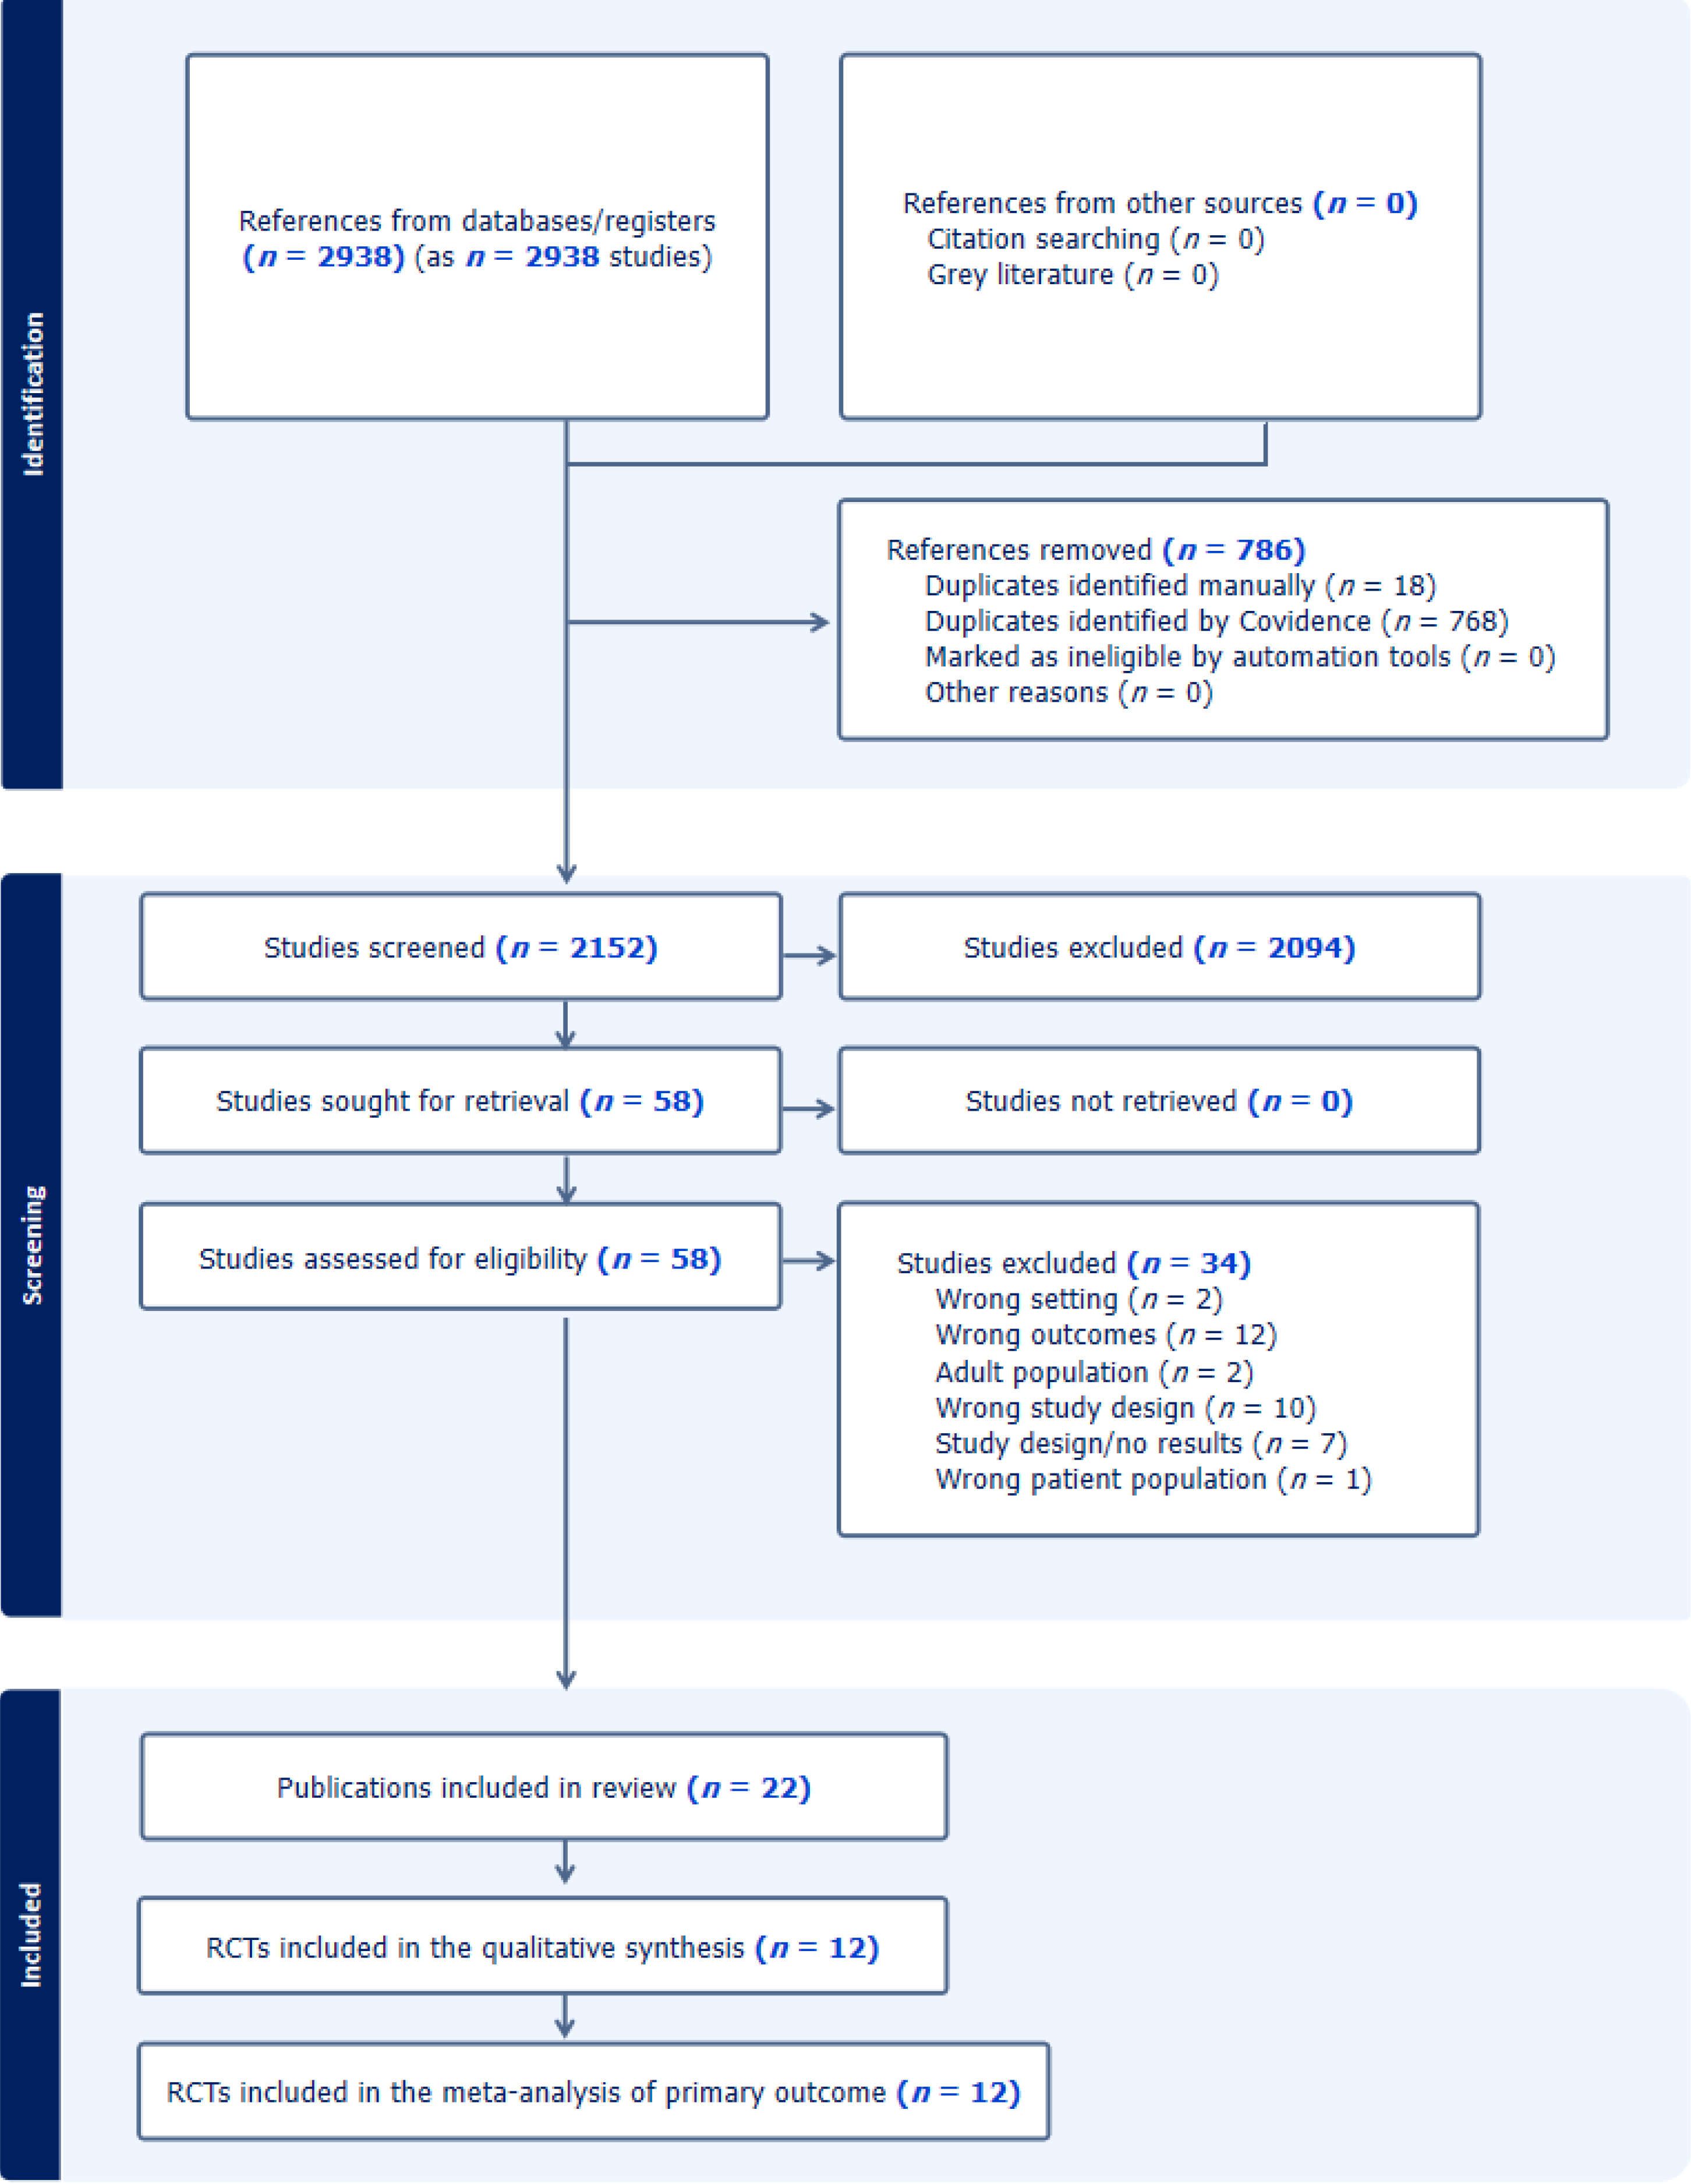
Figure 1 The study flow diagram and the selection process.
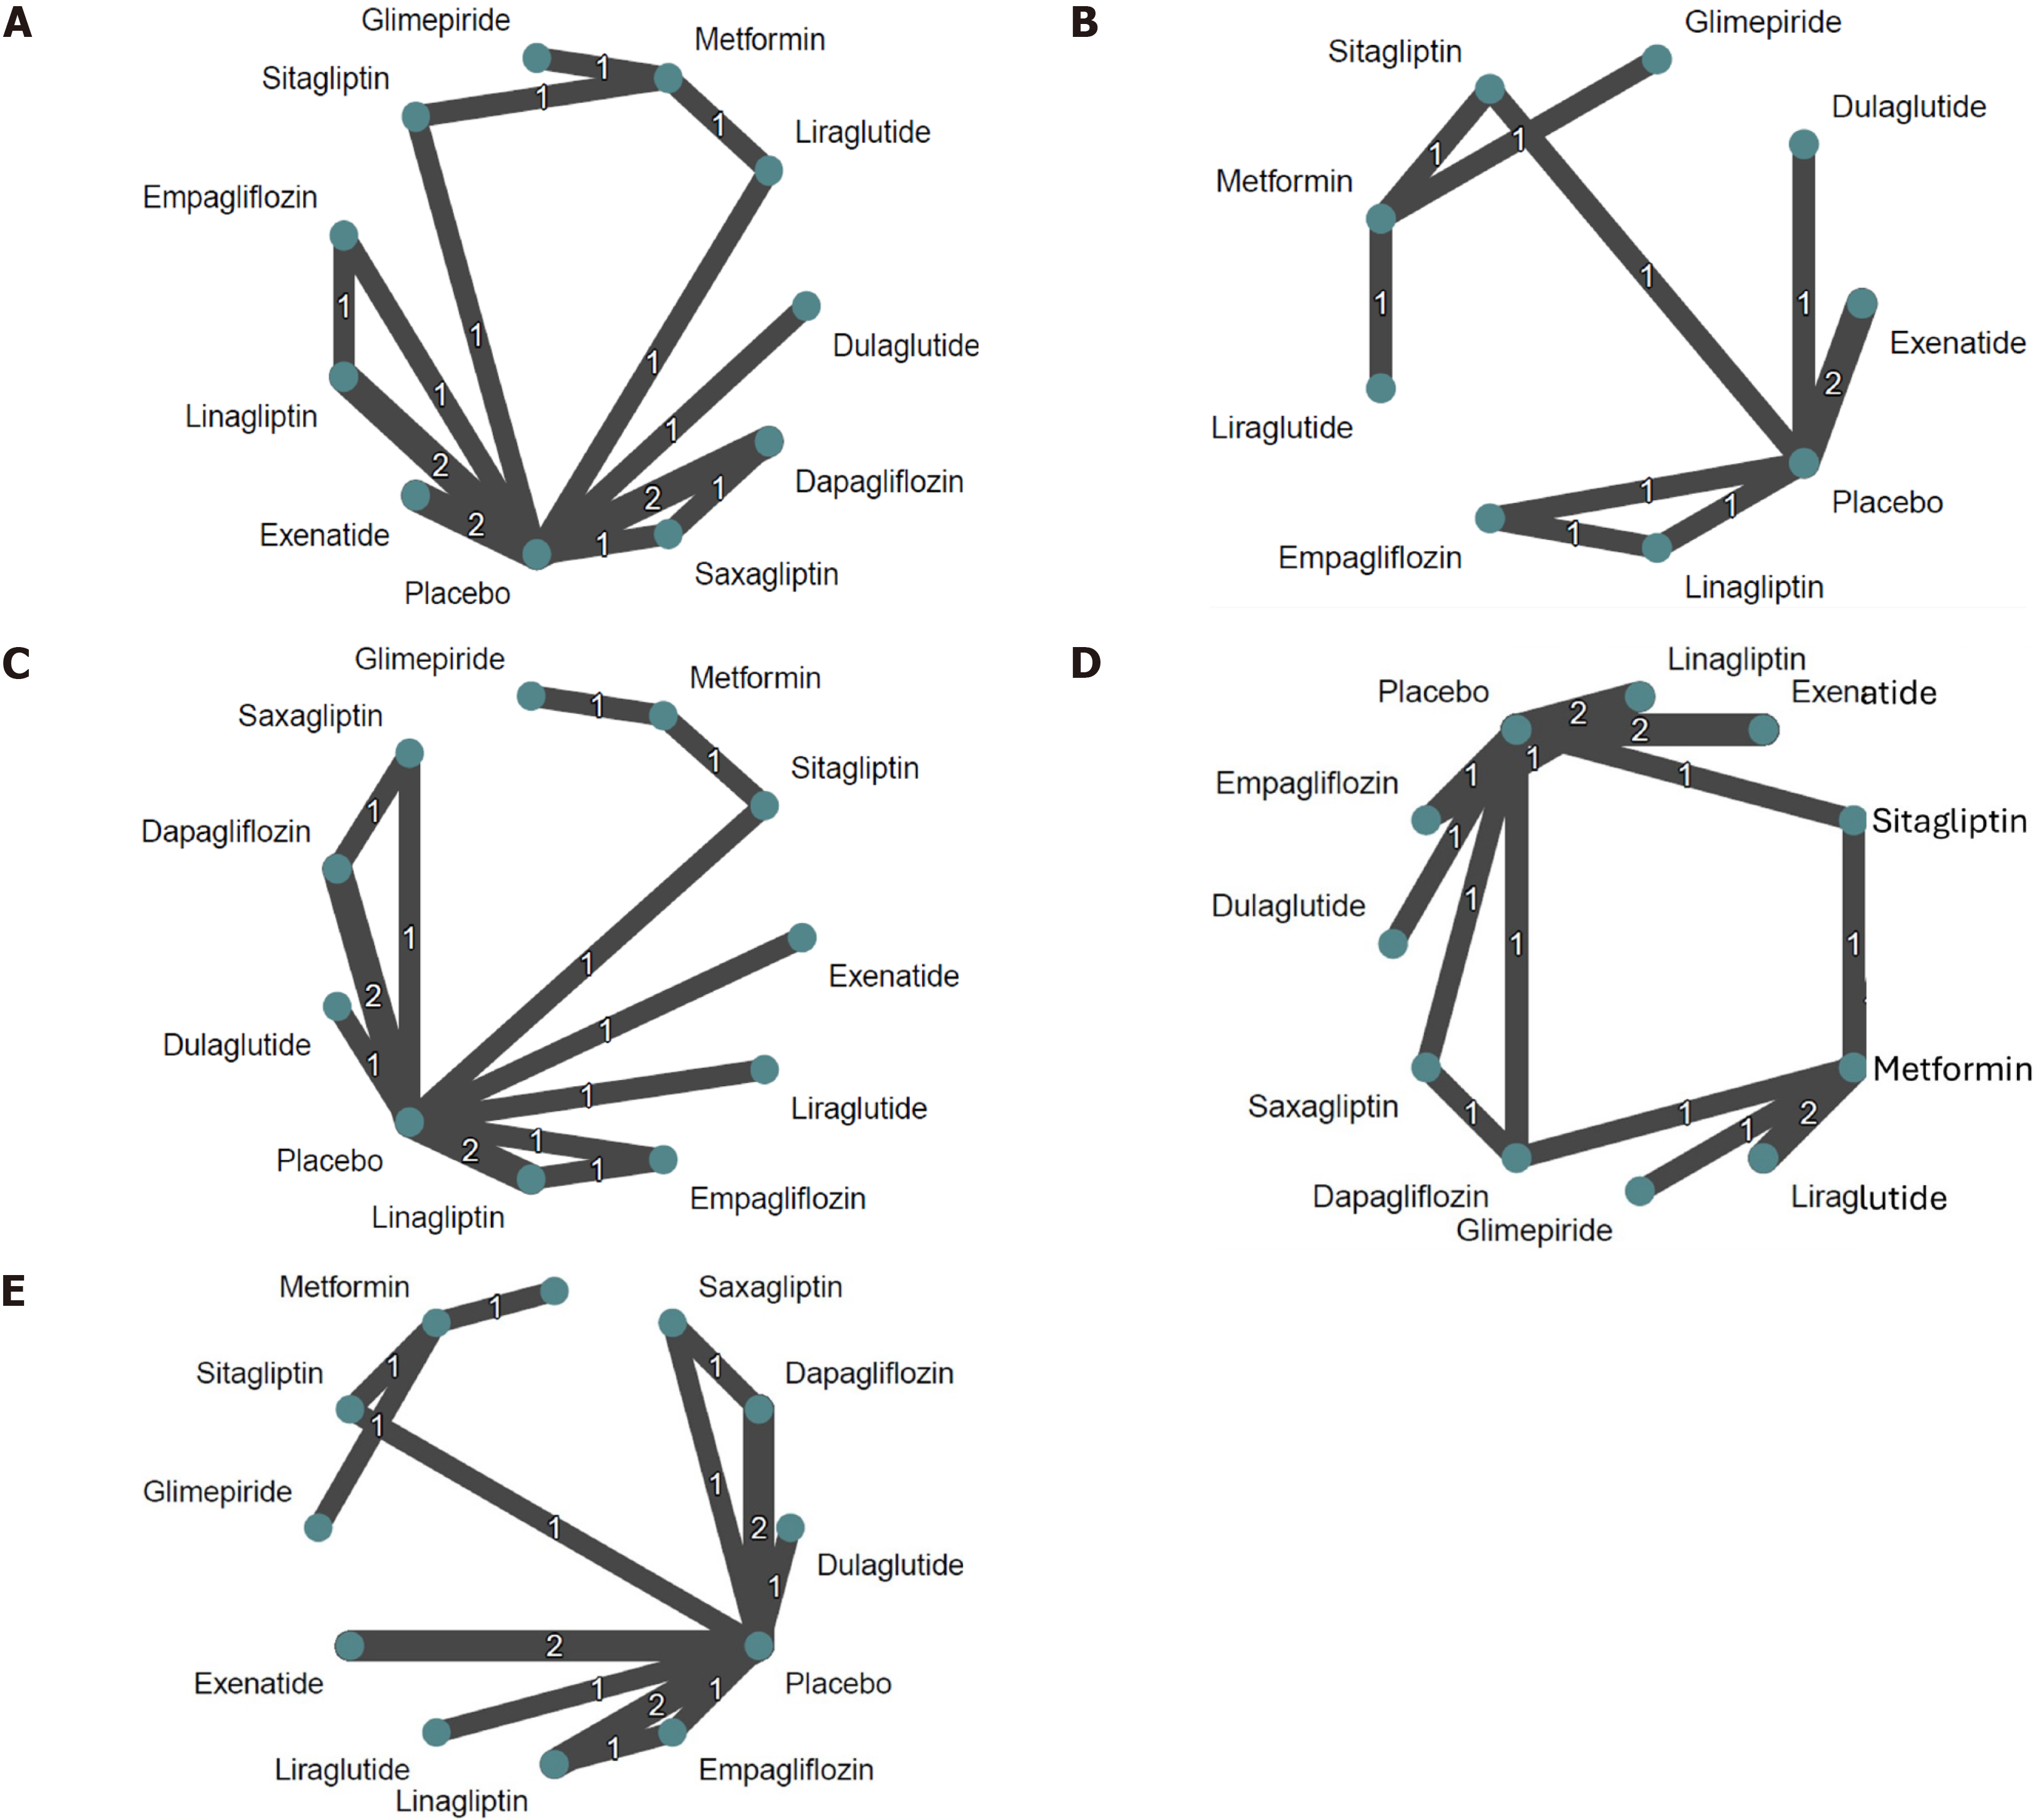
Figure 2 Network plots.
A: Connections between each study agent included in the randomized controlled trials that assessed glycated hemoglobin; B: Network map for connections between each study agent included in the randomized controlled trials that assessed body weight changes; C: Network graph for level 1 hypoglycemia; D: Network map for minor adverse events; E: Network graph for serious adverse events. 1One study only; 2two studies.
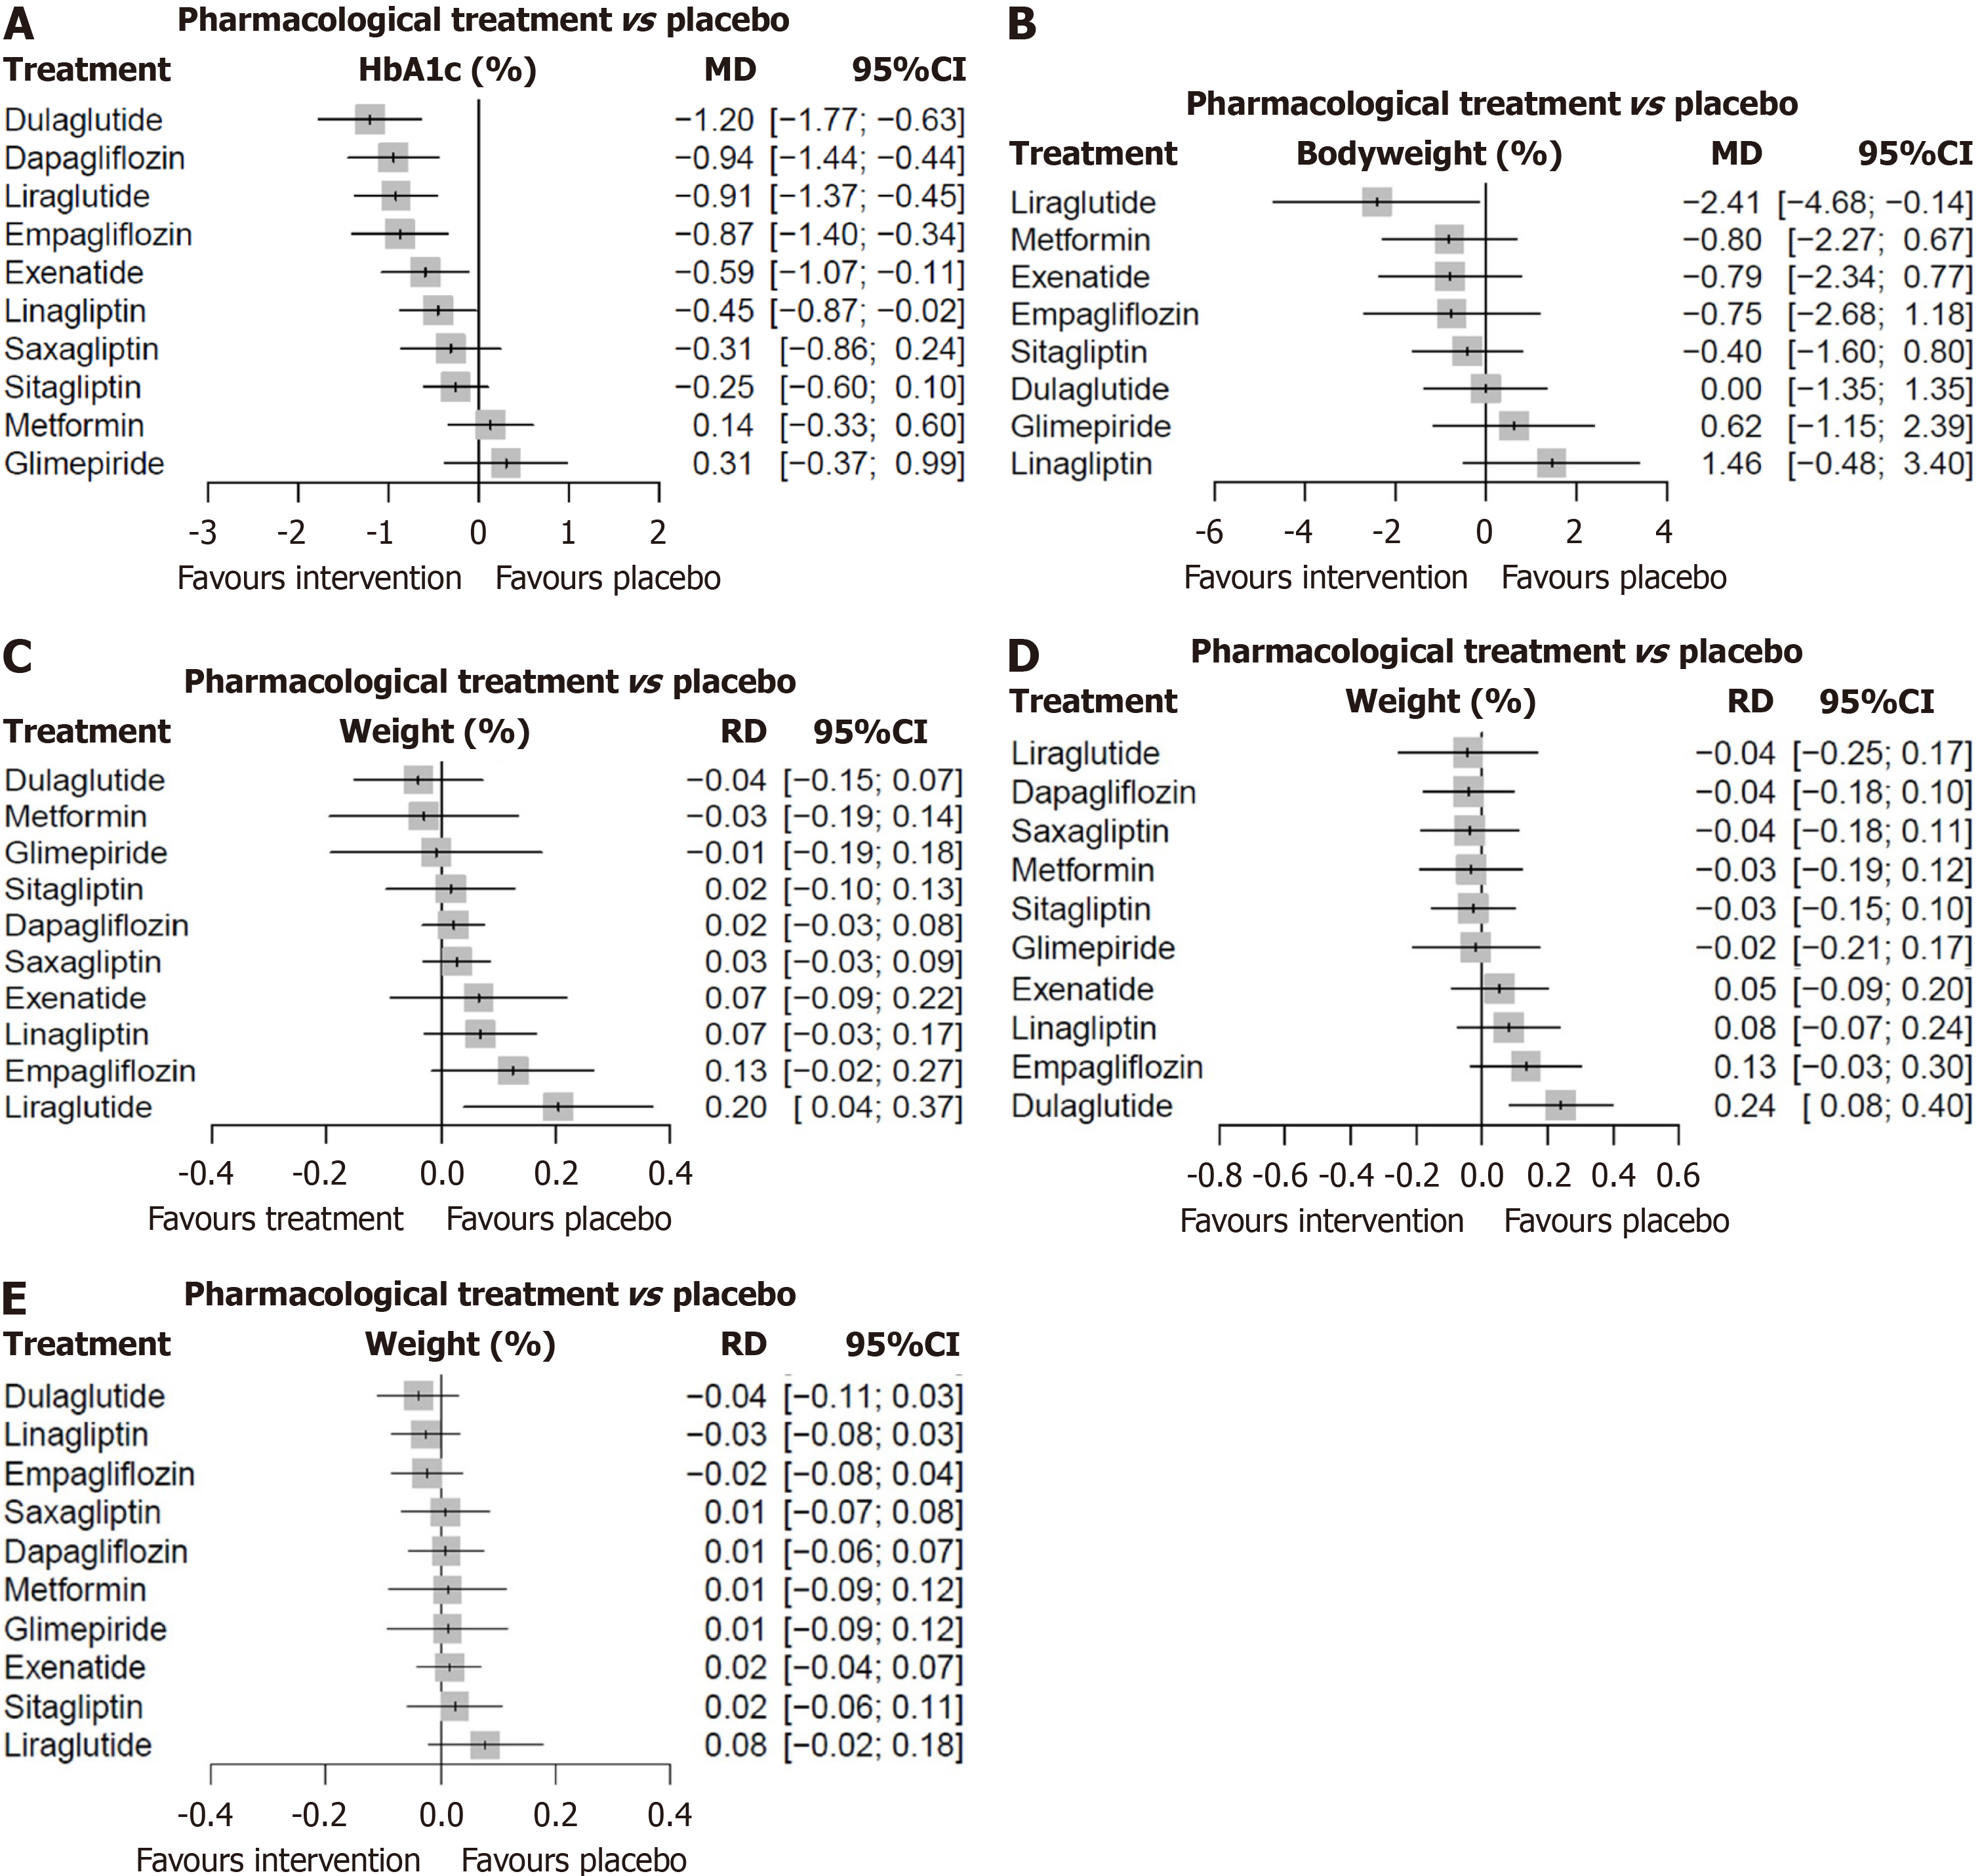
Figure 3 Network forest plots.
A: The network meta-analysis assessing changes in glycated hemoglobin for the drugs vs placebo; B: Body weight changes; C: Risk of level 1 hypoglycemia; drug vs comparator. Apart from liraglutide, other pharmacological agents used for treatment are not associated with statistically significant effects on level 1 hypoglycemia; D: Minor adverse events; E: Serious adverse events. MD: Mean difference; RD: Risk difference.
- Citation: Gagnon CA, Buchanan K, Deaver JM, Schmitt JA, Lahart IM, Shetty S, Ashraf AP, Pappachan JM. Pharmacological management of type 2 diabetes mellitus in children and adolescents: A systematic review and network meta-analysis. World J Diabetes 2025; 16(7): 106890
- URL: https://www.wjgnet.com/1948-9358/full/v16/i7/106890.htm
- DOI: https://dx.doi.org/10.4239/wjd.v16.i7.106890


