Copyright
©The Author(s) 2025.
World J Diabetes. Jul 15, 2025; 16(7): 106821
Published online Jul 15, 2025. doi: 10.4239/wjd.v16.i7.106821
Published online Jul 15, 2025. doi: 10.4239/wjd.v16.i7.106821
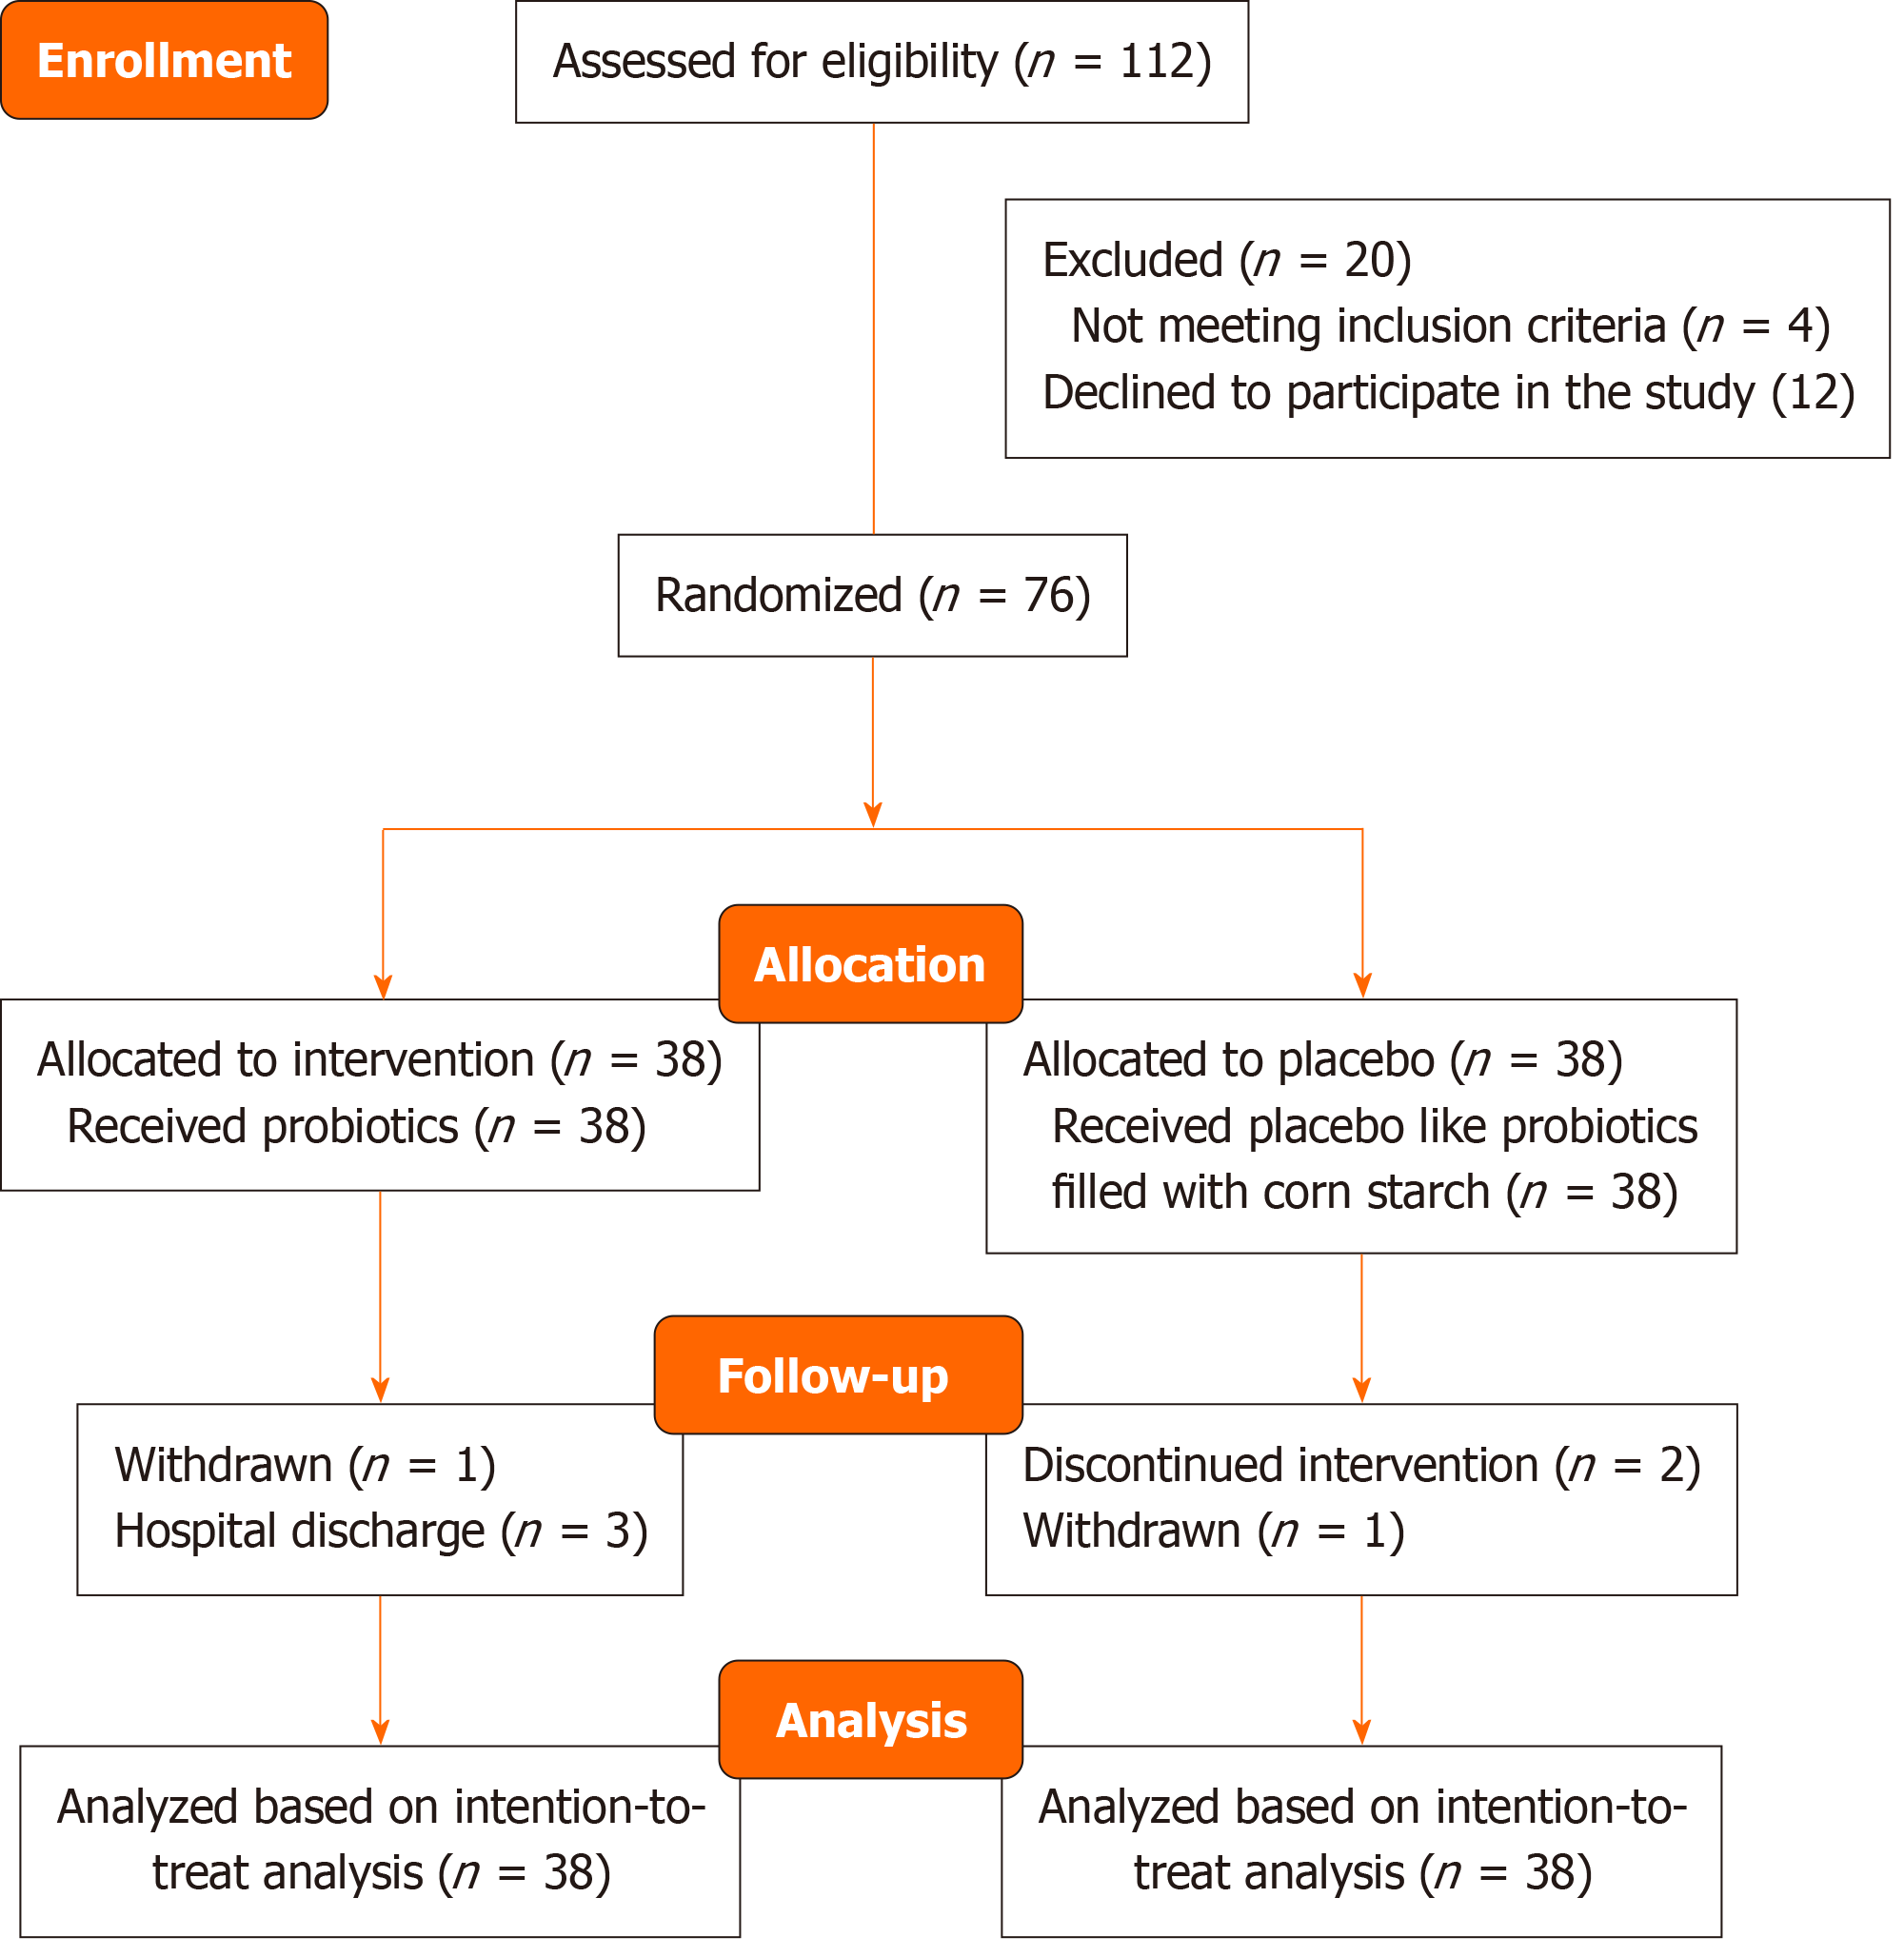
Figure 1 Study flow diagram.
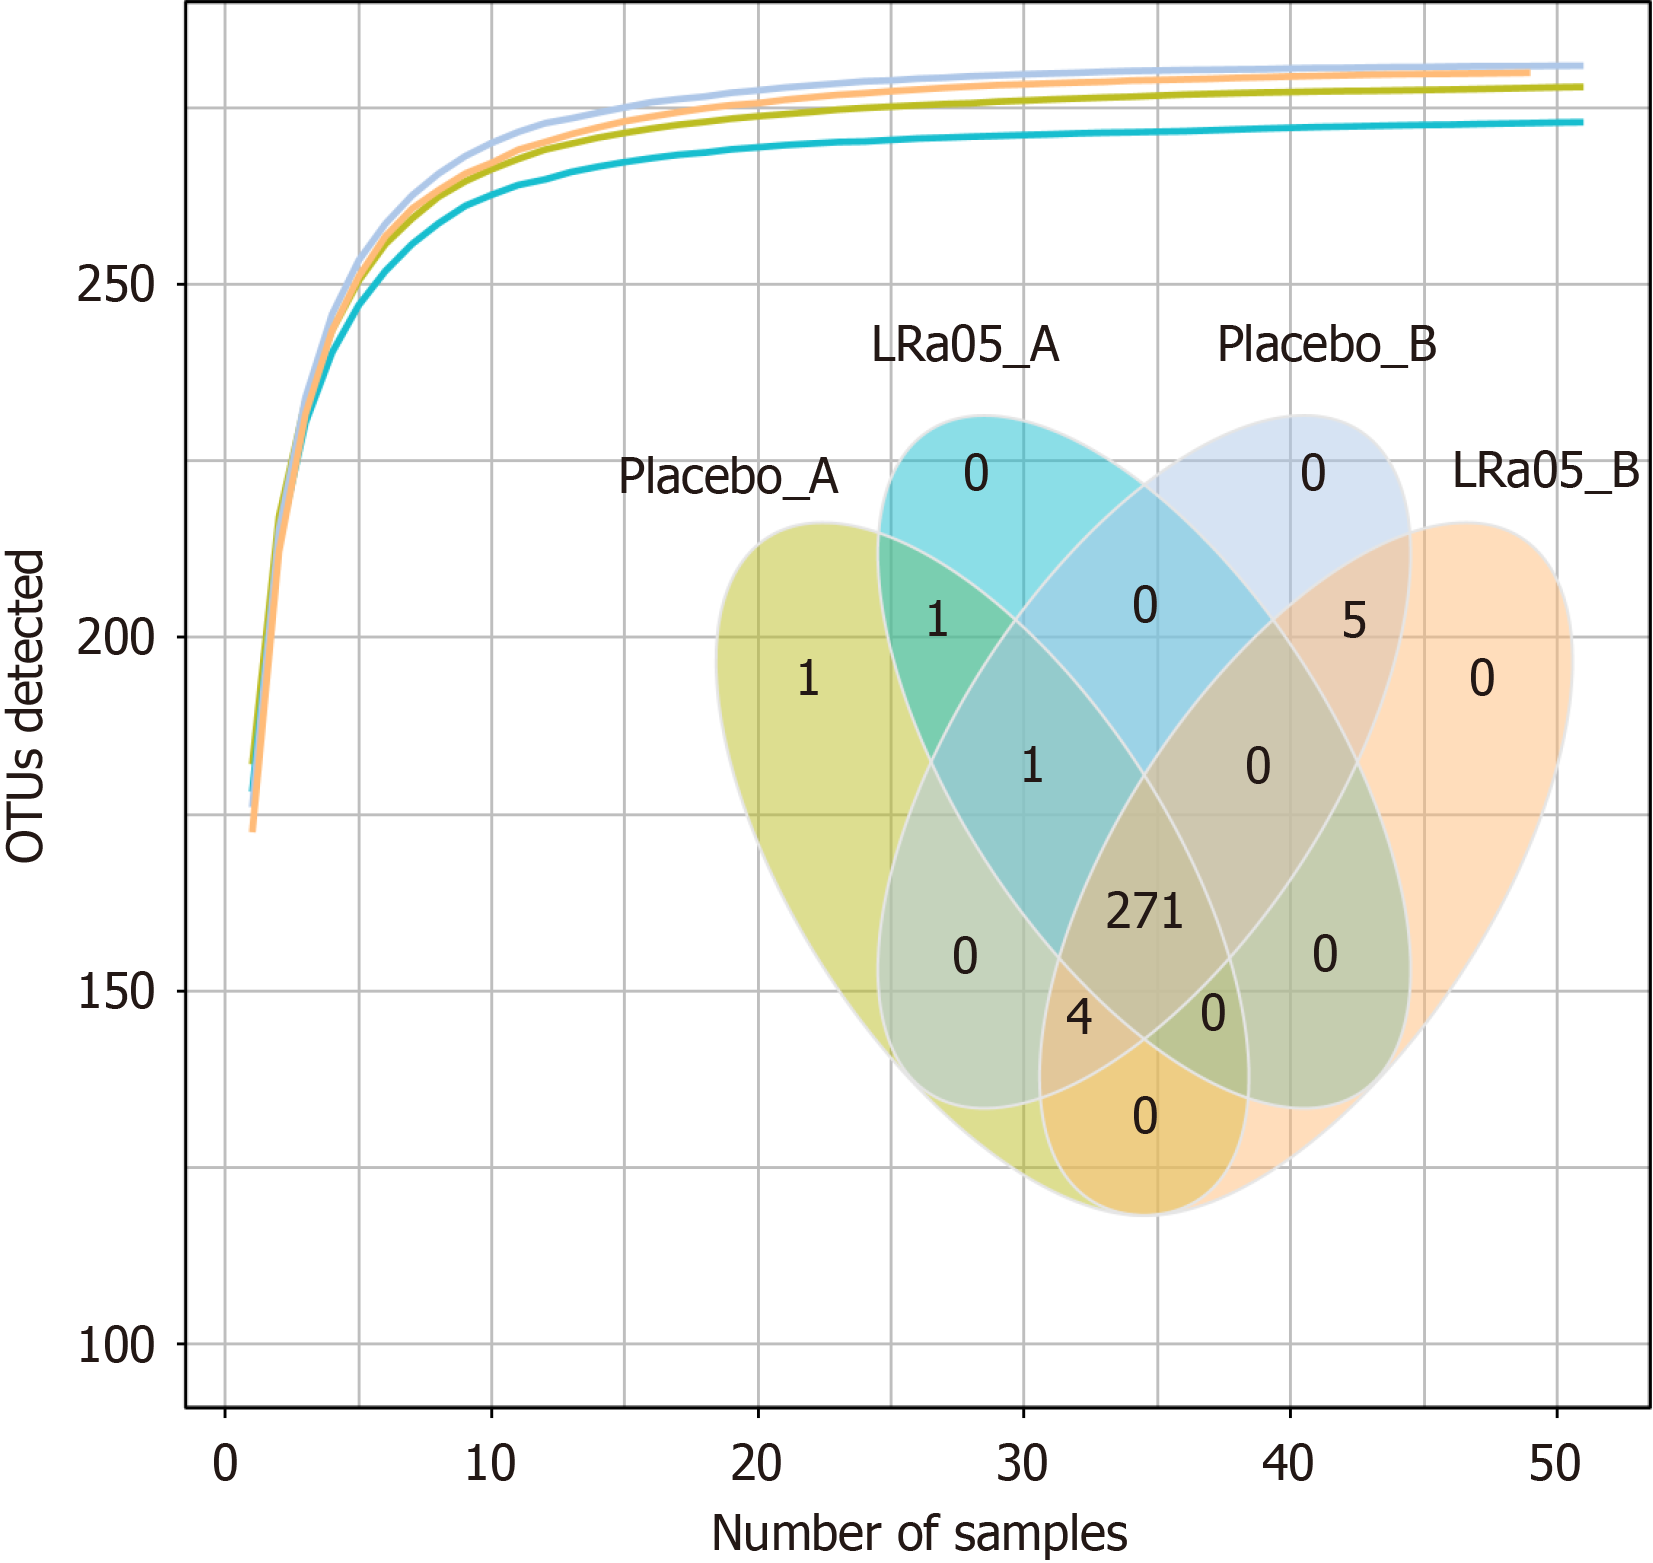
Figure 2 Bacterial species detected between the LRa05 and placebo groups.
OTU: Operational taxonomic units.
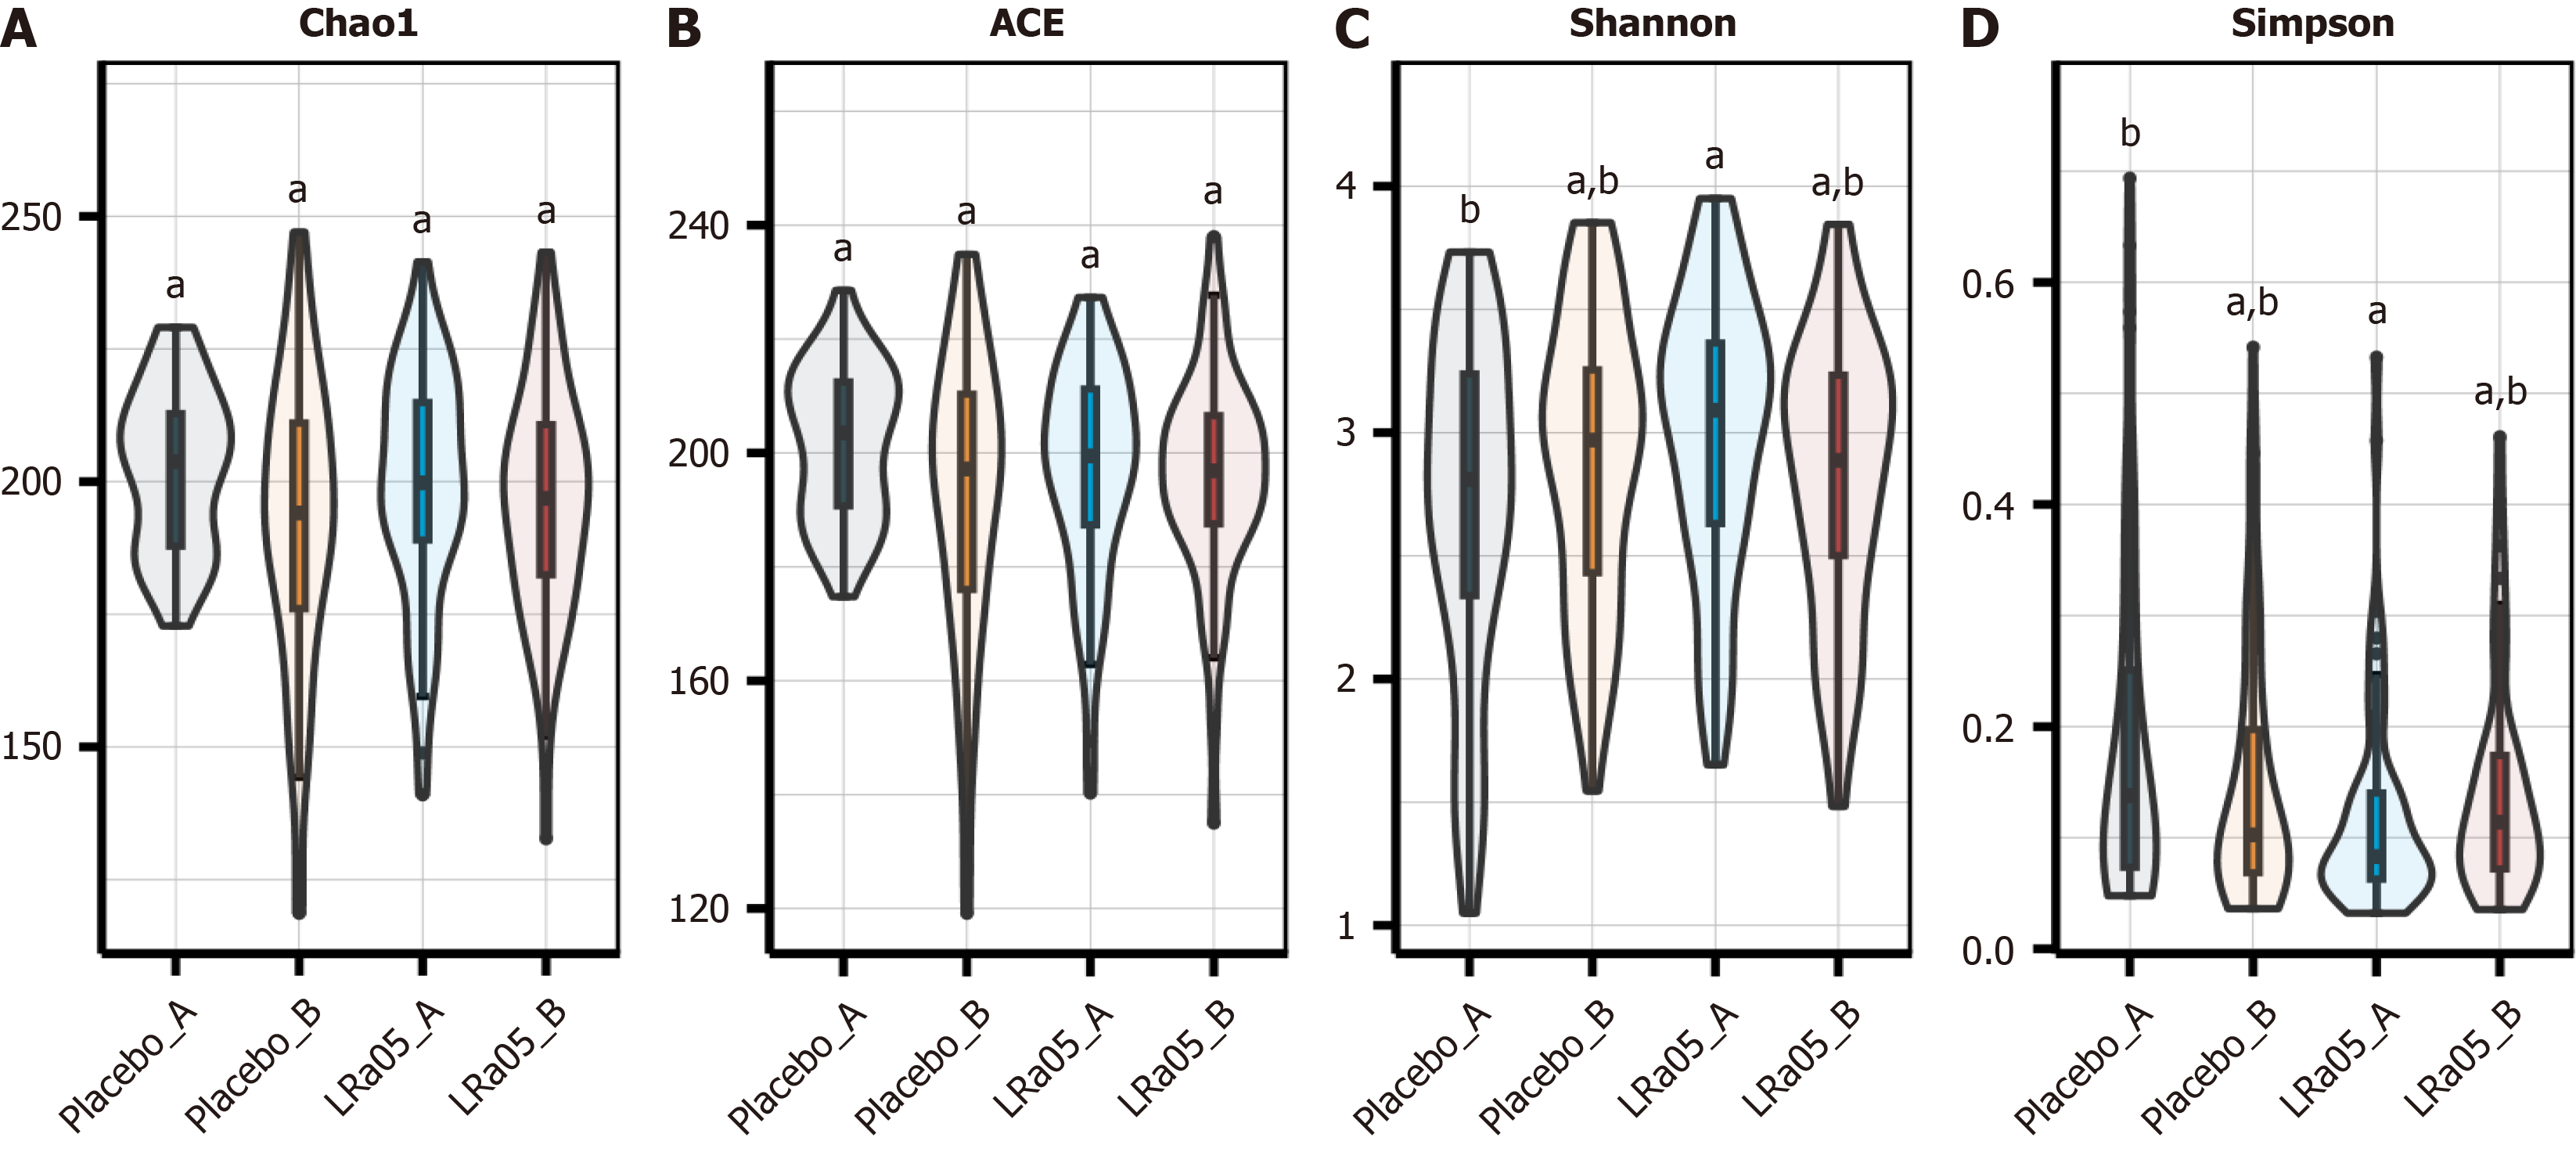
Figure 3 Alpha diversity indices (Chao1, Ace, Shannon, Simpson) for both groups preintervention and postintervention.
A: Chao1; B: Ace; C: Shannon; D: Simpson. For each panel, different lowercase letters above the bars indicate significant differences between groups (P < 0.05). Groups sharing at least one letter are not significantly different from each other. For example, groups labeled with the same letter (e.g., "a") do not differ significantly, while groups with different letters (between groups labeled with "a" and groups labeled with "b") indicate significant differences. "ab" indicates no significant difference from groups either "a" or "b".
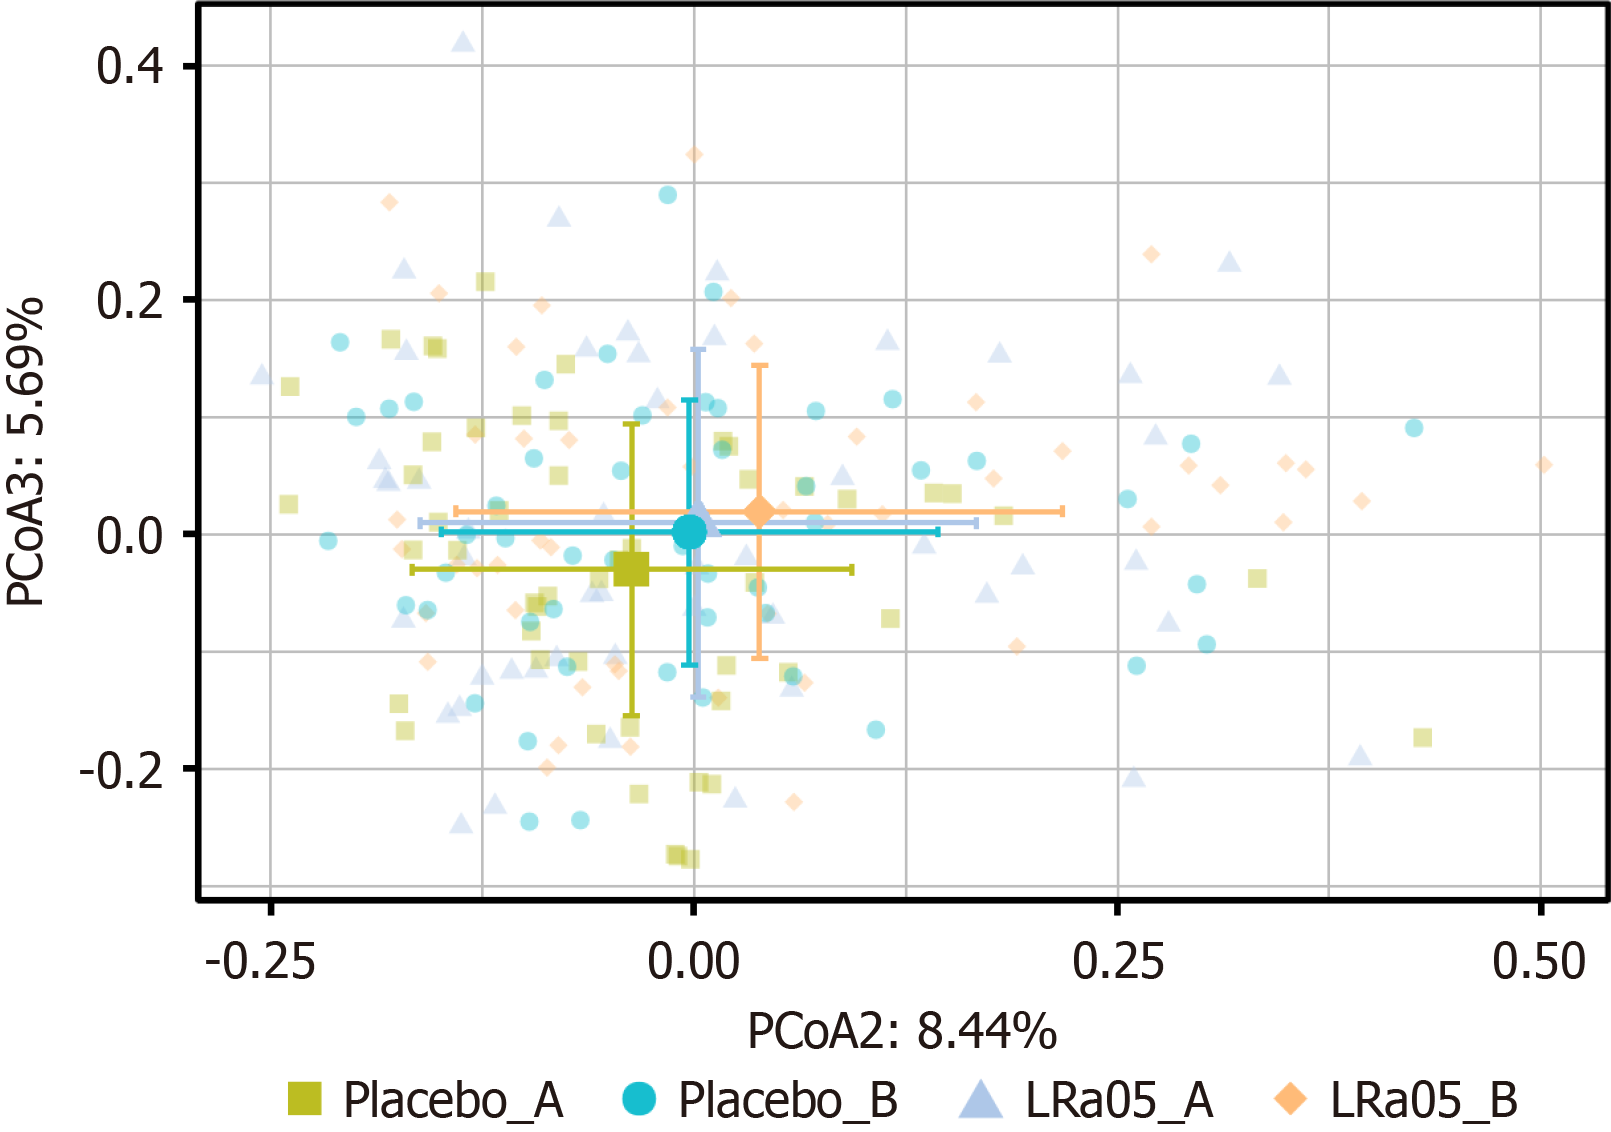
Figure 4 Principal coordinate analysis plot illustrating beta diversity of gut microbiota composition.
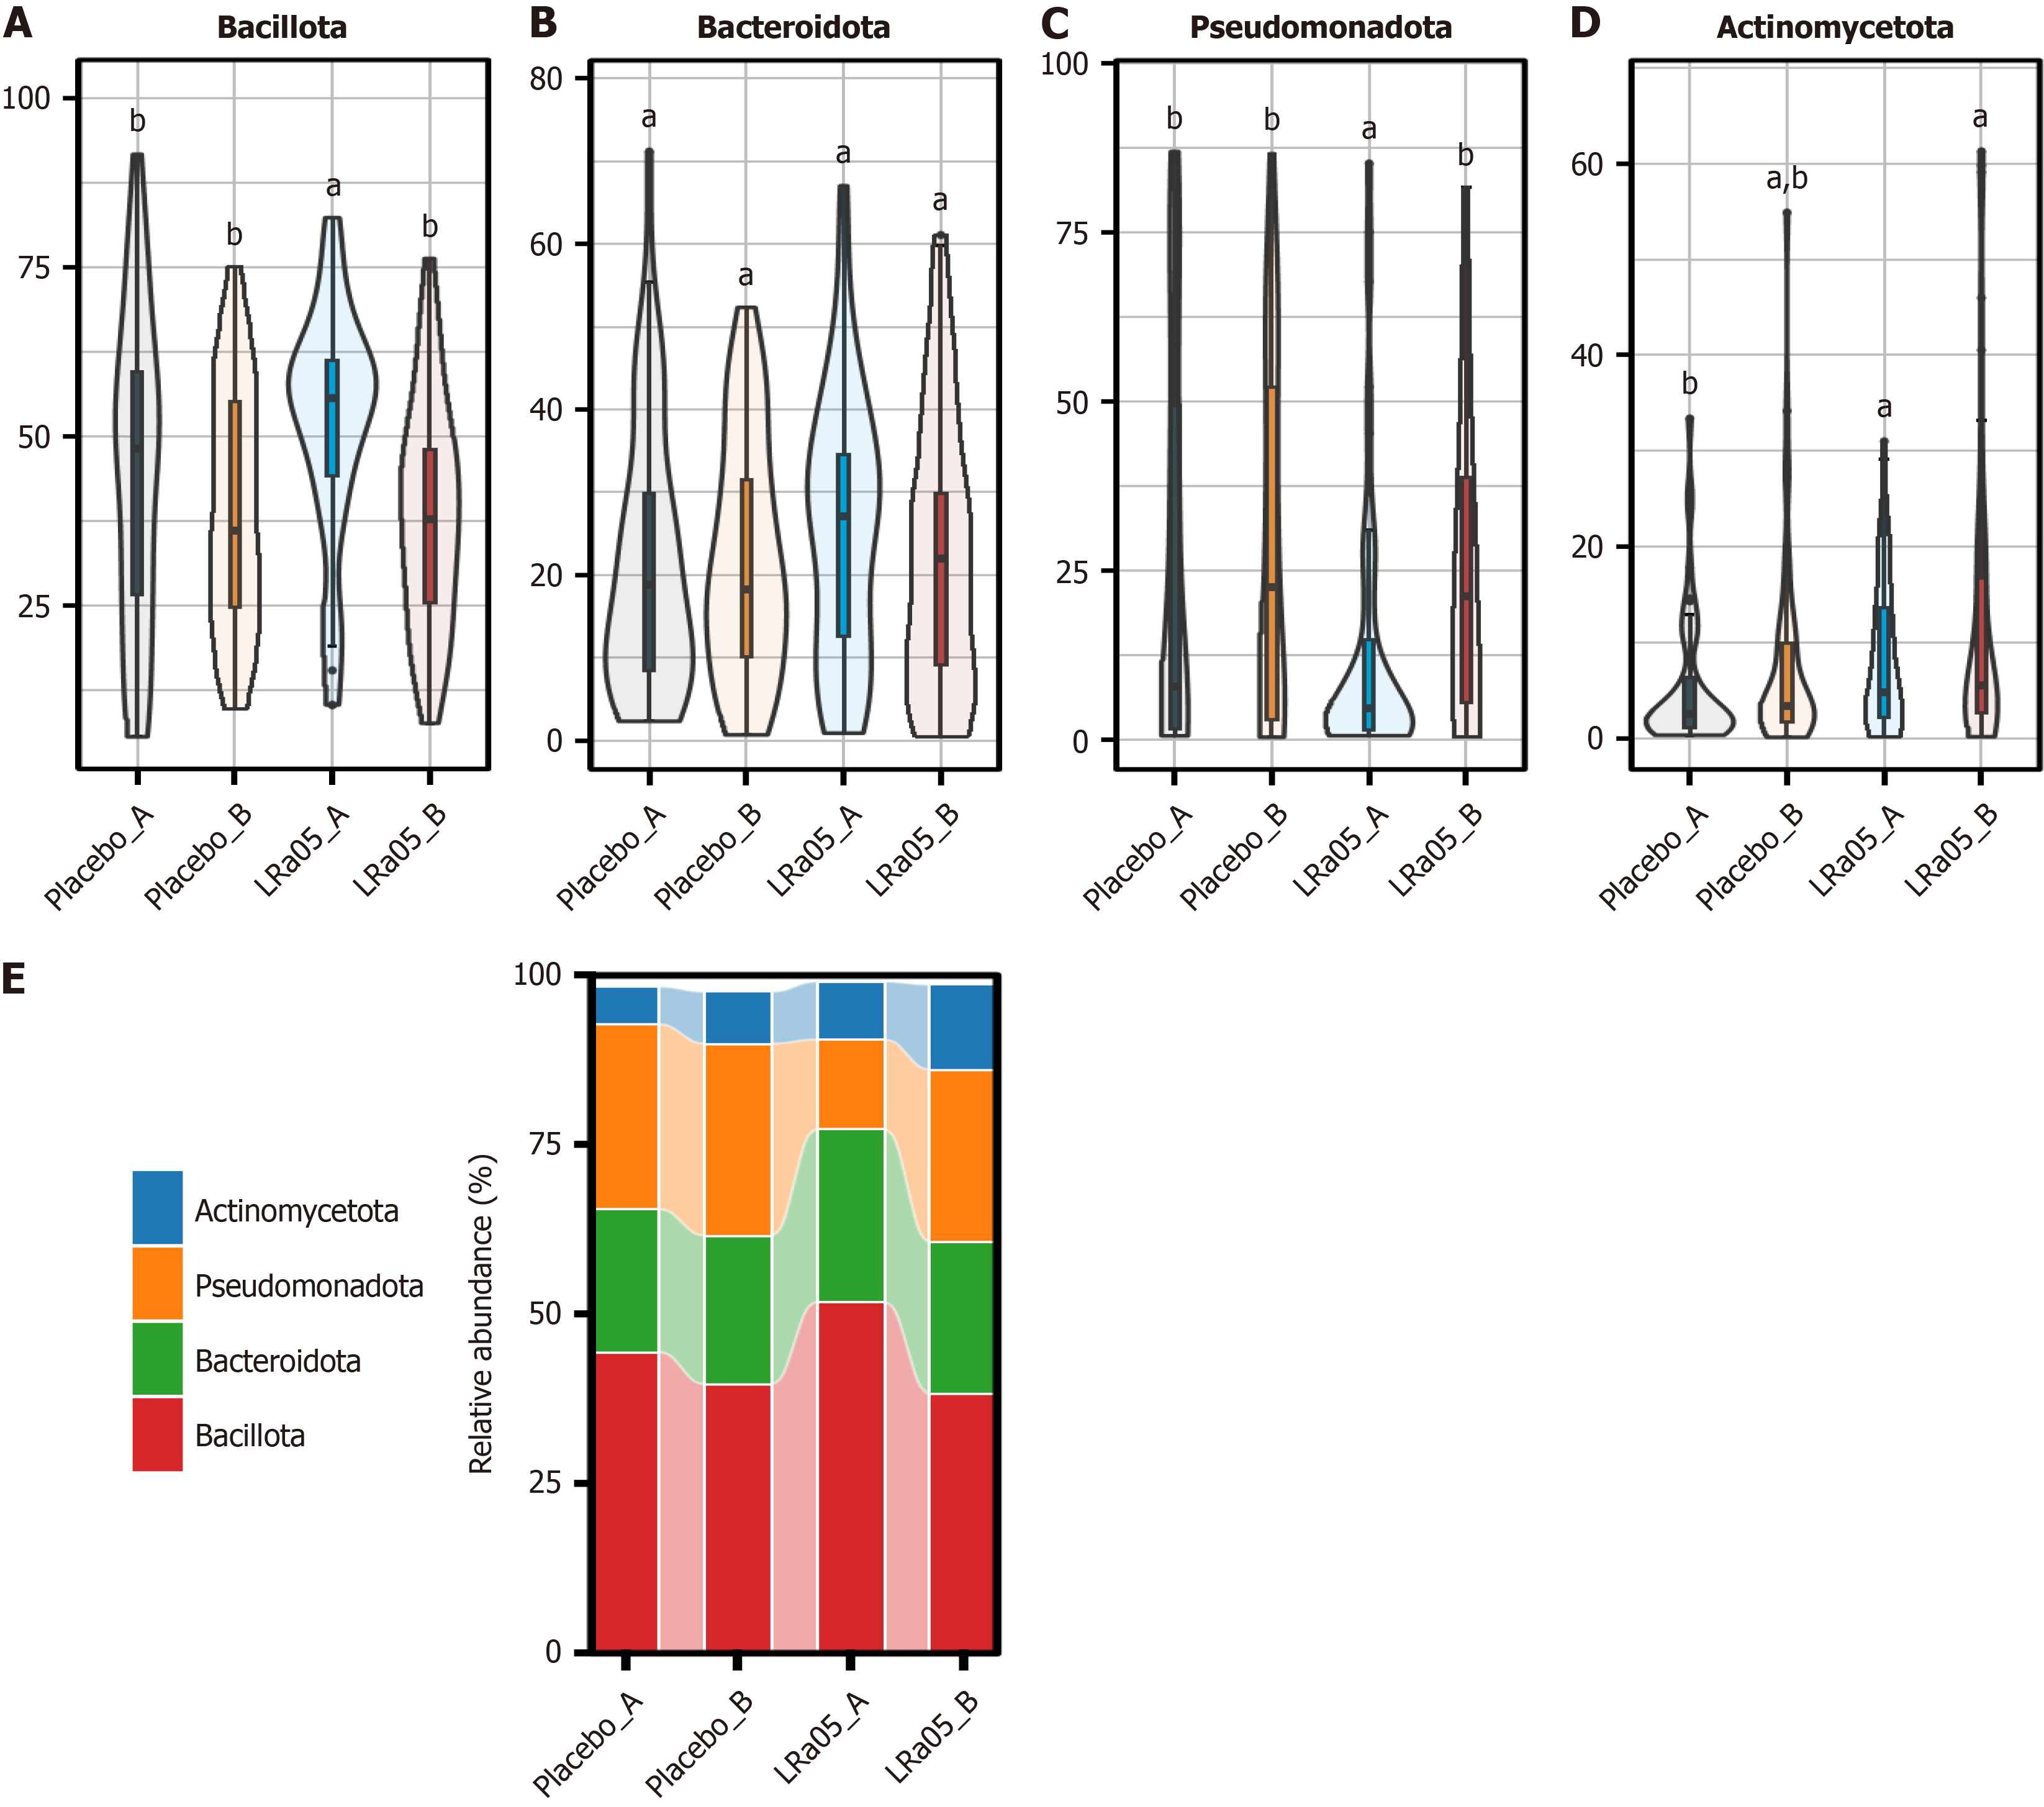
A: Relative abundance of Bacillota across treatment groups; B: Relative abundance of Bacteroidota across treatment groups; C: Relative abundance of Pseudomonadota across treatment groups; D: Relative abundance of Actinomycetota across treatment groups; E: Overall relative abundance of bacterial phyla across treatment groups. For each panel, different lowercase letters above the bars indicate significant differences between groups (P < 0.05). Groups sharing at least one letter are not significantly different from each other. For example, groups labeled with the same letter (e.g., "a") do not differ significantly, while groups with different letters (between groups labeled with "a" and groups labeled with "b") indicate significant differences. "ab" indicates no significant difference from groups either "a" or "b".
Figure 5 Changes in gut microbiota composition and relative abundance of dominant phyla before and after the intervention.
PCoA: Principal coordinate analysis.
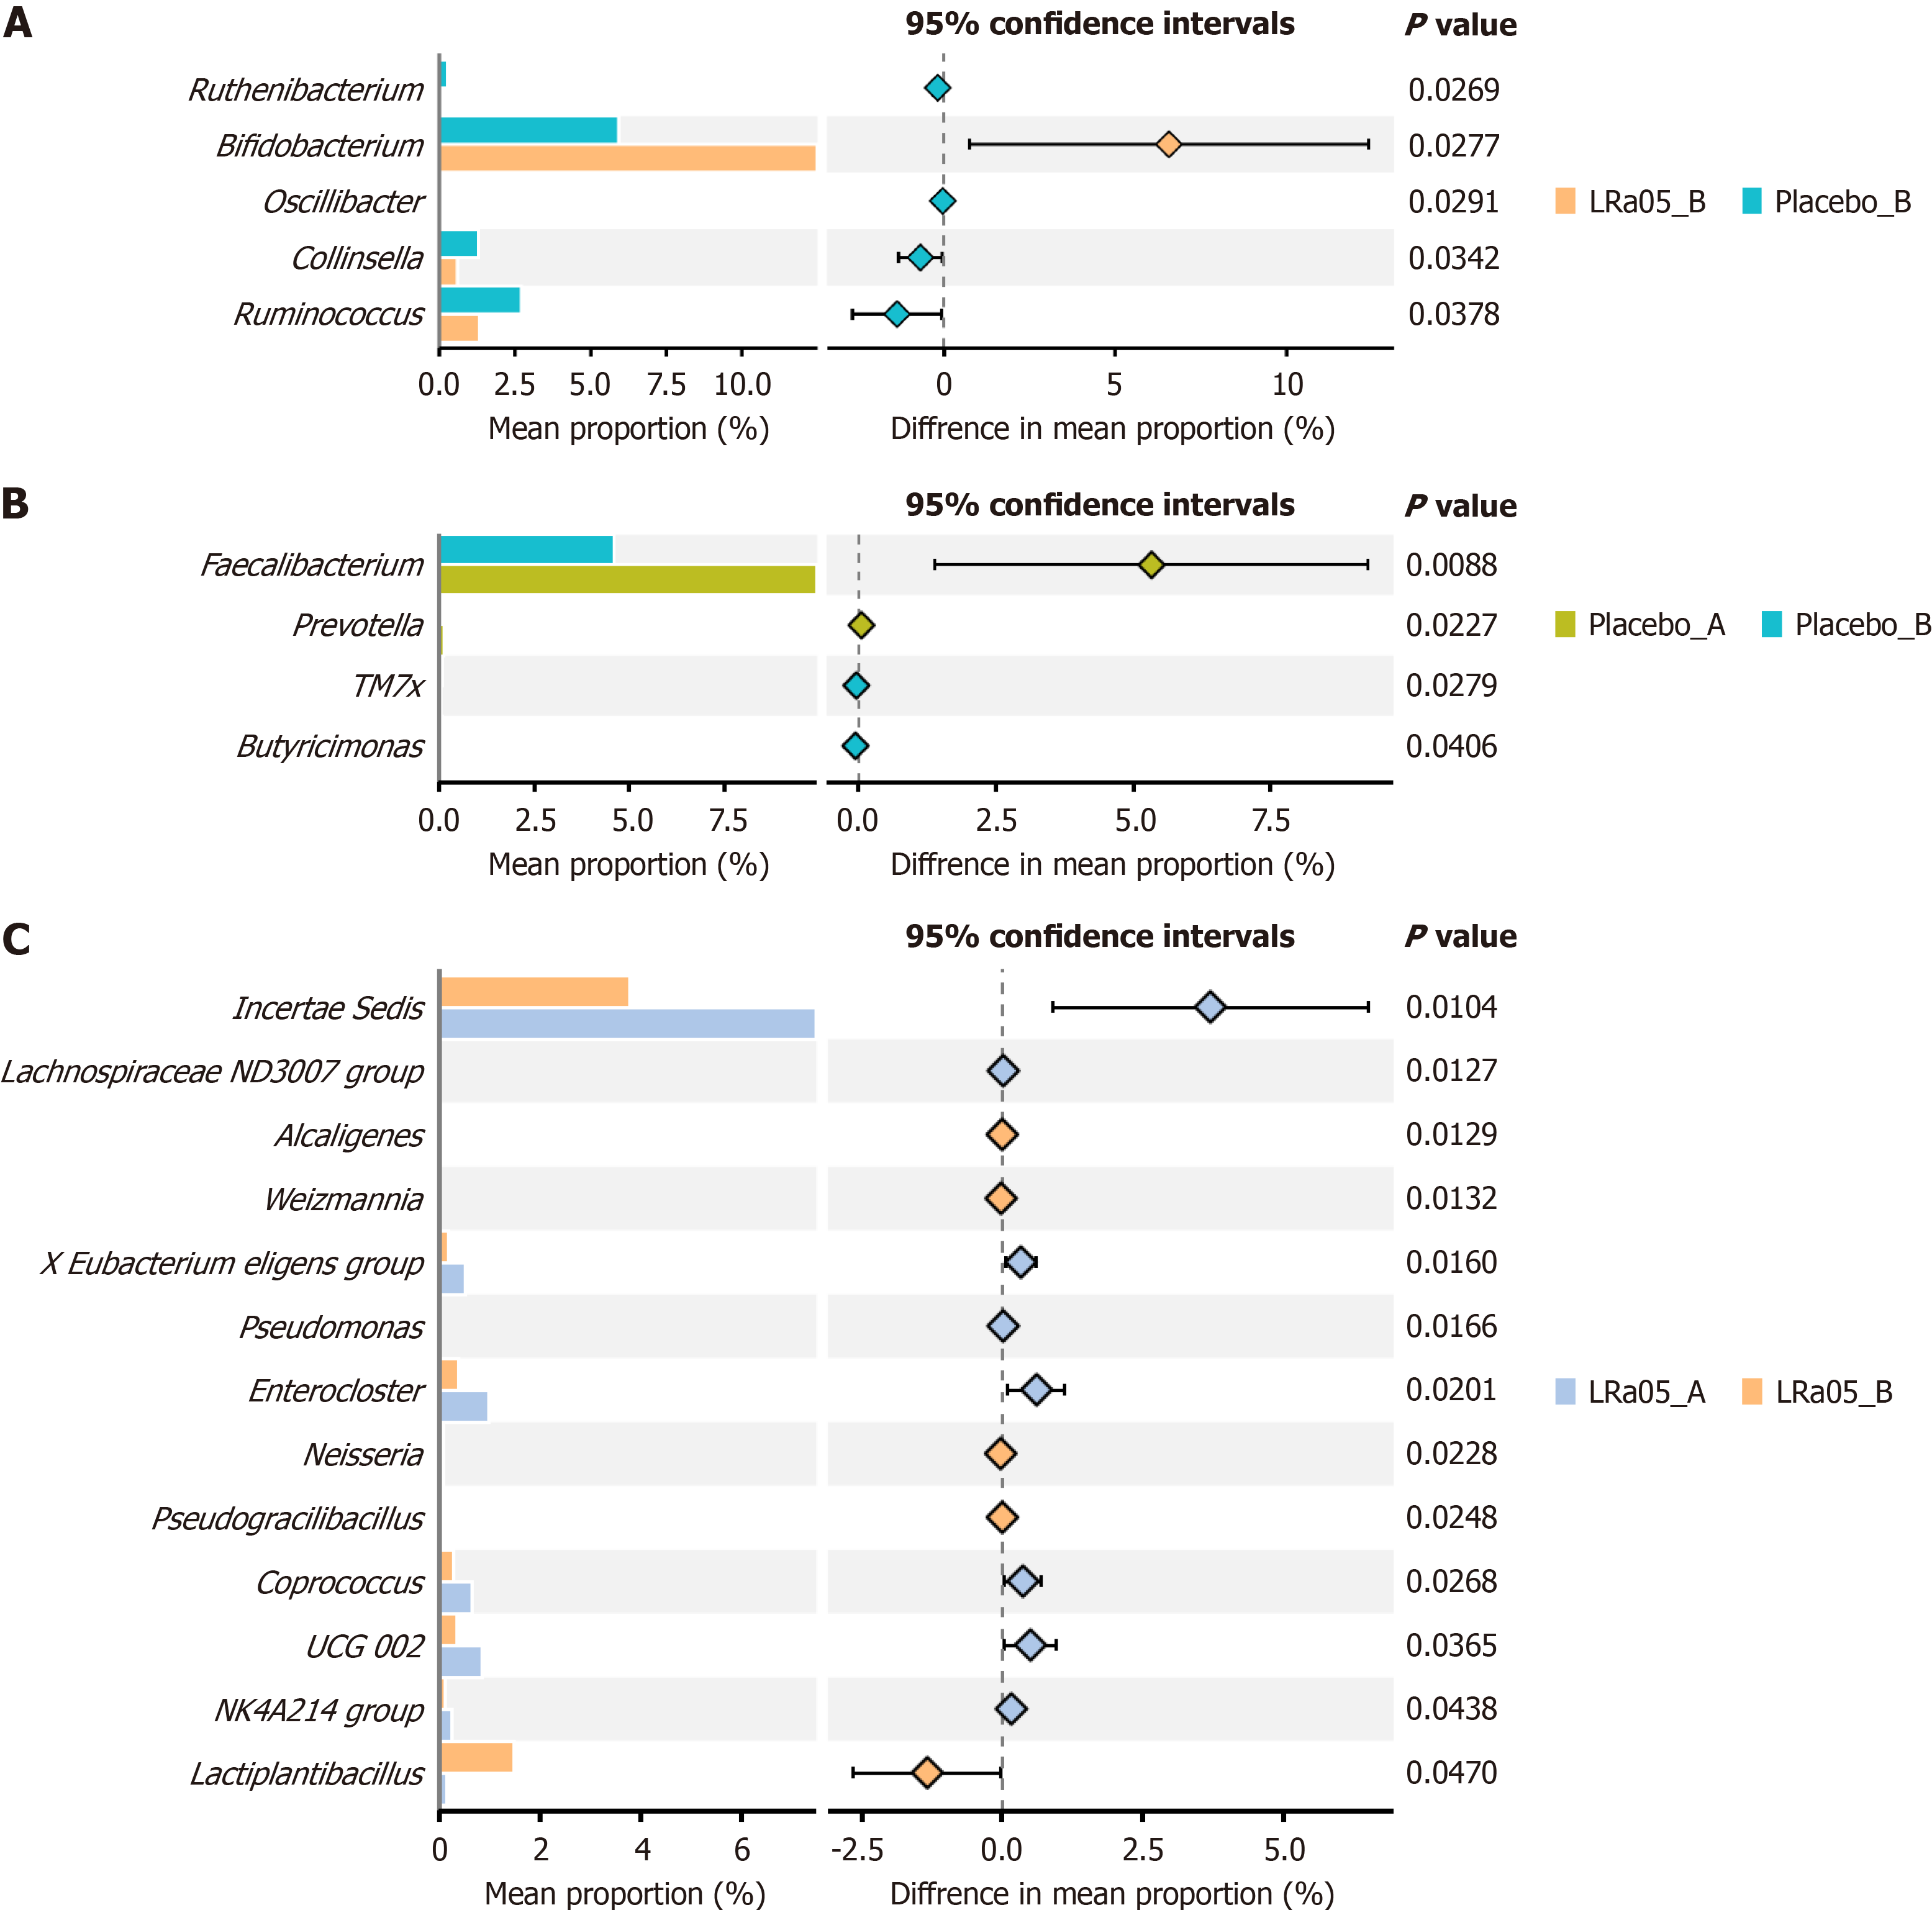
Figure 6 Changes in the abundance of specific genera in the LRa05 and placebo groups.
A: Relative abundance of Ruthonibacterium across Placebo_B and LRa05_B groups; B: Relative abundance of Faecalibacterium, Prevotella, and Butyricimomas across Placebo_A and Placebo_B groups; C: Relative abundance of various bacterial taxa across LRa05_A and LRa05_B groups.
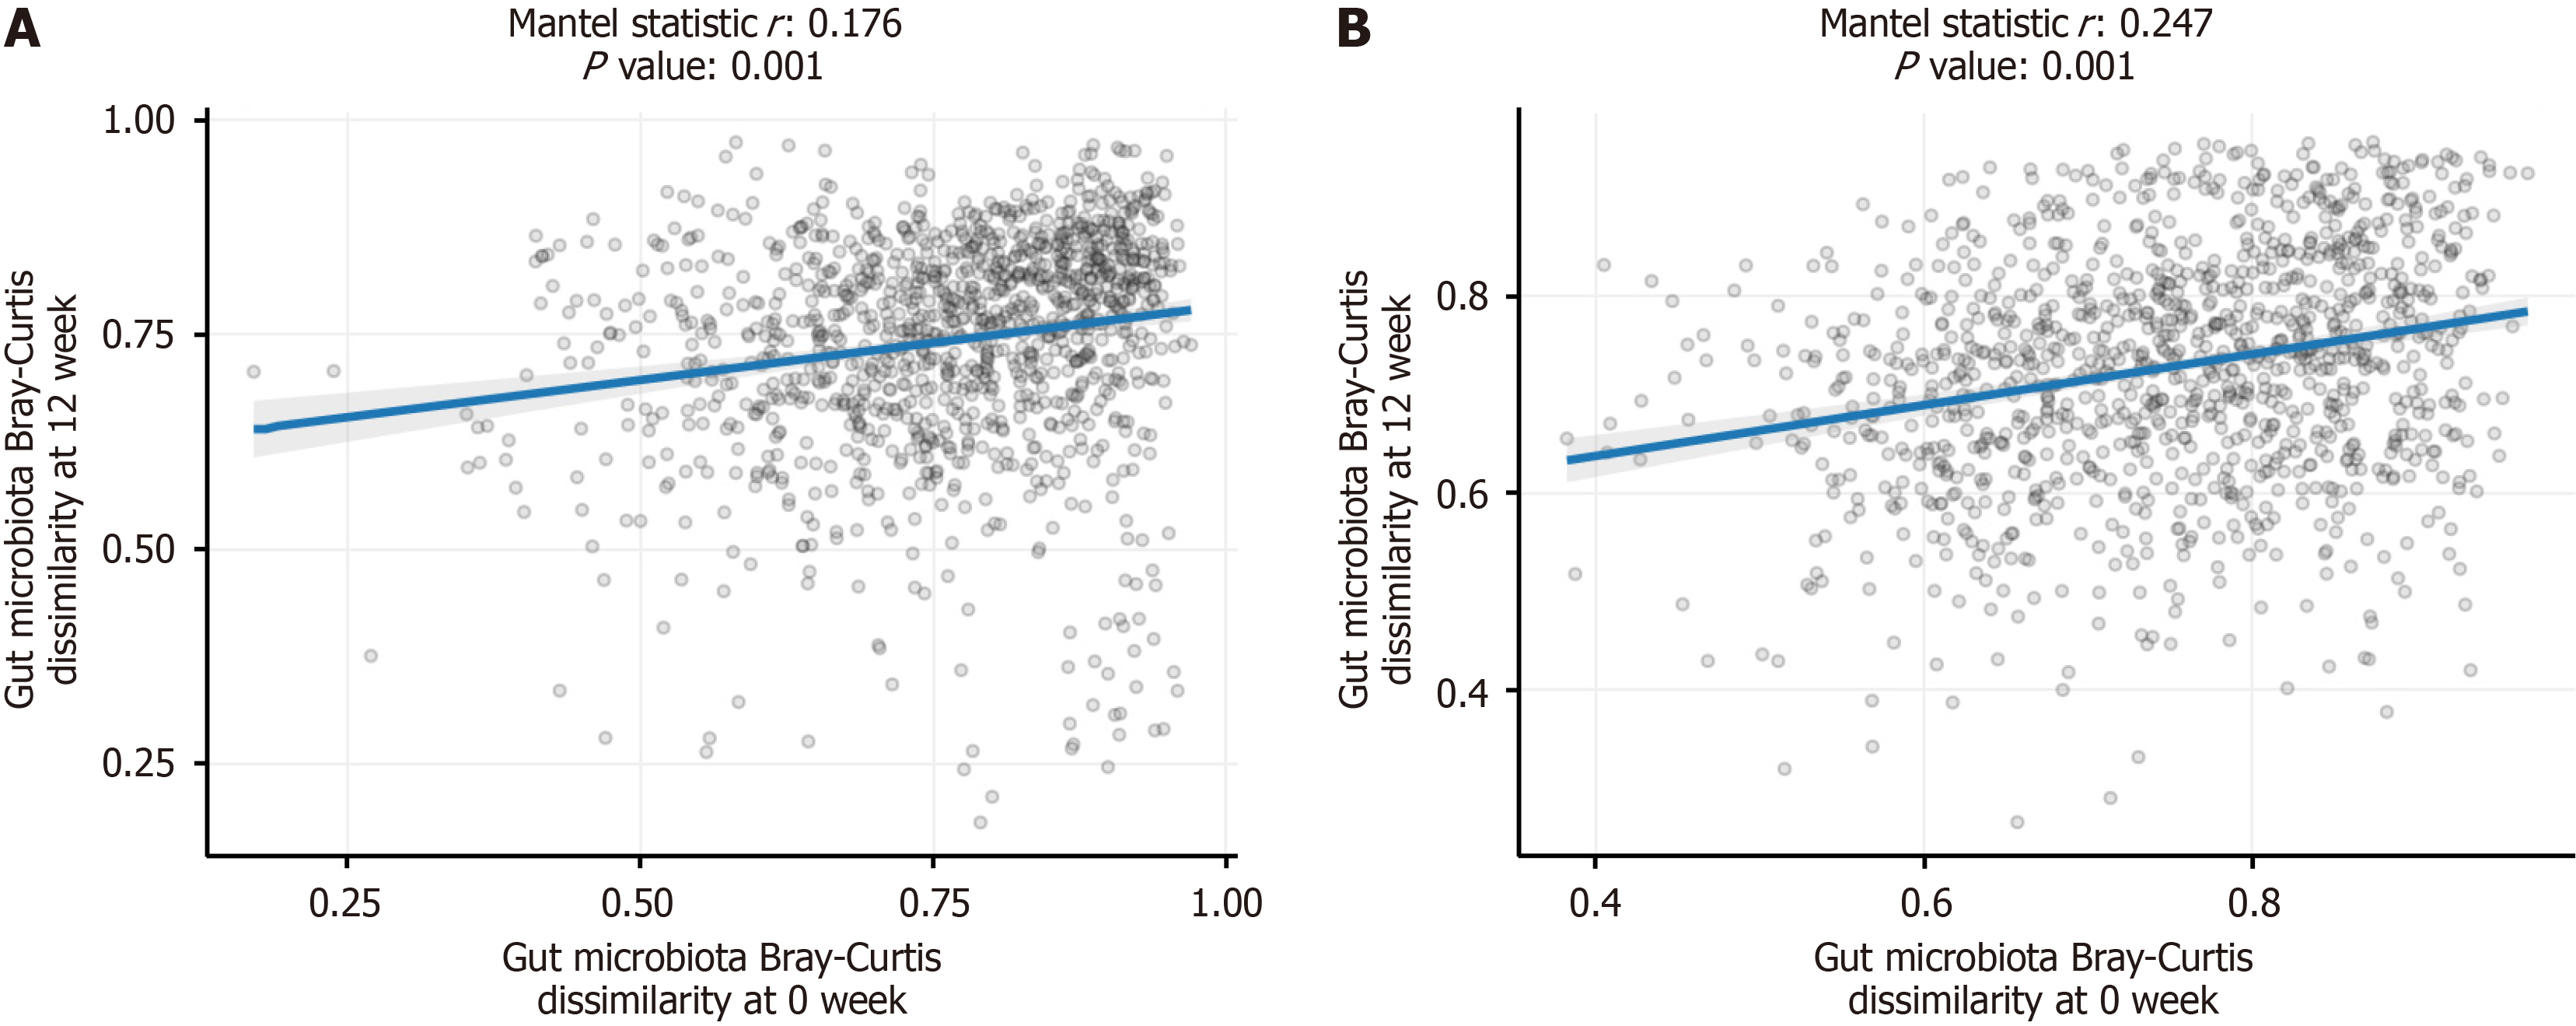
Figure 7 Correlation coefficients for bacterial abundances before and after treatment in both groups.
A: Placebo group gut microbiota Bray-Curtis dissimilarity, Mantel r = 0.176, P = 0.001; B: LRa05 group gut microbiota Bray-Curtis dissimilarity, Mantel r = 0.247, P = 0.001.
- Citation: Geng L, Sun TT, Xia WB, Qin Y, Huo D, Qu GJ. Lactobacillus rhamnosus LRa05 on glycemic control and gut microbiota in patients with type 2 diabetes. World J Diabetes 2025; 16(7): 106821
- URL: https://www.wjgnet.com/1948-9358/full/v16/i7/106821.htm
- DOI: https://dx.doi.org/10.4239/wjd.v16.i7.106821


