Copyright
©The Author(s) 2025.
World J Diabetes. Jul 15, 2025; 16(7): 104424
Published online Jul 15, 2025. doi: 10.4239/wjd.v16.i7.104424
Published online Jul 15, 2025. doi: 10.4239/wjd.v16.i7.104424
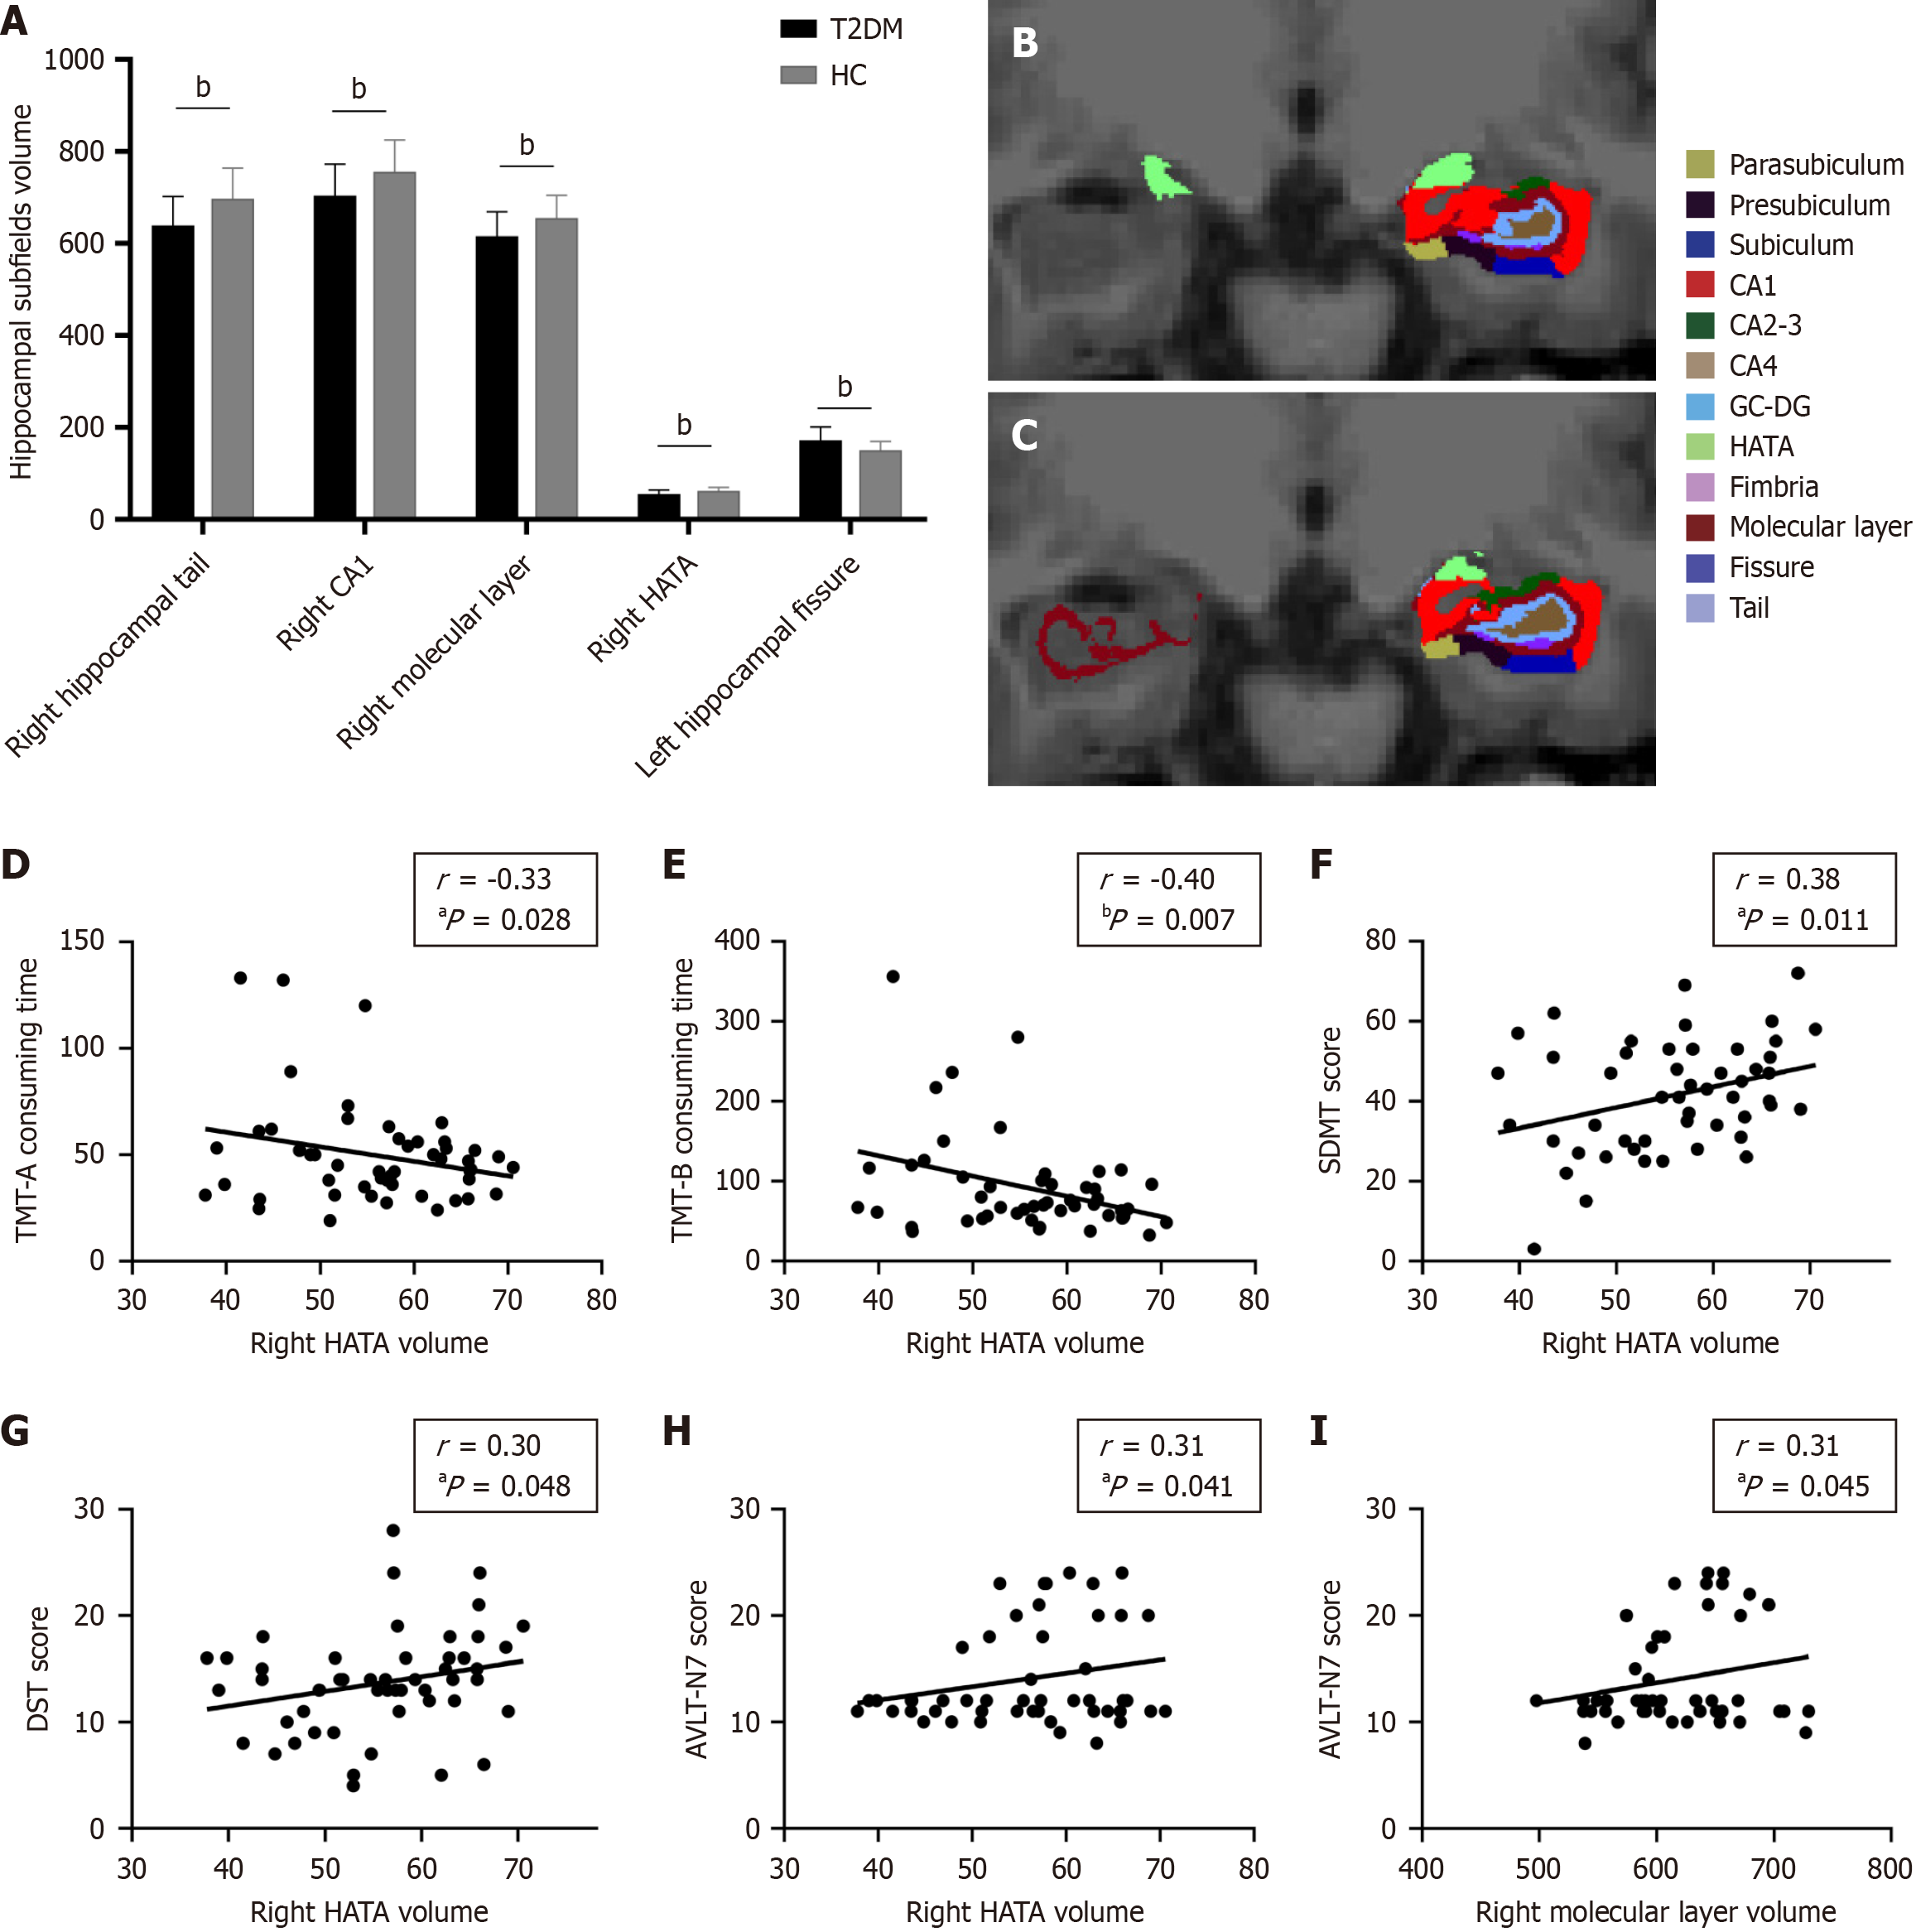
Figure 1 Hippocampal subregion volumes with significant group differences and their correlations with cognitive scales.
A: Significant differences in hippocampal subregion volumes between type 2 diabetes mellitus (T2DM) and healthy control groups; B and C: Hippocampal subregions in a coronal view of a patient with T2DM; D-H: Partial correlation coefficient of cognitive function with the right Hippocampus amygdala transition area volume in patients with T2DM; I: Partial correlation coefficient of cognitive function with the right molecular layer volume in patients with T2DM. aP < 0.05, bP < 0.01. T2DM: Type 2 diabetes mellitus; HC: Healthy control; TMT: Trail Making Test; DST: Digital Span Test; SDMT: Symbol Digit Modalities Test; AVLT: Auditory Verbal Learning Test; CA: Cornu ammonis; GC: Granular cell; DG: Dentate gyrus; HATA: Hippocampus amygdala transition area.
- Citation: Wu SX, Liang XL, Zhu QQ, Wang W, Jiang L, Chen HH, Tian S, Qi M. Altered hippocampal subfield volumes are associated with memory and executive function in patients with type 2 diabetes mellitus. World J Diabetes 2025; 16(7): 104424
- URL: https://www.wjgnet.com/1948-9358/full/v16/i7/104424.htm
- DOI: https://dx.doi.org/10.4239/wjd.v16.i7.104424


