Copyright
©The Author(s) 2025.
World J Diabetes. Jun 15, 2025; 16(6): 105069
Published online Jun 15, 2025. doi: 10.4239/wjd.v16.i6.105069
Published online Jun 15, 2025. doi: 10.4239/wjd.v16.i6.105069
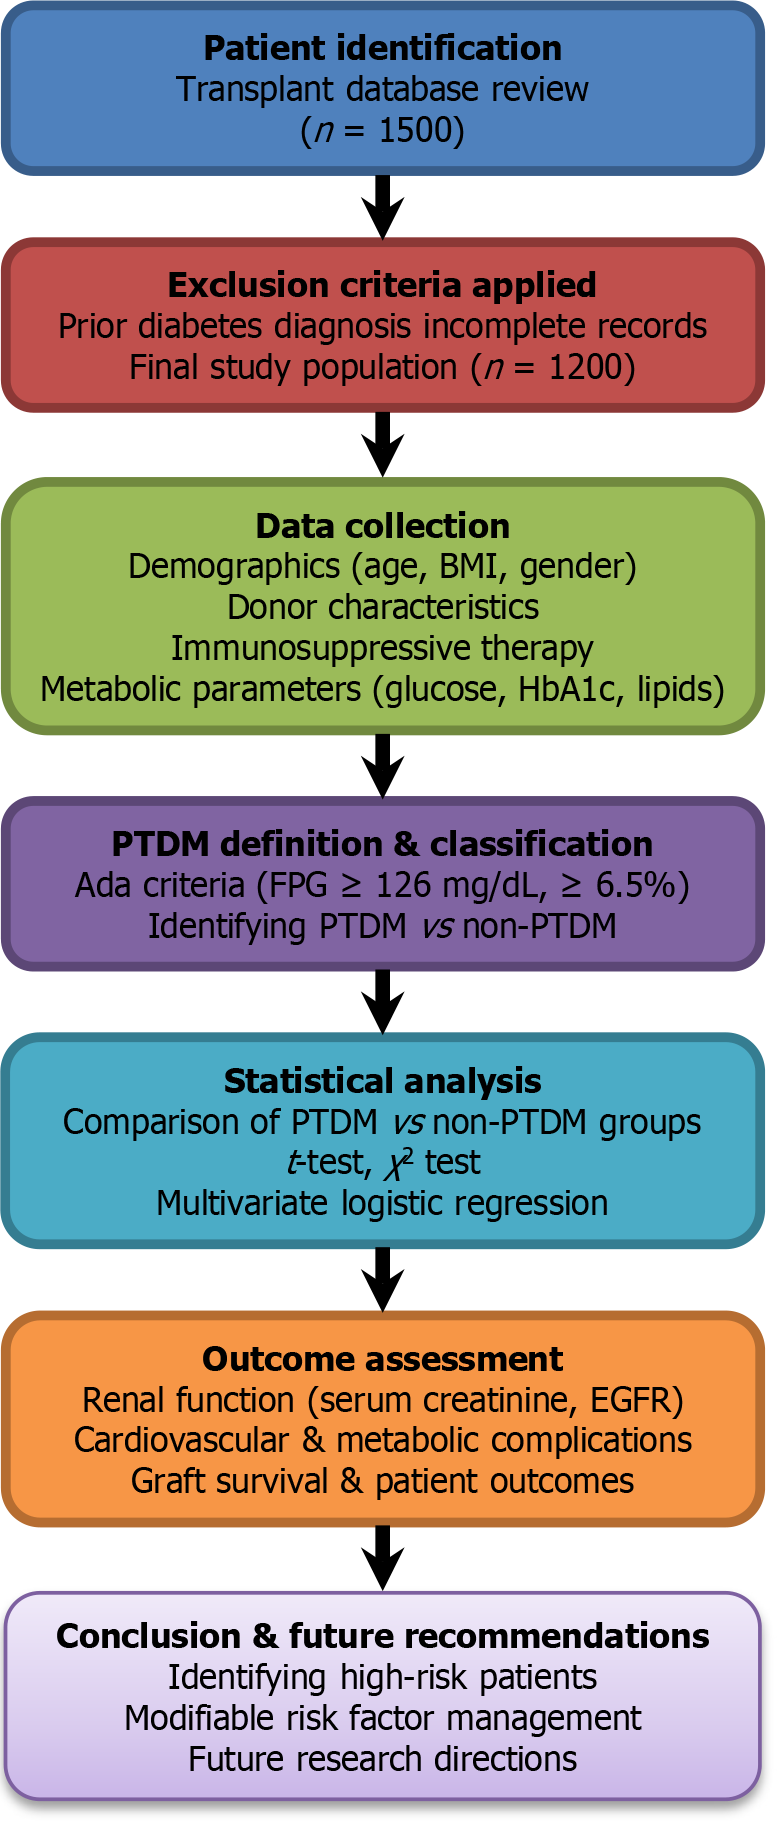
Figure 1 This diagram provides a clearer overview of how data were processed and analyzed, ensuring reproducibility and transparency in study design.
BMI: Body mass index; FPG: Fasting plasma glucose; PTDM: Post-transplant diabetes mellitus; EGFR: Estimated glomerular filtration rate.
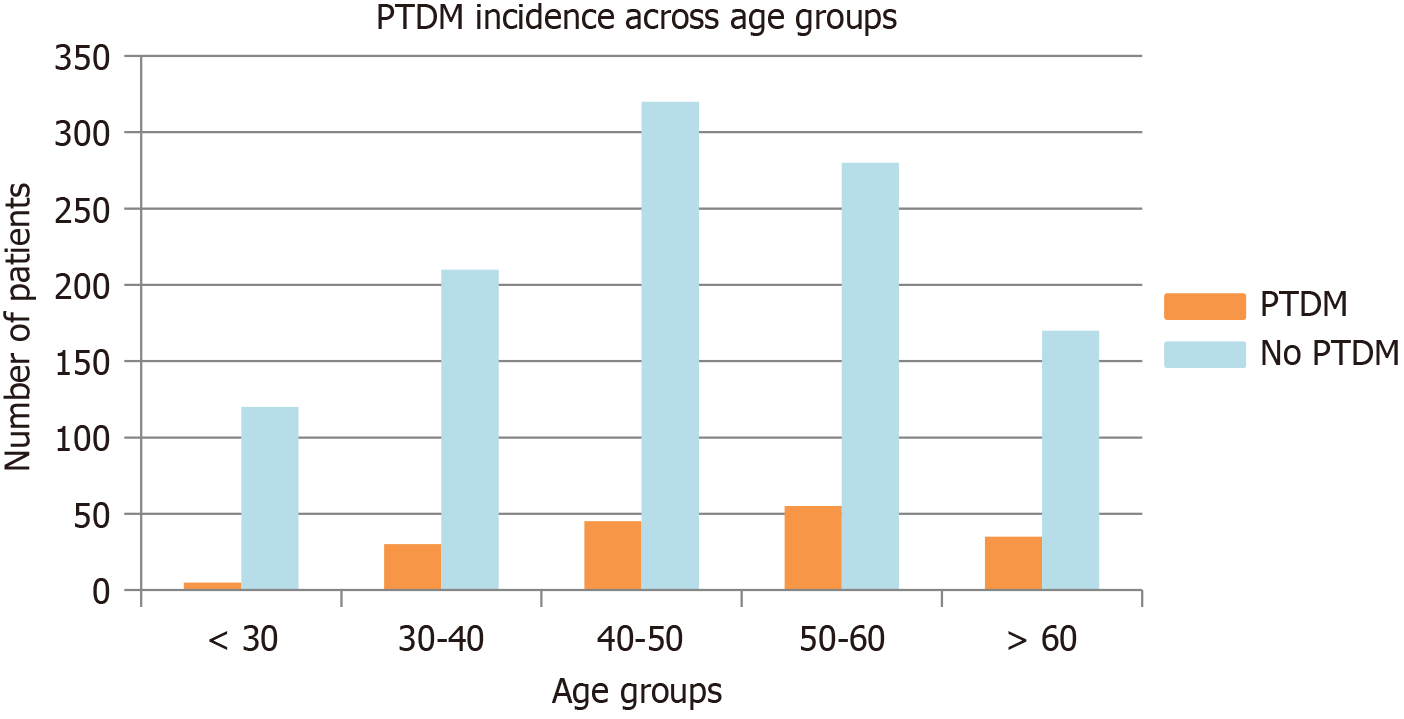
Figure 2 Post-transplant diabetes mellitus incidence across age groups: This bar chart compares the number of patients with and without post-transplant diabetes mellitus across different age groups.
It highlights the higher prevalence of post-transplant diabetes mellitus in older age groups. PTDM: Post-transplant diabetes mellitus.
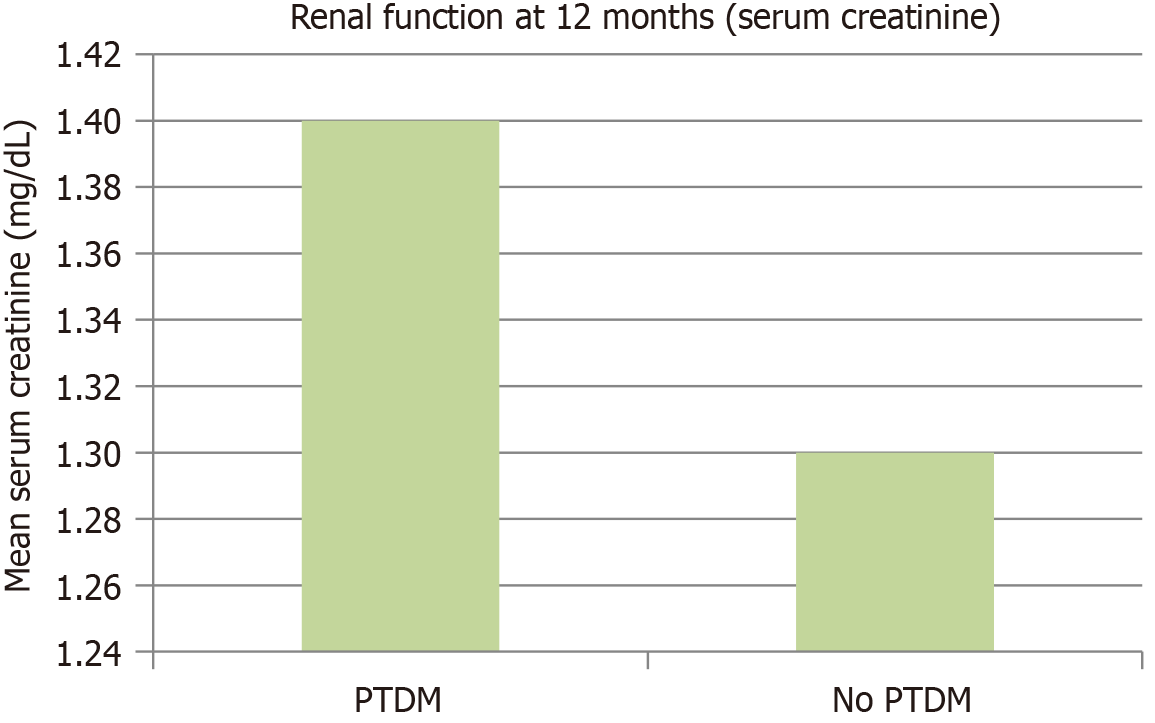
Figure 3 Renal function at 12 months: This bar chart with error bars shows the mean serum creatinine levels at 12 months post-transplant for post-transplant diabetes mellitus and non-post-transplant diabetes mellitus groups, indicating comparable renal function between the groups.
PTDM: Post-transplant diabetes mellitus.
- Citation: Huseynov A, Kuşlu Çicek SN. Trends and predictors of diabetes mellitus after living kidney transplantation: A retrospective study. World J Diabetes 2025; 16(6): 105069
- URL: https://www.wjgnet.com/1948-9358/full/v16/i6/105069.htm
- DOI: https://dx.doi.org/10.4239/wjd.v16.i6.105069


