Copyright
©The Author(s) 2025.
World J Diabetes. May 15, 2025; 16(5): 99576
Published online May 15, 2025. doi: 10.4239/wjd.v16.i5.99576
Published online May 15, 2025. doi: 10.4239/wjd.v16.i5.99576
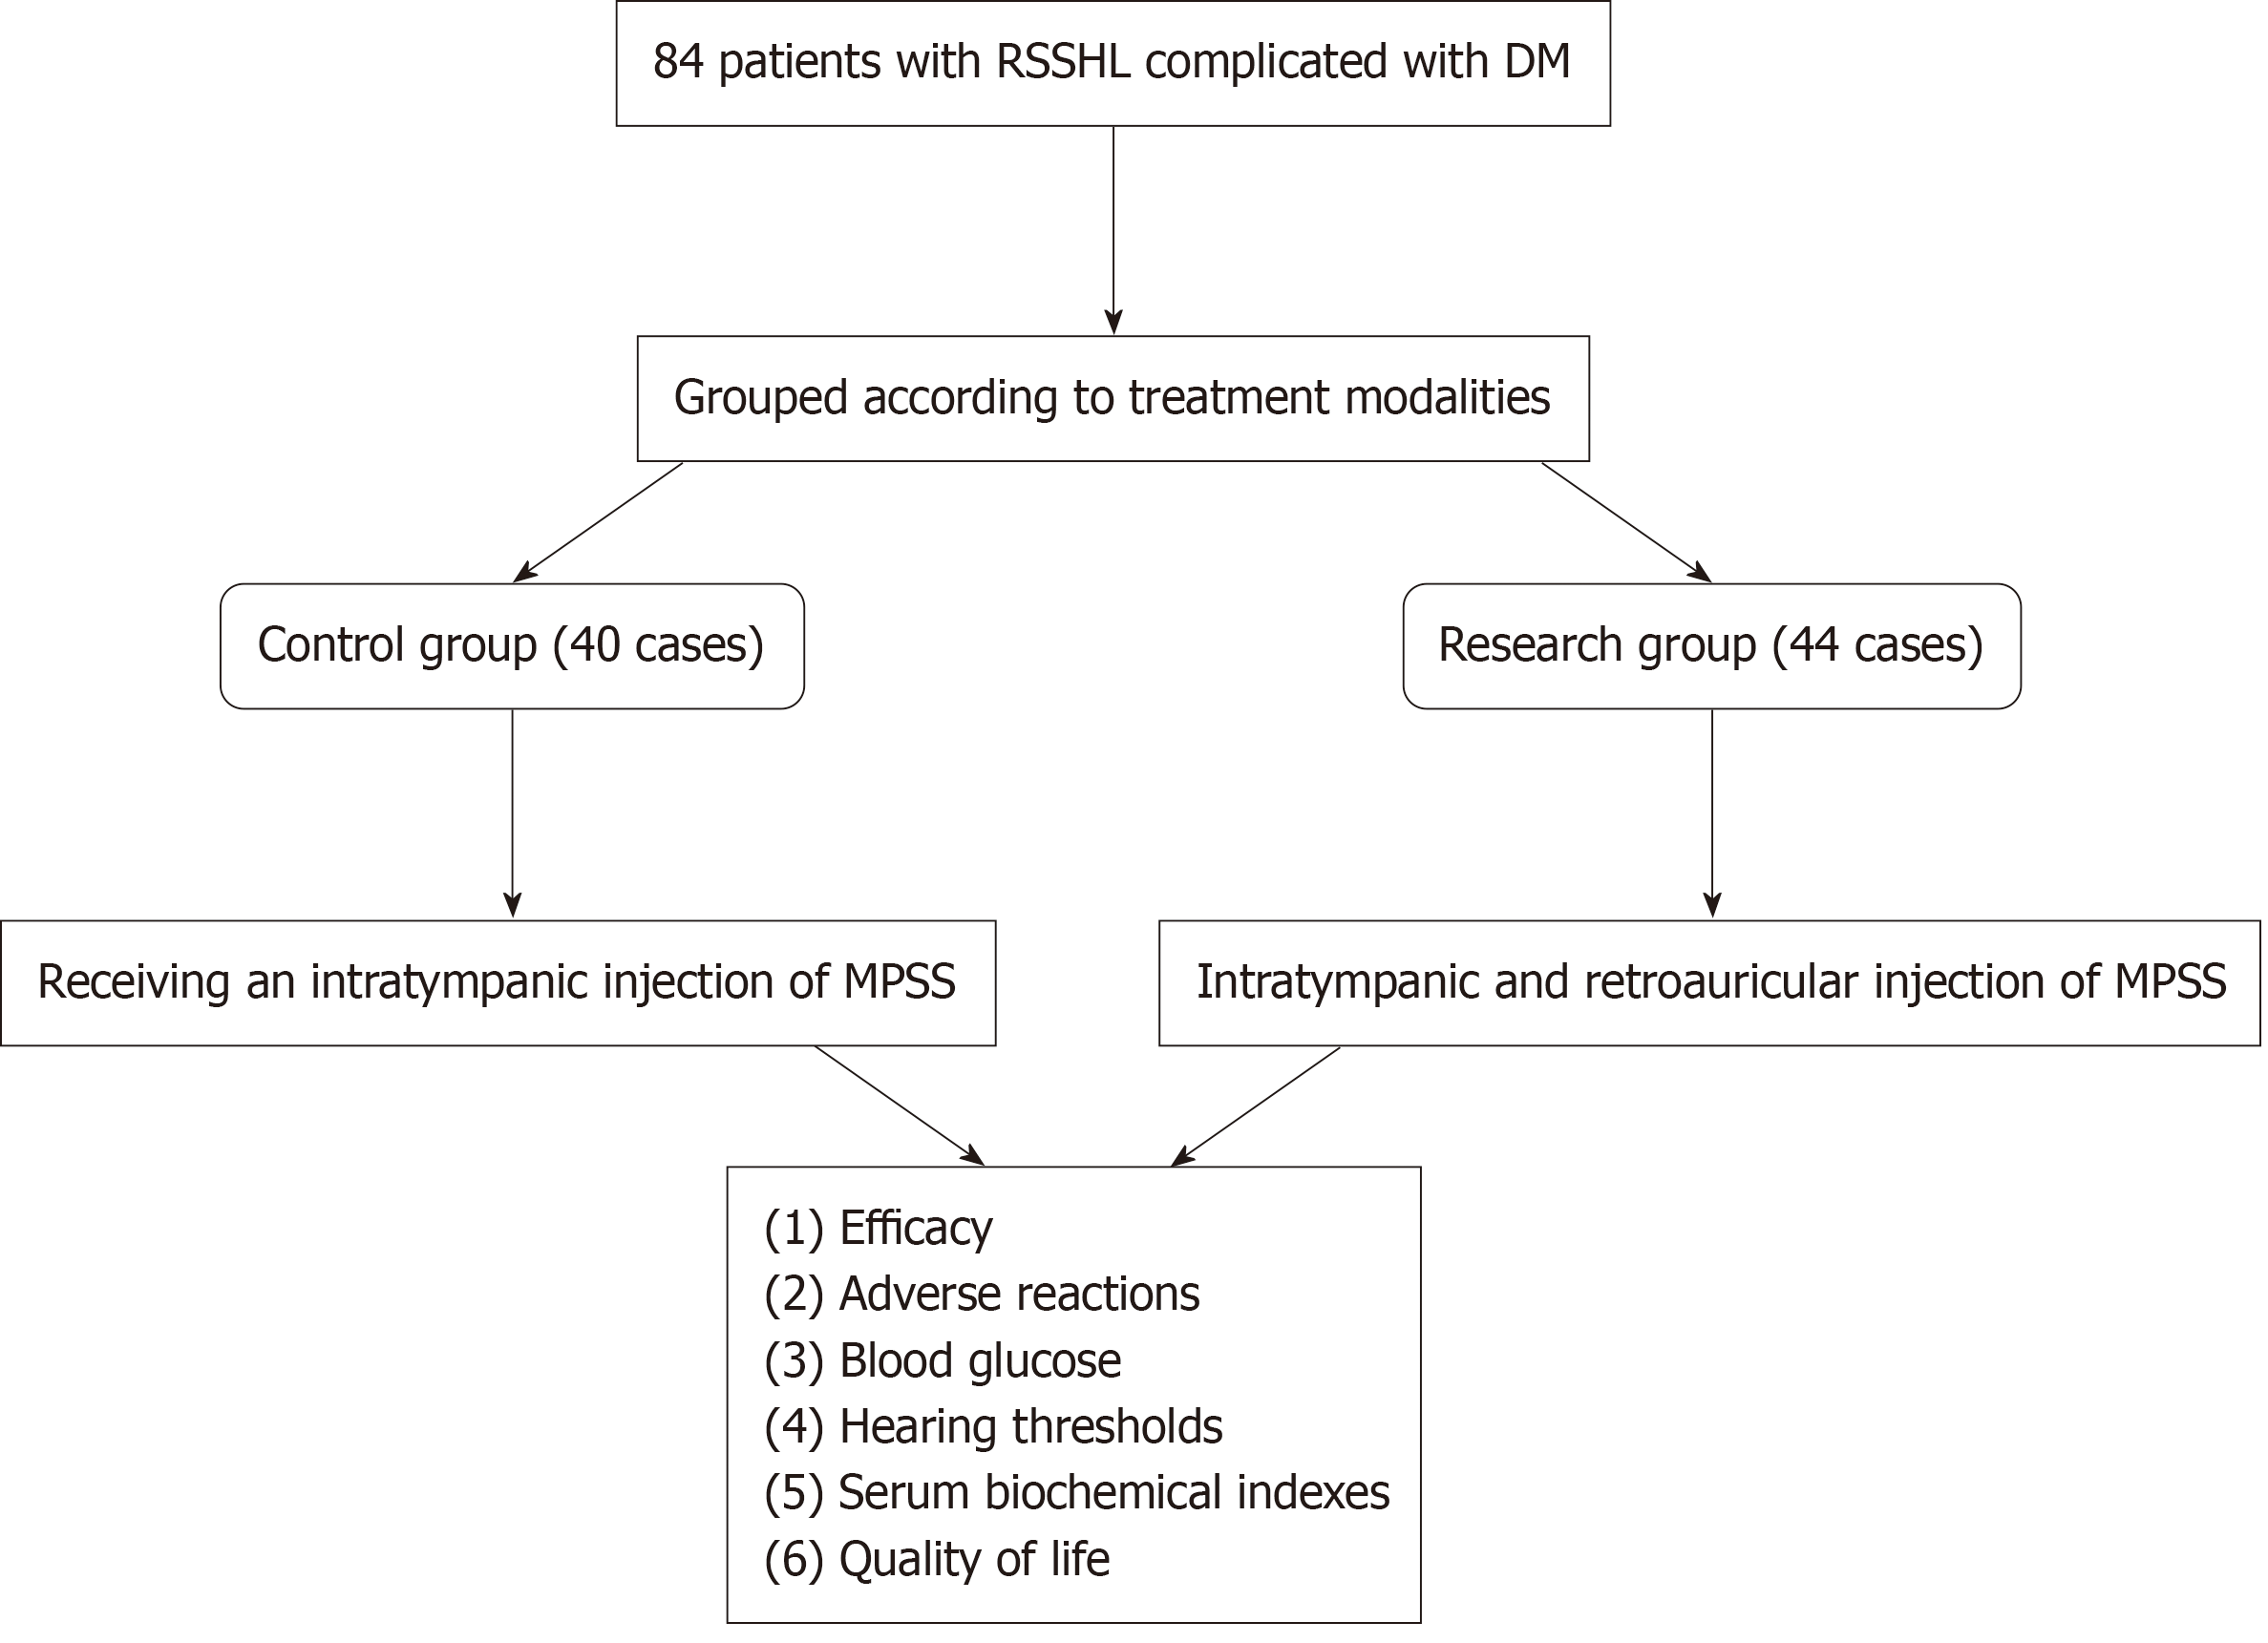
Figure 1 The flowchart illustrating the design of this research.
MPSS: Methylprednisolone sodium succinate; RSSHL: Refractory sudden sensorineural hearing loss; DM: Diabetes mellitus.
Figure 2 Blood glucose of two groups.
A: Changes in fasting blood glucose before and after treatment; B: Changes in 2-hour postprandial blood glucose before and after treatment; C: Pre- and post-treatment glycosylated hemoglobin in two groups. aP < 0.05, bP < 0.01 in the inter-group comparison. FBG: Fasting blood glucose; 2hPBG: 2-hour postprandial blood glucose; HbA1c: Glycosylated hemoglobin.
Figure 3 Hearing thresholds at different frequencies in two groups.
A: The hearing threshold at 250 Hz in both groups; B: The hearing threshold at 500 Hz in both groups; C: The hearing threshold at 1000 Hz in both groups. aP < 0.05, bP < 0.01 in the inter-group comparison.
Figure 4 Serum biochemical indexes of the two groups.
A: Changes in interleukin-6 in the two groups before and after treatment; B: Changes in C-reactive protein before and after treatment in the two groups; C: Pre- and post-treatment procalcitonin in two groups. aP < 0.05, bP < 0.01 in the inter-group comparison. IL-6: Interleukin-6; CRP: C-reactive protein; PCT: Post-treatment procalcitonin.
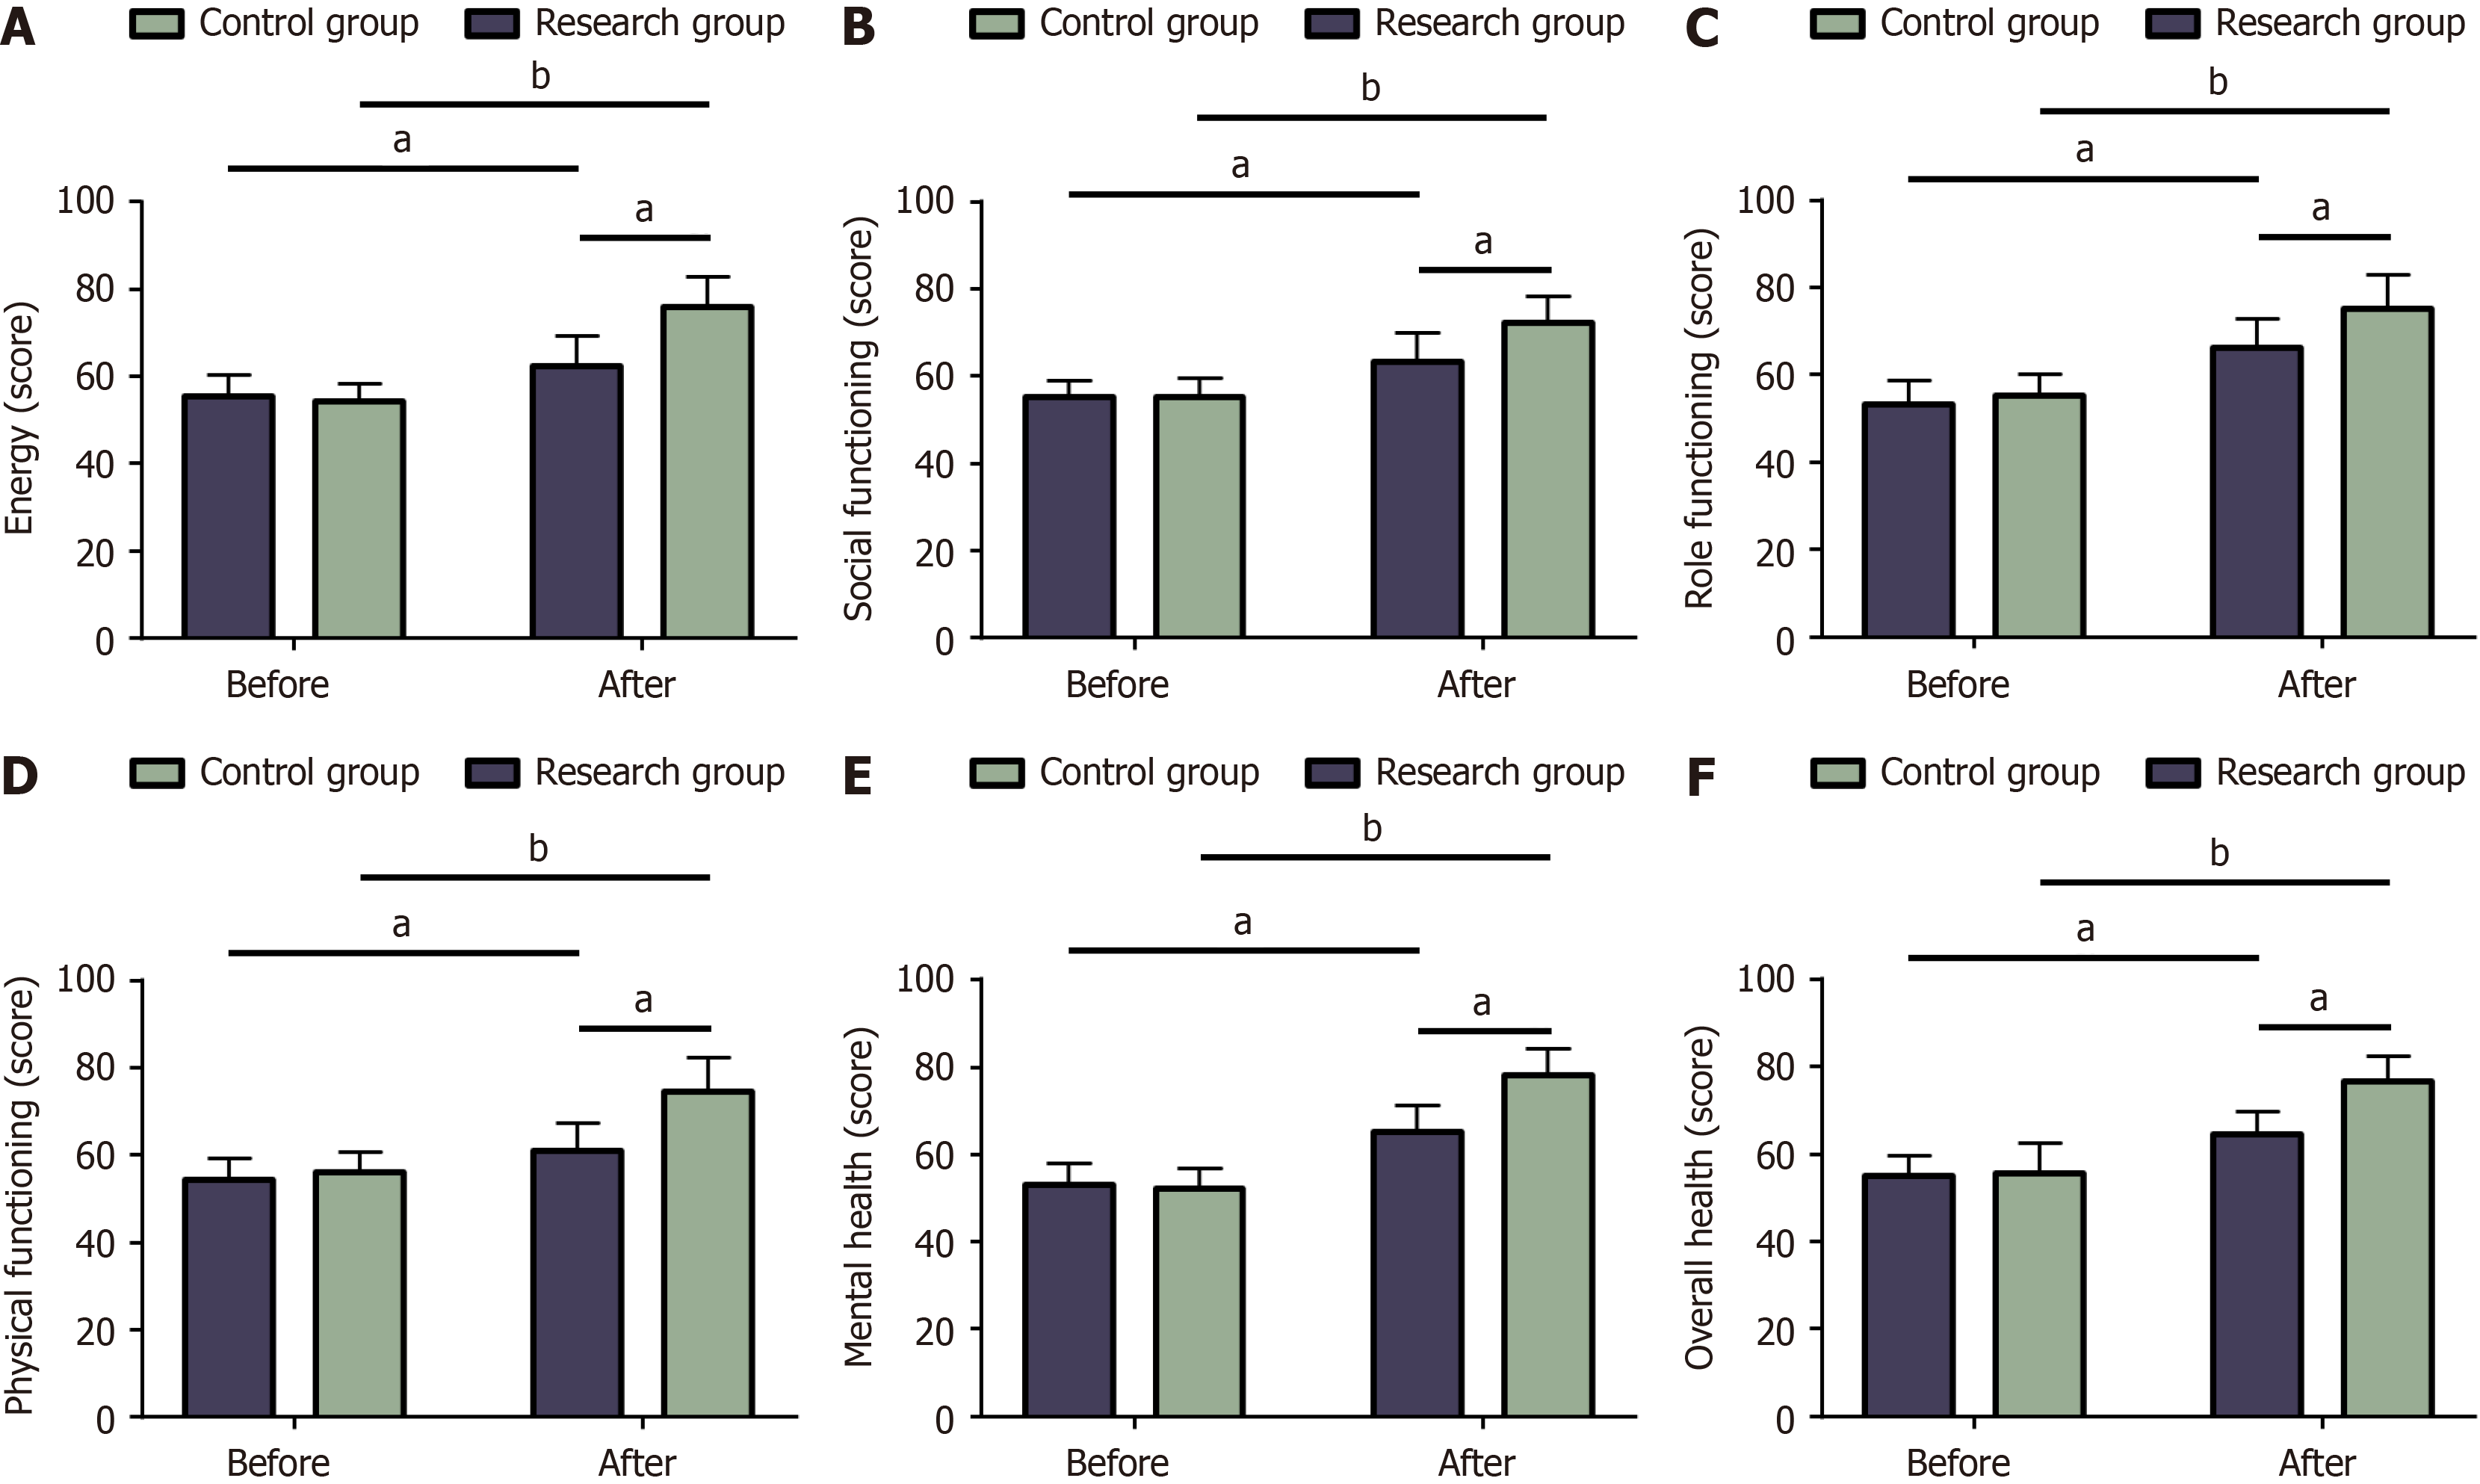
Figure 5 Quality of life of the two groups.
A: Changes in energy before and after treatment; B: Changes in social functioning before and after treatment; C: Changes in role functioning before and after treatment; D: Changes in body functioning before and after treatment; E: Changes in mental health before and after treatment; F: Changes in overall health changes before and after treatment. aP < 0.05, bP < 0.01 in the inter-group comparison.
- Citation: Li D, Qiao F, Dai J, Xu M, Gong HY, Yang HM, Li JC, Huai D. Therapeutic effectiveness of intratympanic and retroauricular methylprednisolone sodium succinate for refractory sudden sensorineural hearing loss in diabetic patients. World J Diabetes 2025; 16(5): 99576
- URL: https://www.wjgnet.com/1948-9358/full/v16/i5/99576.htm
- DOI: https://dx.doi.org/10.4239/wjd.v16.i5.99576


