Copyright
©The Author(s) 2025.
World J Diabetes. May 15, 2025; 16(5): 95431
Published online May 15, 2025. doi: 10.4239/wjd.v16.i5.95431
Published online May 15, 2025. doi: 10.4239/wjd.v16.i5.95431
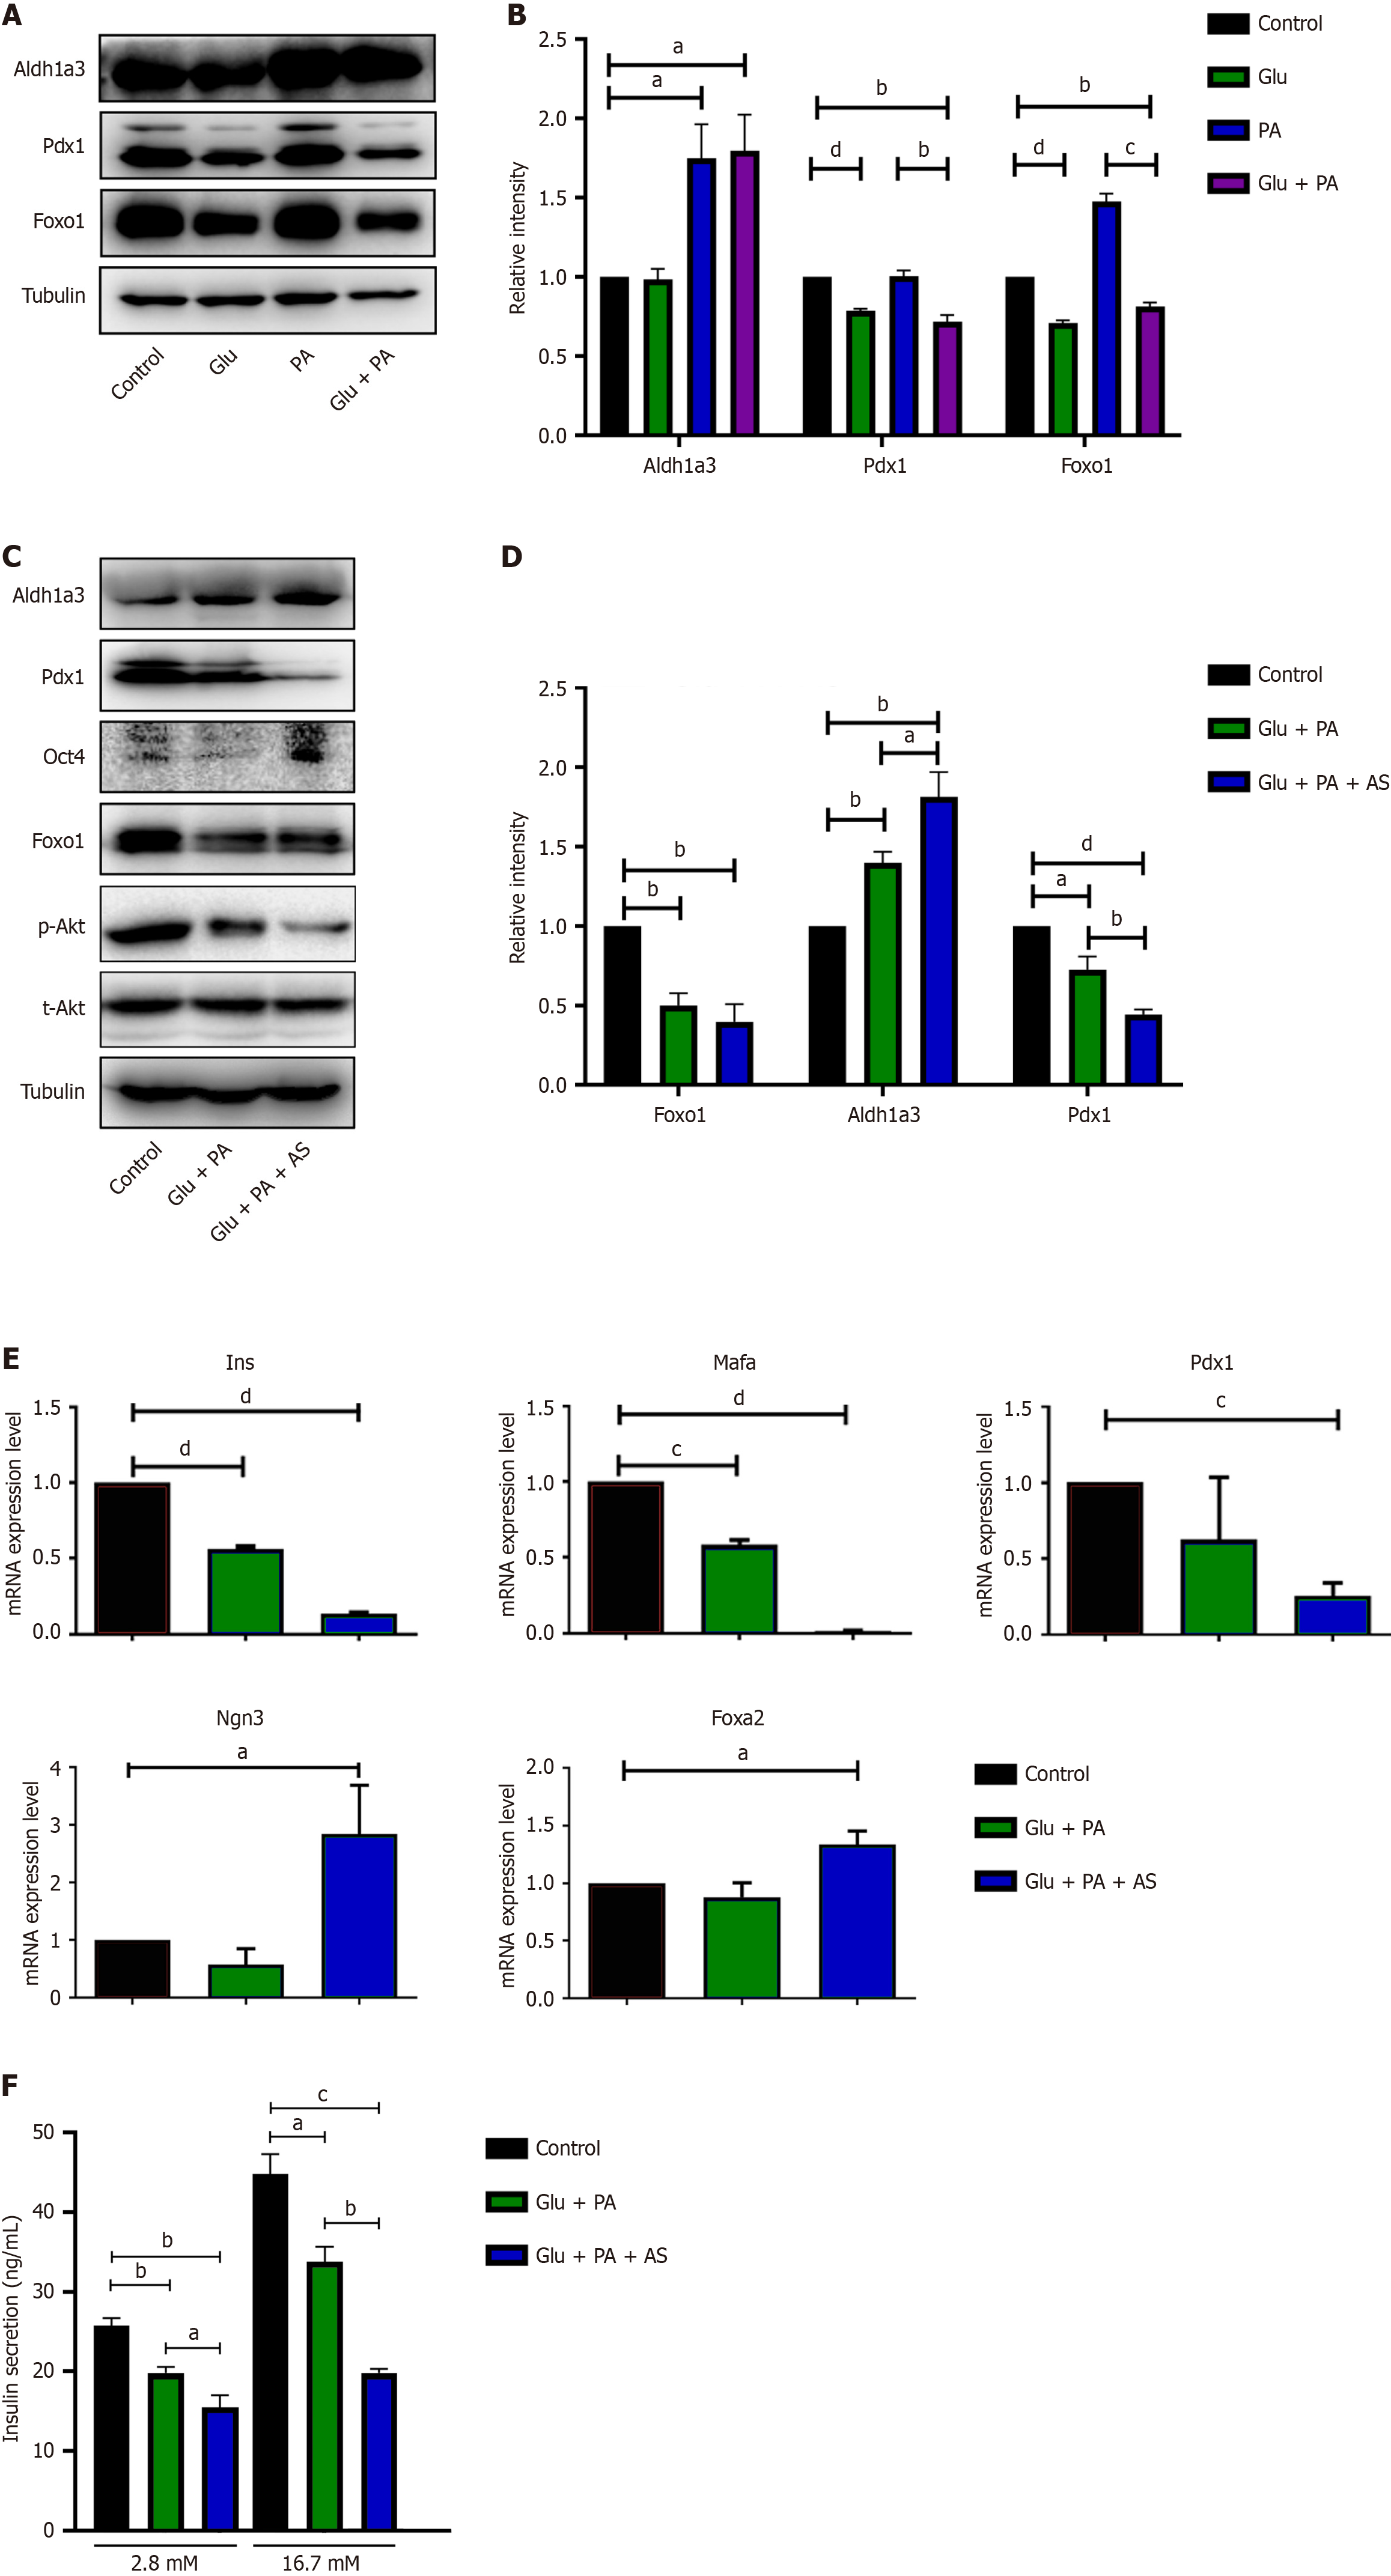
Figure 1 Palmitic acid and high glucose induced INS-1 cell dedifferentiation.
A and B: INS-1 cell treated with bovine serum albumin (BSA) (control), 25 mmol/L glucose (Glu), 300 μmol/L palmitic acid (PA), or Glu + PA for 36 hours, and western blot (A) and quantification (B) of aldehyde dehydrogenase 1 family member A3 (Aldh1a3), pancreatic and duodenal homeobox 1 (Pdx1) and forkhead box O1 (Foxo1); C and D: INS-1 cell treated with BSA (control), 25 mmol/L Glu + 300 μmol/L PA, or 25 mmol/L Glu + 300 μmol/L PA + 1 μmol/L AS1842856 (AS) for 36 hours, and western blot (C) and quantification (D) of Aldh1a3, Pdx1 and Foxo1; E: Quantification of the mRNA levels of Ins, Mafa, Pdx1, Ngn3 and Foxa2 in INS-1 cell after 36 hours of treatment with Glu + PA or Glu + PA + AS relative to the untreated control. The mRNA expression of the treatment group was indicated by the fold change compared with that of the control group, and three independent samples were performed; F: Insulin secretion was stimulated with high glucose (16.7 mmol/L) and low glucose (2.8 mmol/L) in INS-1 cells after 36 hours of treatment with Glu + PA or Glu + PA + AS. Data are presented as means ± SEM. aP < 0.05. bP < 0.01. cP < 0.001. dP < 0.0001. Glu: Glucose; PA: Palmitic acid; AS: AS1842856; Pdx1: Pancreatic and duodenal homeobox 1; Aldh1a3: Aldehyde dehydrogenase 1 family member A3; Foxo1: Forkhead box O1; Oct4: Octamer-binding transcription factor 4.
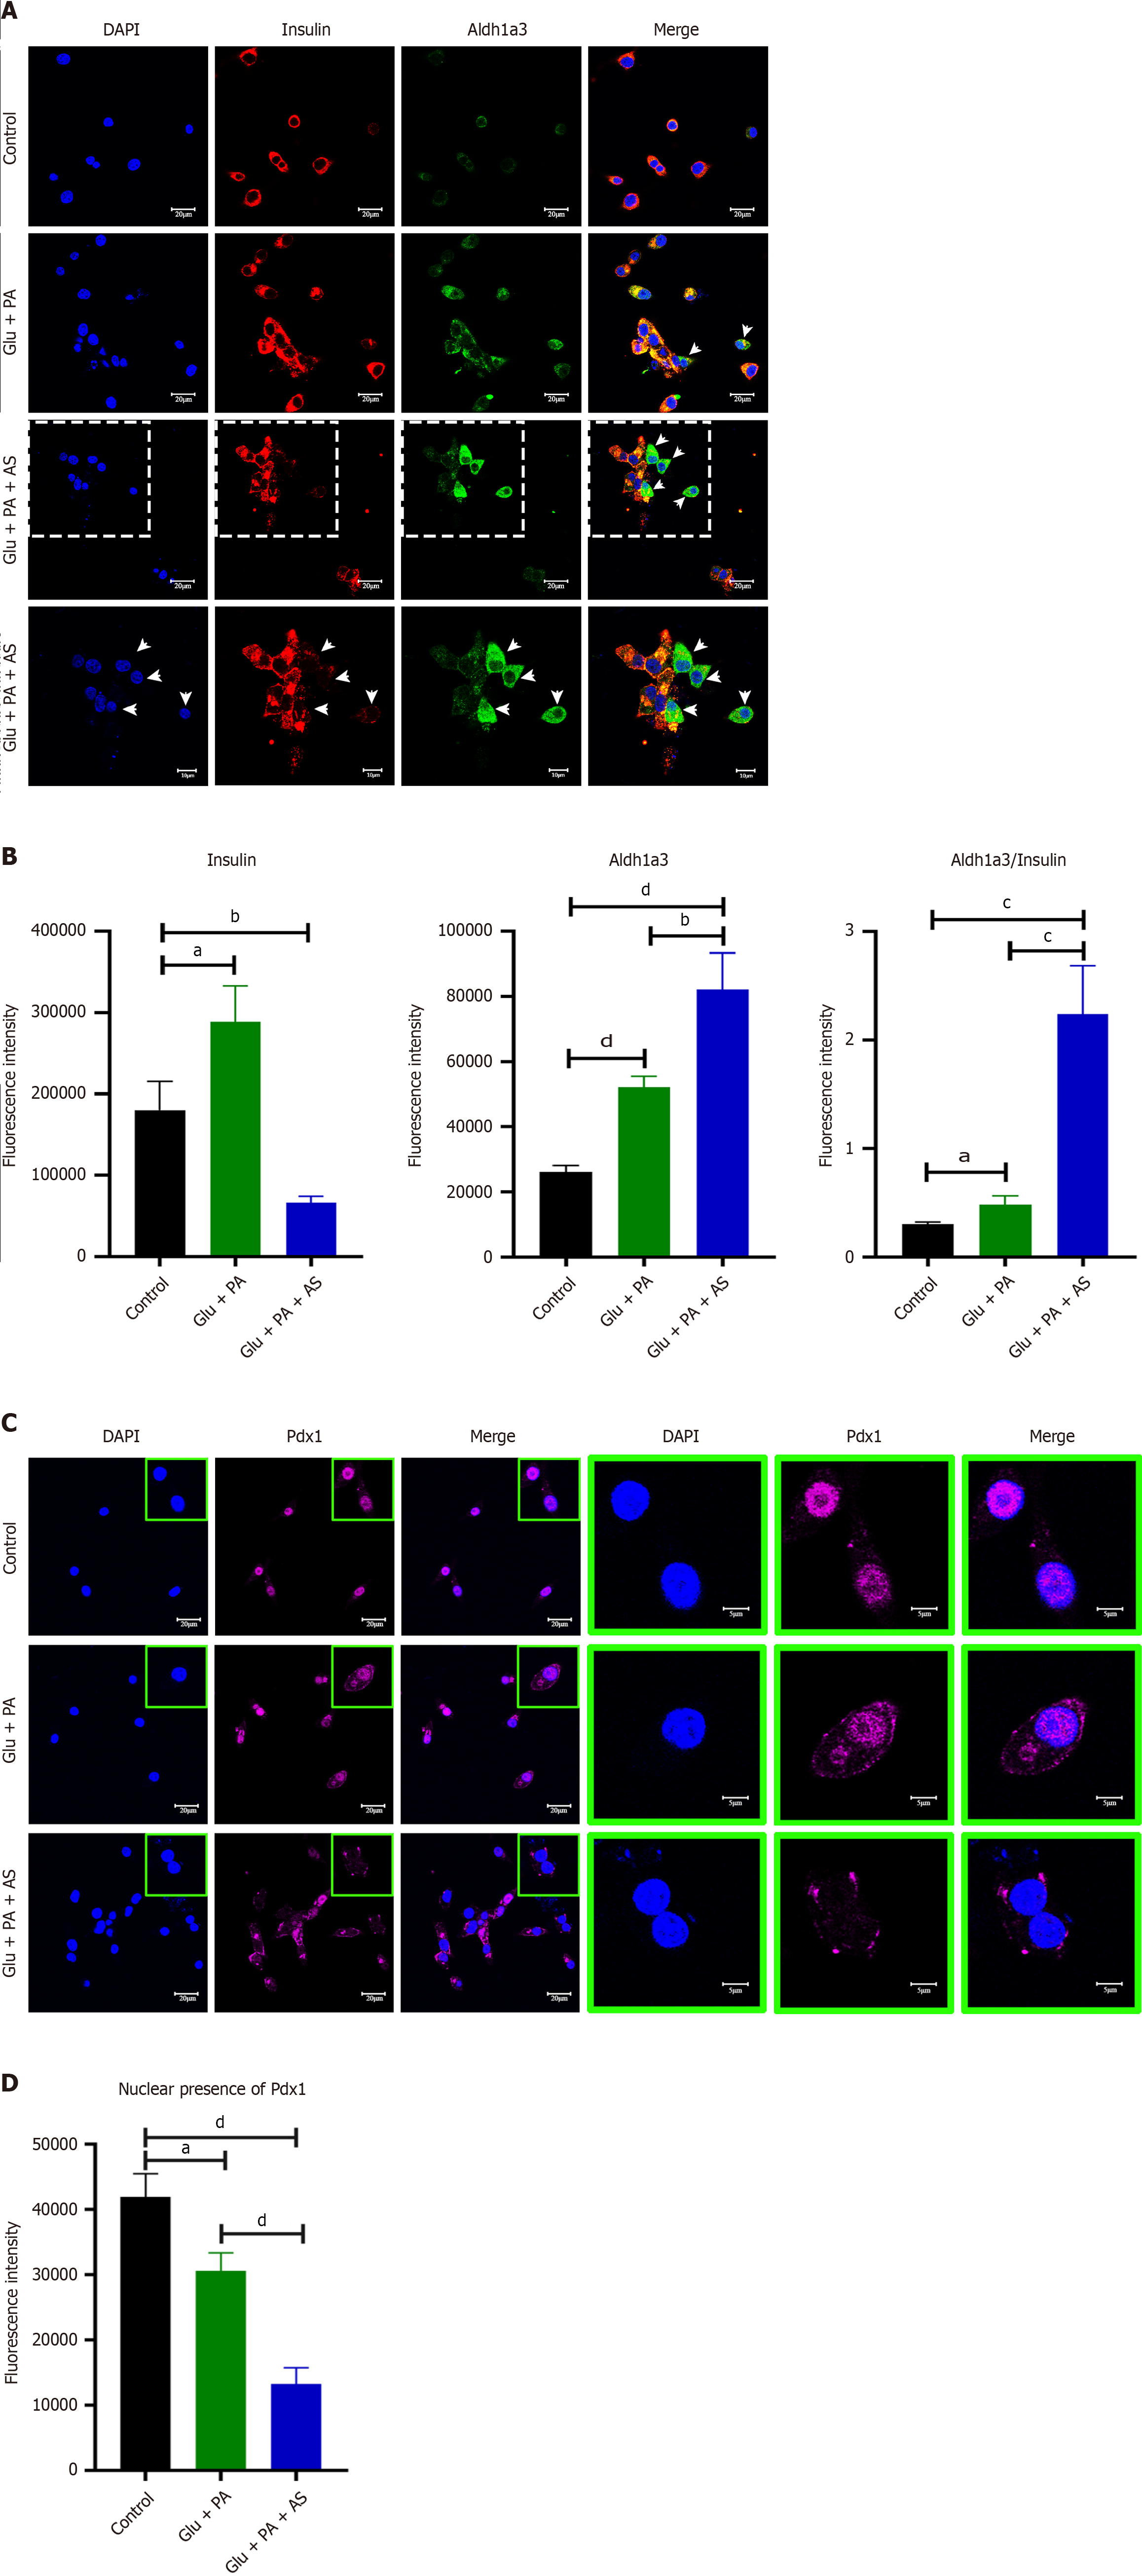
Figure 2 High glucose and palmitic acid increased aldehyde dehydrogenase 1 family member A3 level and pancreatic and duodenal homeobox 1 translocation.
A: Immunofluorescence staining with 4’,6-Diamidino-2’-phenylindole (DAPI) (blue), insulin (red) and aldehyde dehydrogenase 1 family member A3 (Aldh1a3) (green) of INS-1 cell treated with bovine serum albumin (BSA) (control), high glucose plus palmitate acid (Glu + PA) or high glucose plus palmitate acid plus AS1842856 (Glu + PA + AS). Scale bars indicate 20 μm. Arrows indicate the Aldh1a3-positive cell. The lower panel indicates magnified images, shown in dashed squares. Scale bars indicate 10 μm; B: Quantification of the fluorescence intensity of insulin, Aldh1a3, and the ratio of Aldh1a3/insulin. Three different experiments were performed; C: Immunofluorescence with DAPI (blue) and pancreatic and duodenal homeobox 1 (Pdx1) (magenta) of INS-1 treated with BSA (control), high Glu + PA, or high Glu + PA + AS. Scale bars indicate 20 μm; D: Quantification of Pdx1 intensity in nuclei, and three different experiments were performed. Data are presented as means ± SEM. aP < 0.05. bP < 0.01. cP < 0.001. dP < 0.0001. Glu: Glucose; PA: Palmitic acid; AS: AS1842856; Pdx1: Pancreatic and duodenal homeobox 1; Aldh1a3: Aldehyde dehydrogenase 1 family member A3; DAPI: 4’,6-Diamidino-2’-phenylindole.
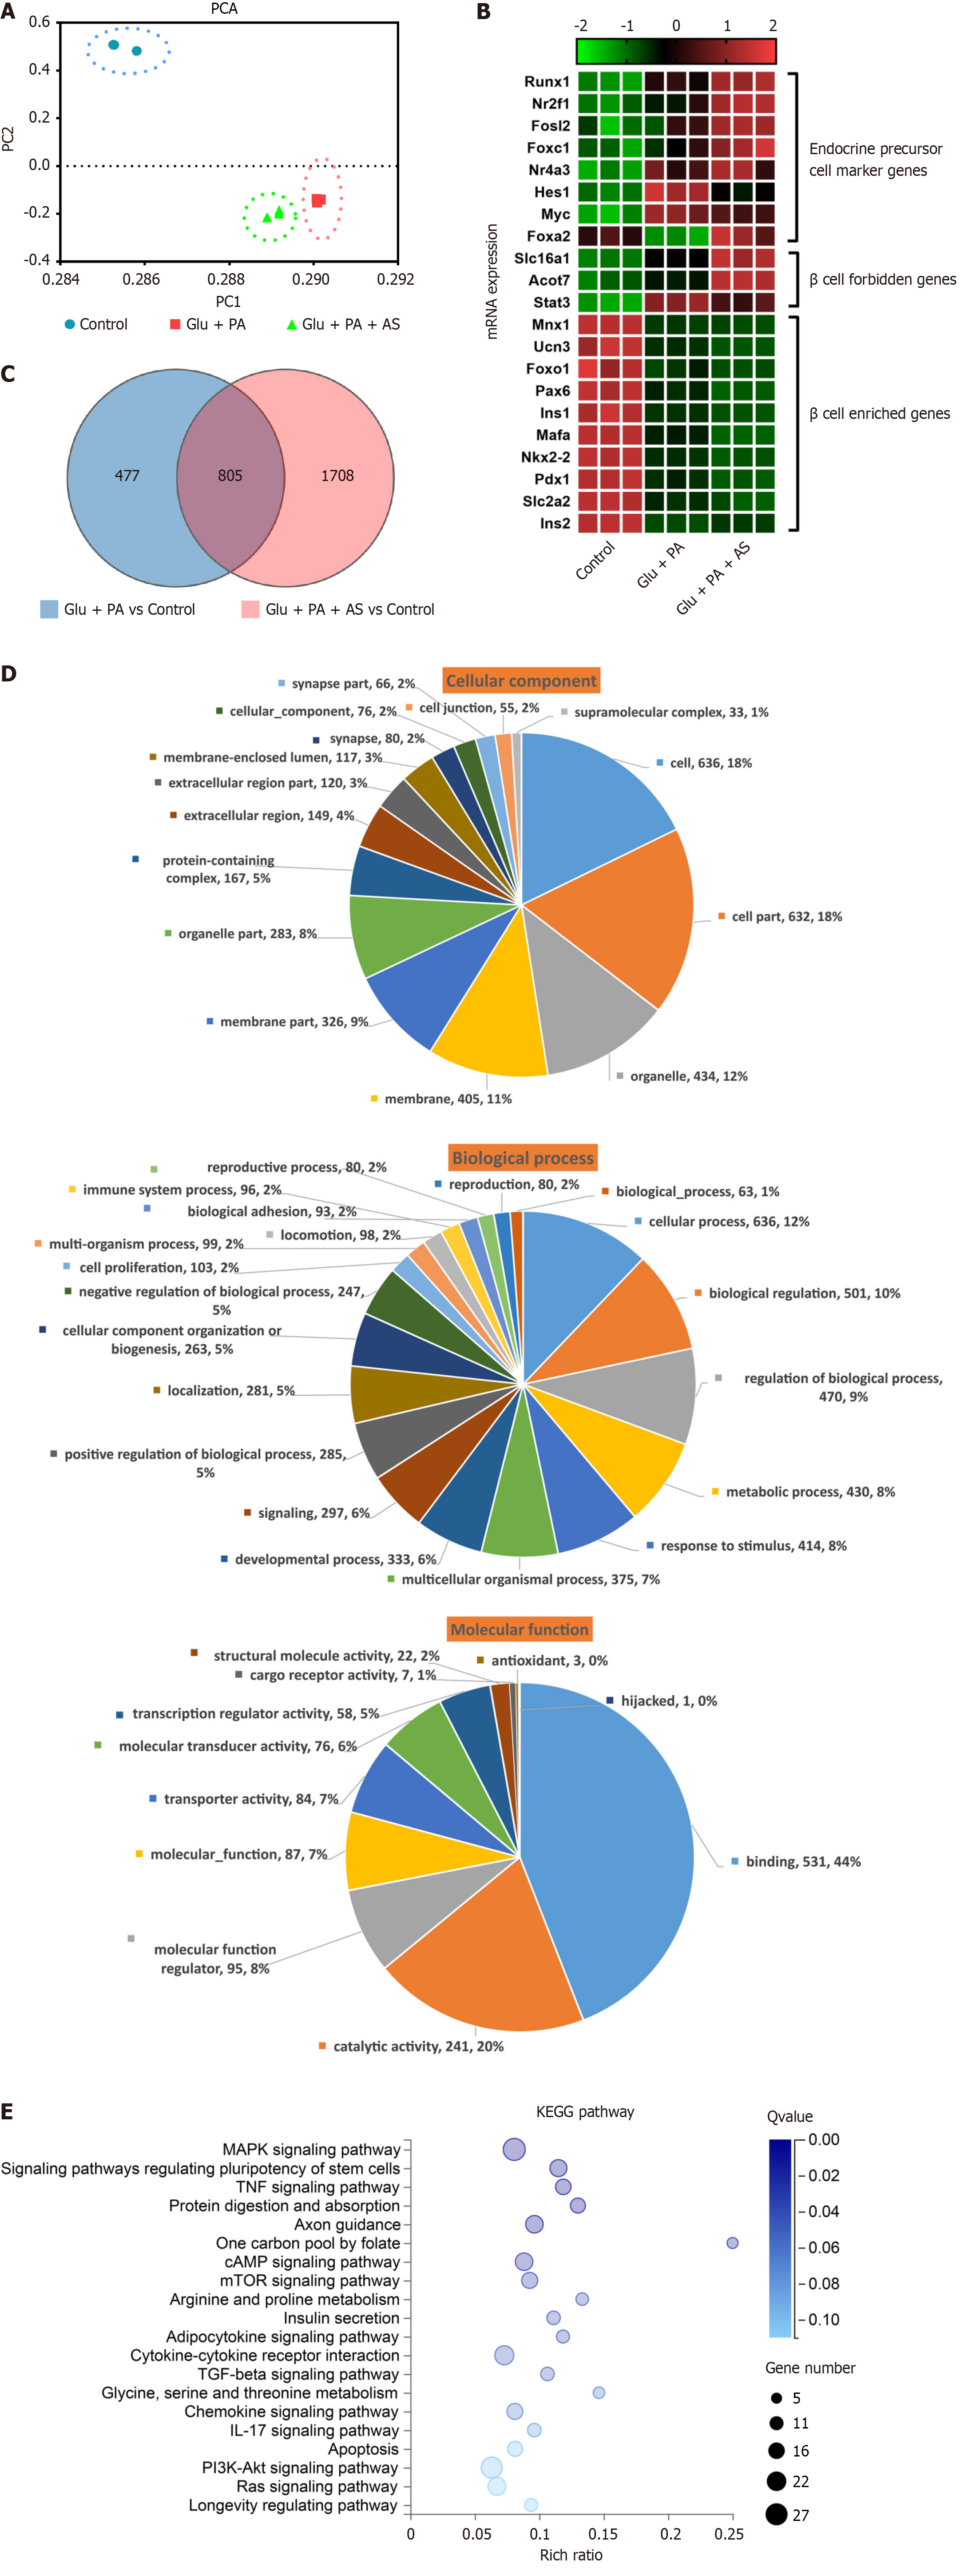
Figure 3 RNA-sequencing analysis of dedifferentiated INS-1 cells.
A: Principal component analysis plot of INS-1 cell treated with bovine serum albumin (control), high glucose plus palmitate acid (Glu + PA) or high glucose plus palmitate acid plus AS1842856 (Glu + PA + AS). Principal component 1 and principal component 2 were used for analysis; B: Heatmaps of transcripts in β-cell forbidden genes, endocrine precursor marker genes and β-cell enriched genes. Z-score metrics are indicated above the map; C: Venn diagram describes the differentially expressed genes (DEGs) in Glu + PA vs control, and Glu + PA + AS vs control; D: Gene Ontology (GO) classification of 805 co-expressed DEGs shared in (C), including molecular function, cellular component and biological process. Pie charts display the proportion of each subcategory, the number of genes, and the names of GO subcategories; E: Kyoto Encyclopedia of Genes and Genomes (KEGG) pathway cluster analysis based on the 805 co-enriched DEGs described in (C). The color indicates the enrichment Q value, and the size of bubbles indicates the number of genes annotated to the KEGG pathway. X-axis is the enrichment ratio, and Y-axis is the KEGG pathway. Q value ≤ 0.05 is considered a significant enrichment. PCA: Principal component analysis; Glu: Glucose; PA: Palmitic acid; AS: AS1842856; KEGG: Kyoto Encyclopedia of Genes and Genomes; MAPK: Mitogen-activated protein kinase; TNF: Tumor necrosis factor; cAMP: Cyclic adenosine monophosphate; mTOR: Mammalian target of rapamycin; TGF: Transforming growth factor; IL: Interleukin.
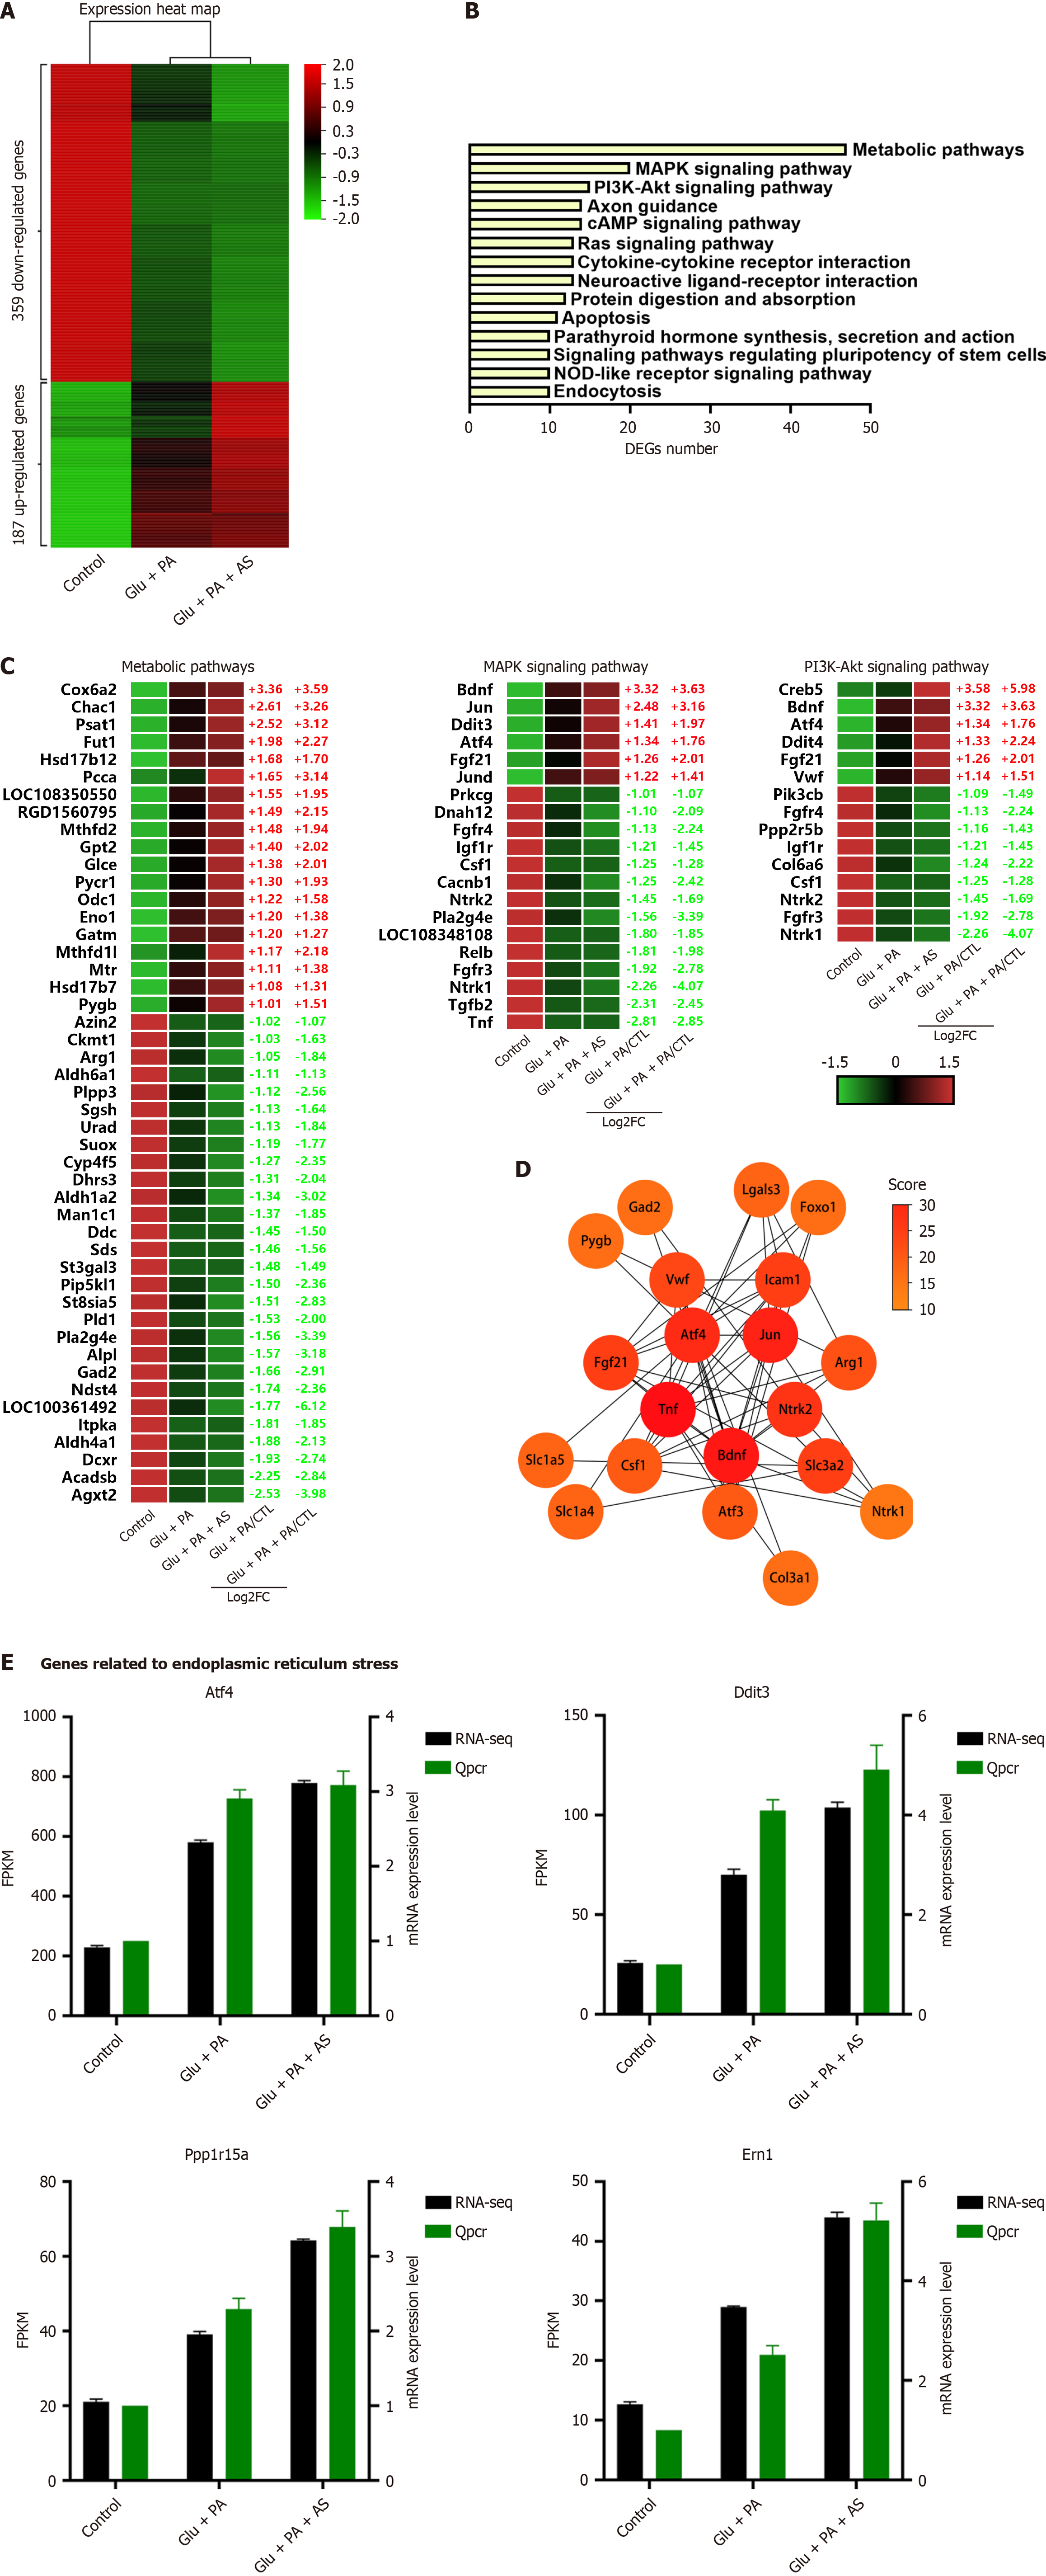
Figure 4 Analysis of differentially expressed genes is associated with forkhead box O1-inhibition reinforced β-cell dedifferentiation.
A: Heatmap of differential genes with a consistent expression trend in high glucose plus palmitate acid (Glu + PA) or high glucose plus palmitate acid plus AS1842856 (Glu + PA + AS), including 187 upregulated genes and 359 downregulated genes. Z-score indicators are shown on the right of the map; B: Kyoto Encyclopedia of Genes and Genomes enrichment pathway of differentially expressed genes (DEGs) in (A); C: Heatmaps of the top three enrichment pathways, including metabolic pathway, mitogen-activated protein kinase pathway and phosphatidylinositol 3-kinase-protein kinase B pathway; D: Top 20 hub genes from the protein-protein interaction network of DEGs. Different scores of the hub genes are shown as gradual colors (yellow indicates low scores, red indicates high scores); E: Verification of quantitative real-time polymerase chain reaction in endoplasmic reticulum stress-related genes. Glu: Glucose; PA: Palmitic acid; AS: AS1842856; MAPK: Mitogen-activated protein kinase; PI3K: Phosphatidylinositol 3-kinase; FC: Fold change; CTL: Cytotoxic T lymphocyte; KEGG: Kyoto Encyclopedia of Genes and Genomes; cAMP: Cyclic adenosine monophosphate; DEGs: Differentially expressed genes; NOD: Nucleotide-binding and oligomerization domain; FPKM: Fragments per kilobase of transcript per million mapped reads.
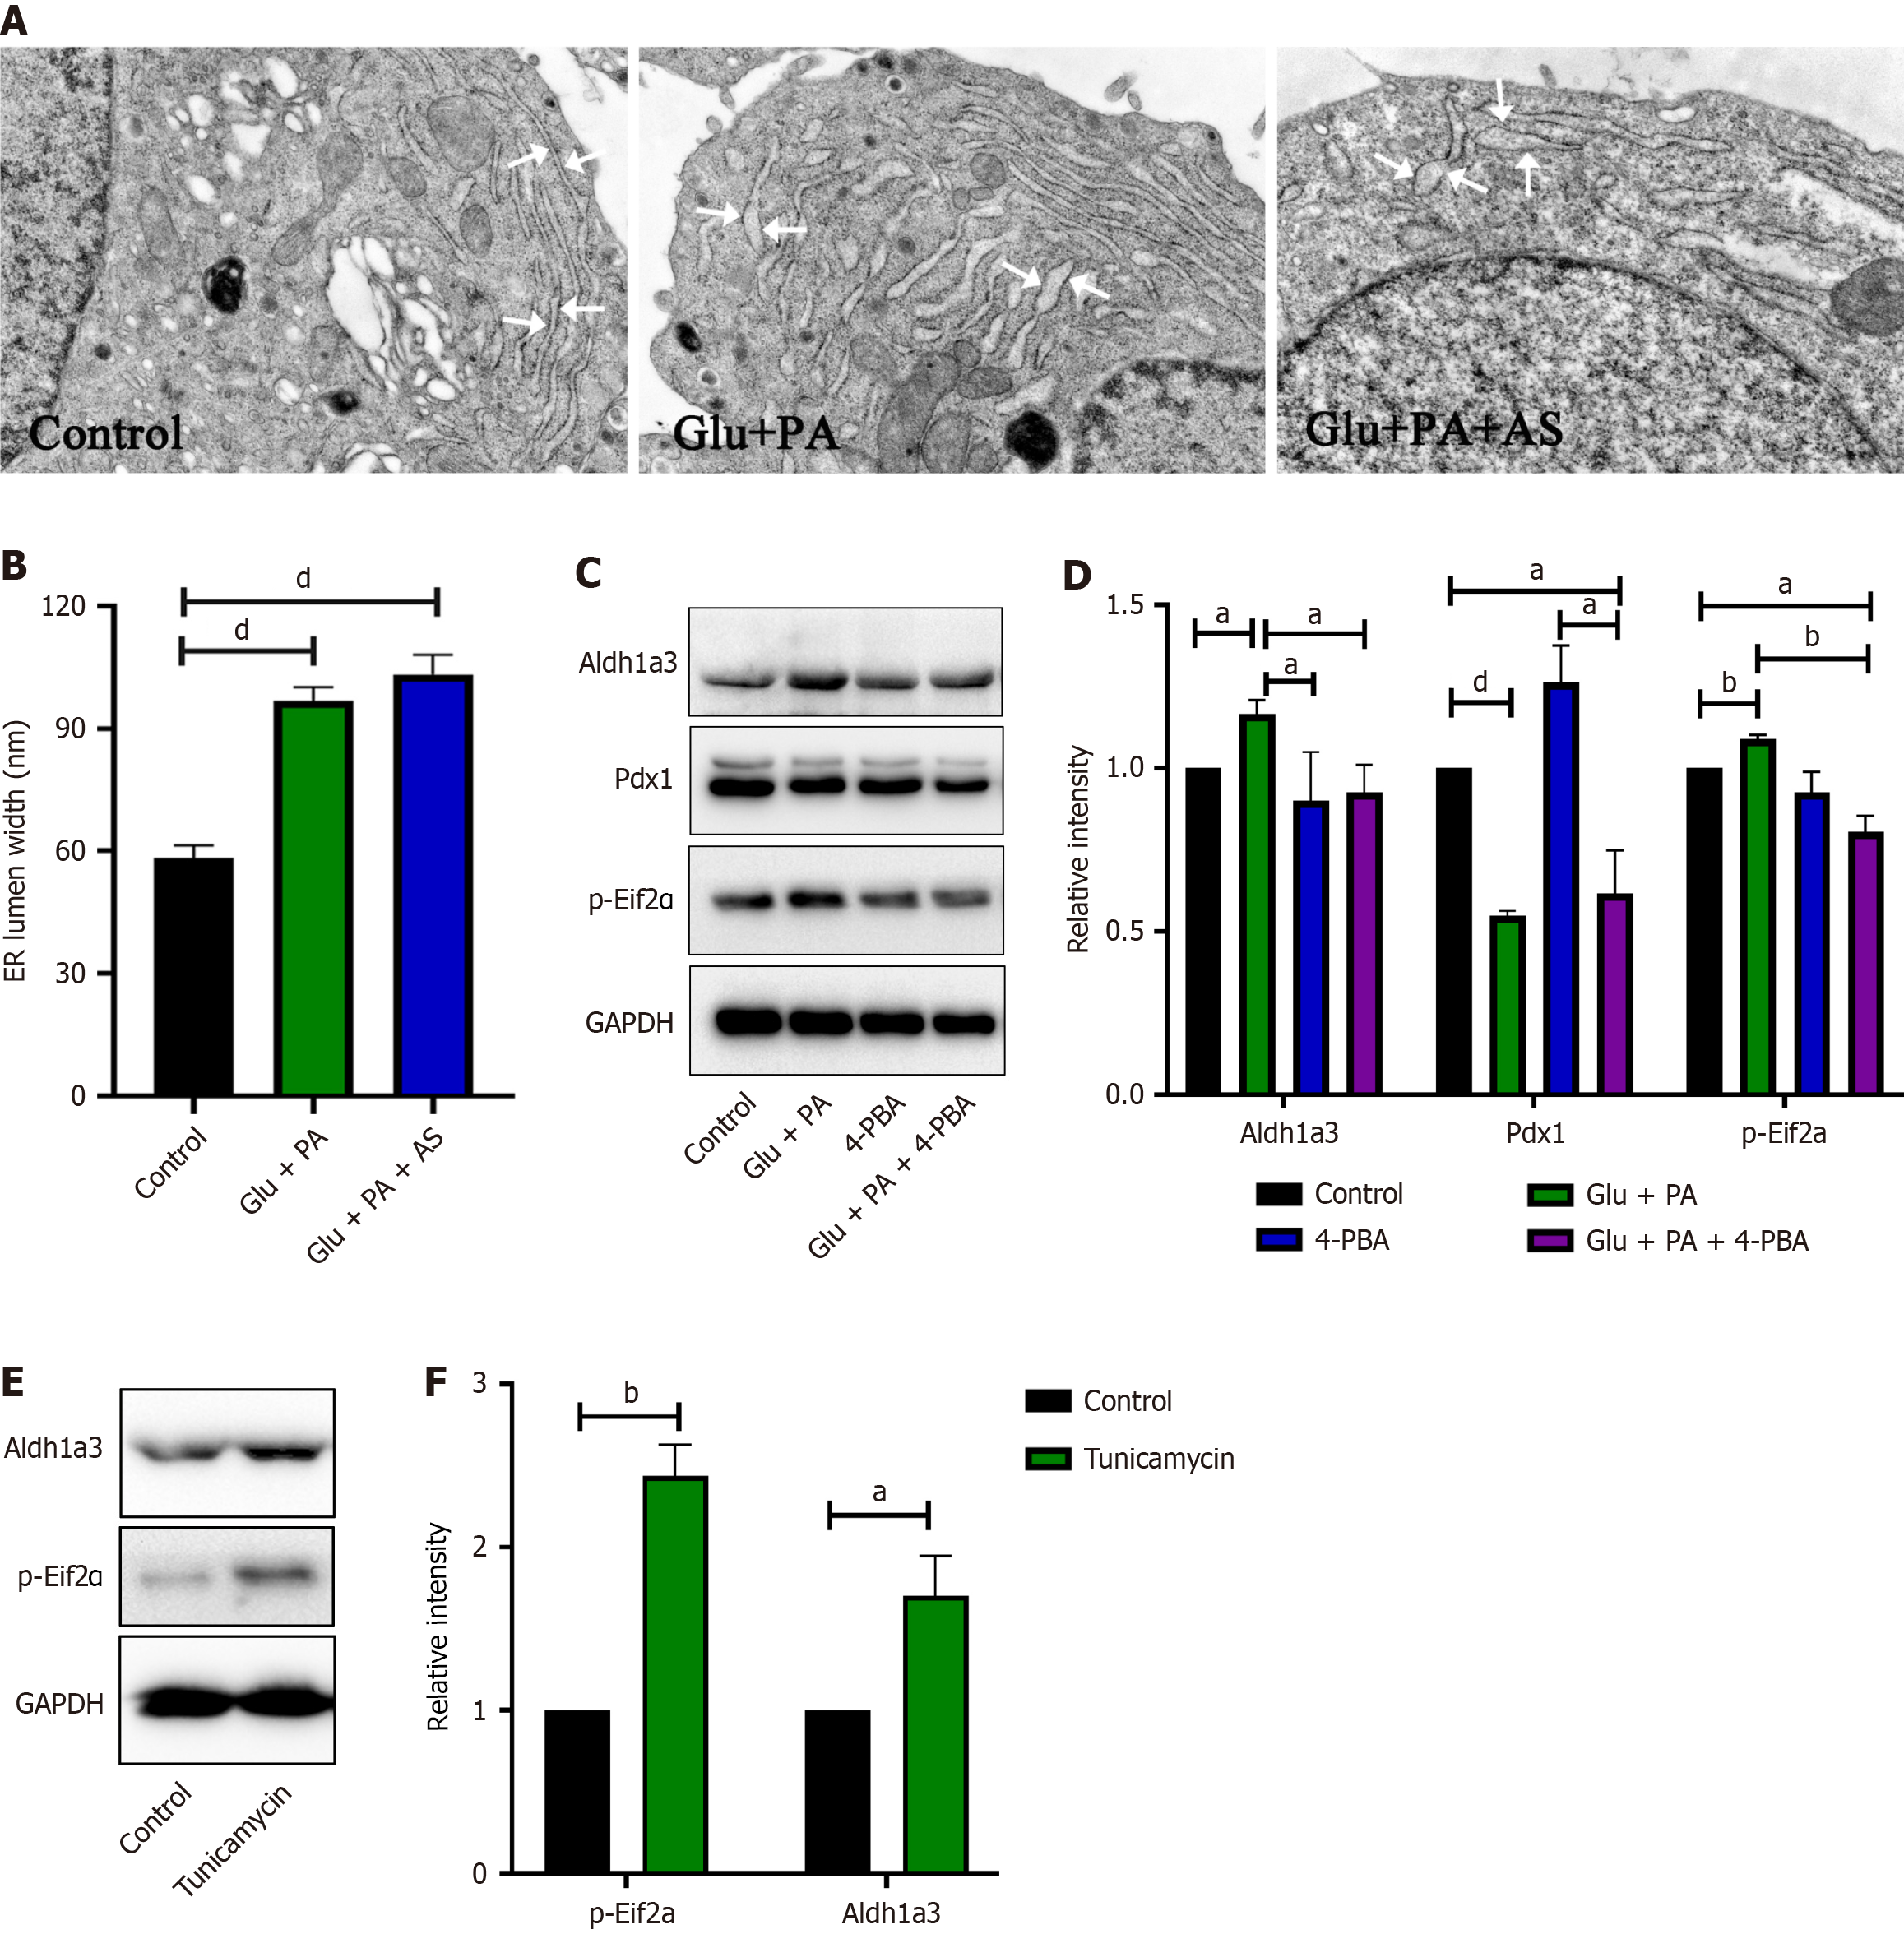
Figure 5 High glucose and palmitic acid induced β-cell dedifferentiation due to endoplasmic reticulum stress.
A and B: Electron micrograph (A) and statistical analysis (B) of the endoplasmic reticulum lumen width in INS-1 cell treated with bovine serum albumin (BSA) (control), 25 mmol/L glucose plus 300 μmol/L palmitic acid (Glu + PA), or 25 mmol/L glucose plus 300 μmol/L palmitic acid plus 1 μmol/L AS1842856 (Glu + PA + AS) for 36 hours; C and D: Western blot (C) and quantification (D) of aldehyde dehydrogenase 1 family member A3 (Aldh1a3), pancreatic and duodenal homeobox 1, and p-Eif2α levels in INS-1 cell treated with BSA (control), Glu + PA, 300 μmol/L 4-phenyl butyric acid (4-PBA), or Glu + PA + 4-PBA for 36 hours; E and F: INS-1 cell treated with 5 μg/mL tunicamycin for 12 hours, and western blot (E) and quantification (F) of Aldh1a3 and p-Eif2α levels. Data are presented as means ± SEM. aP < 0.05. bP < 0.01. cP < 0.001. dP < 0.0001. Glu: Glucose; PA: Palmitic acid; AS: AS1842856; Pdx1: Pancreatic and duodenal homeobox 1; Aldh1a3: Aldehyde dehydrogenase 1 family member A3; ER: Endoplasmic reticulum; GAPDH: Glyceraldehyde-3-phosphate dehydrogenase; 4-PBA: 4-phenyl butyric acid.
- Citation: Wang LK, Kong CC, Yu TY, Sun HS, Yang L, Sun Y, Li MY, Wang W. Endoplasmic reticulum stress and forkhead box protein O1 inhibition mediate palmitic acid and high glucose-induced β-cell dedifferentiation. World J Diabetes 2025; 16(5): 95431
- URL: https://www.wjgnet.com/1948-9358/full/v16/i5/95431.htm
- DOI: https://dx.doi.org/10.4239/wjd.v16.i5.95431


