Copyright
©The Author(s) 2025.
World J Diabetes. May 15, 2025; 16(5): 103915
Published online May 15, 2025. doi: 10.4239/wjd.v16.i5.103915
Published online May 15, 2025. doi: 10.4239/wjd.v16.i5.103915
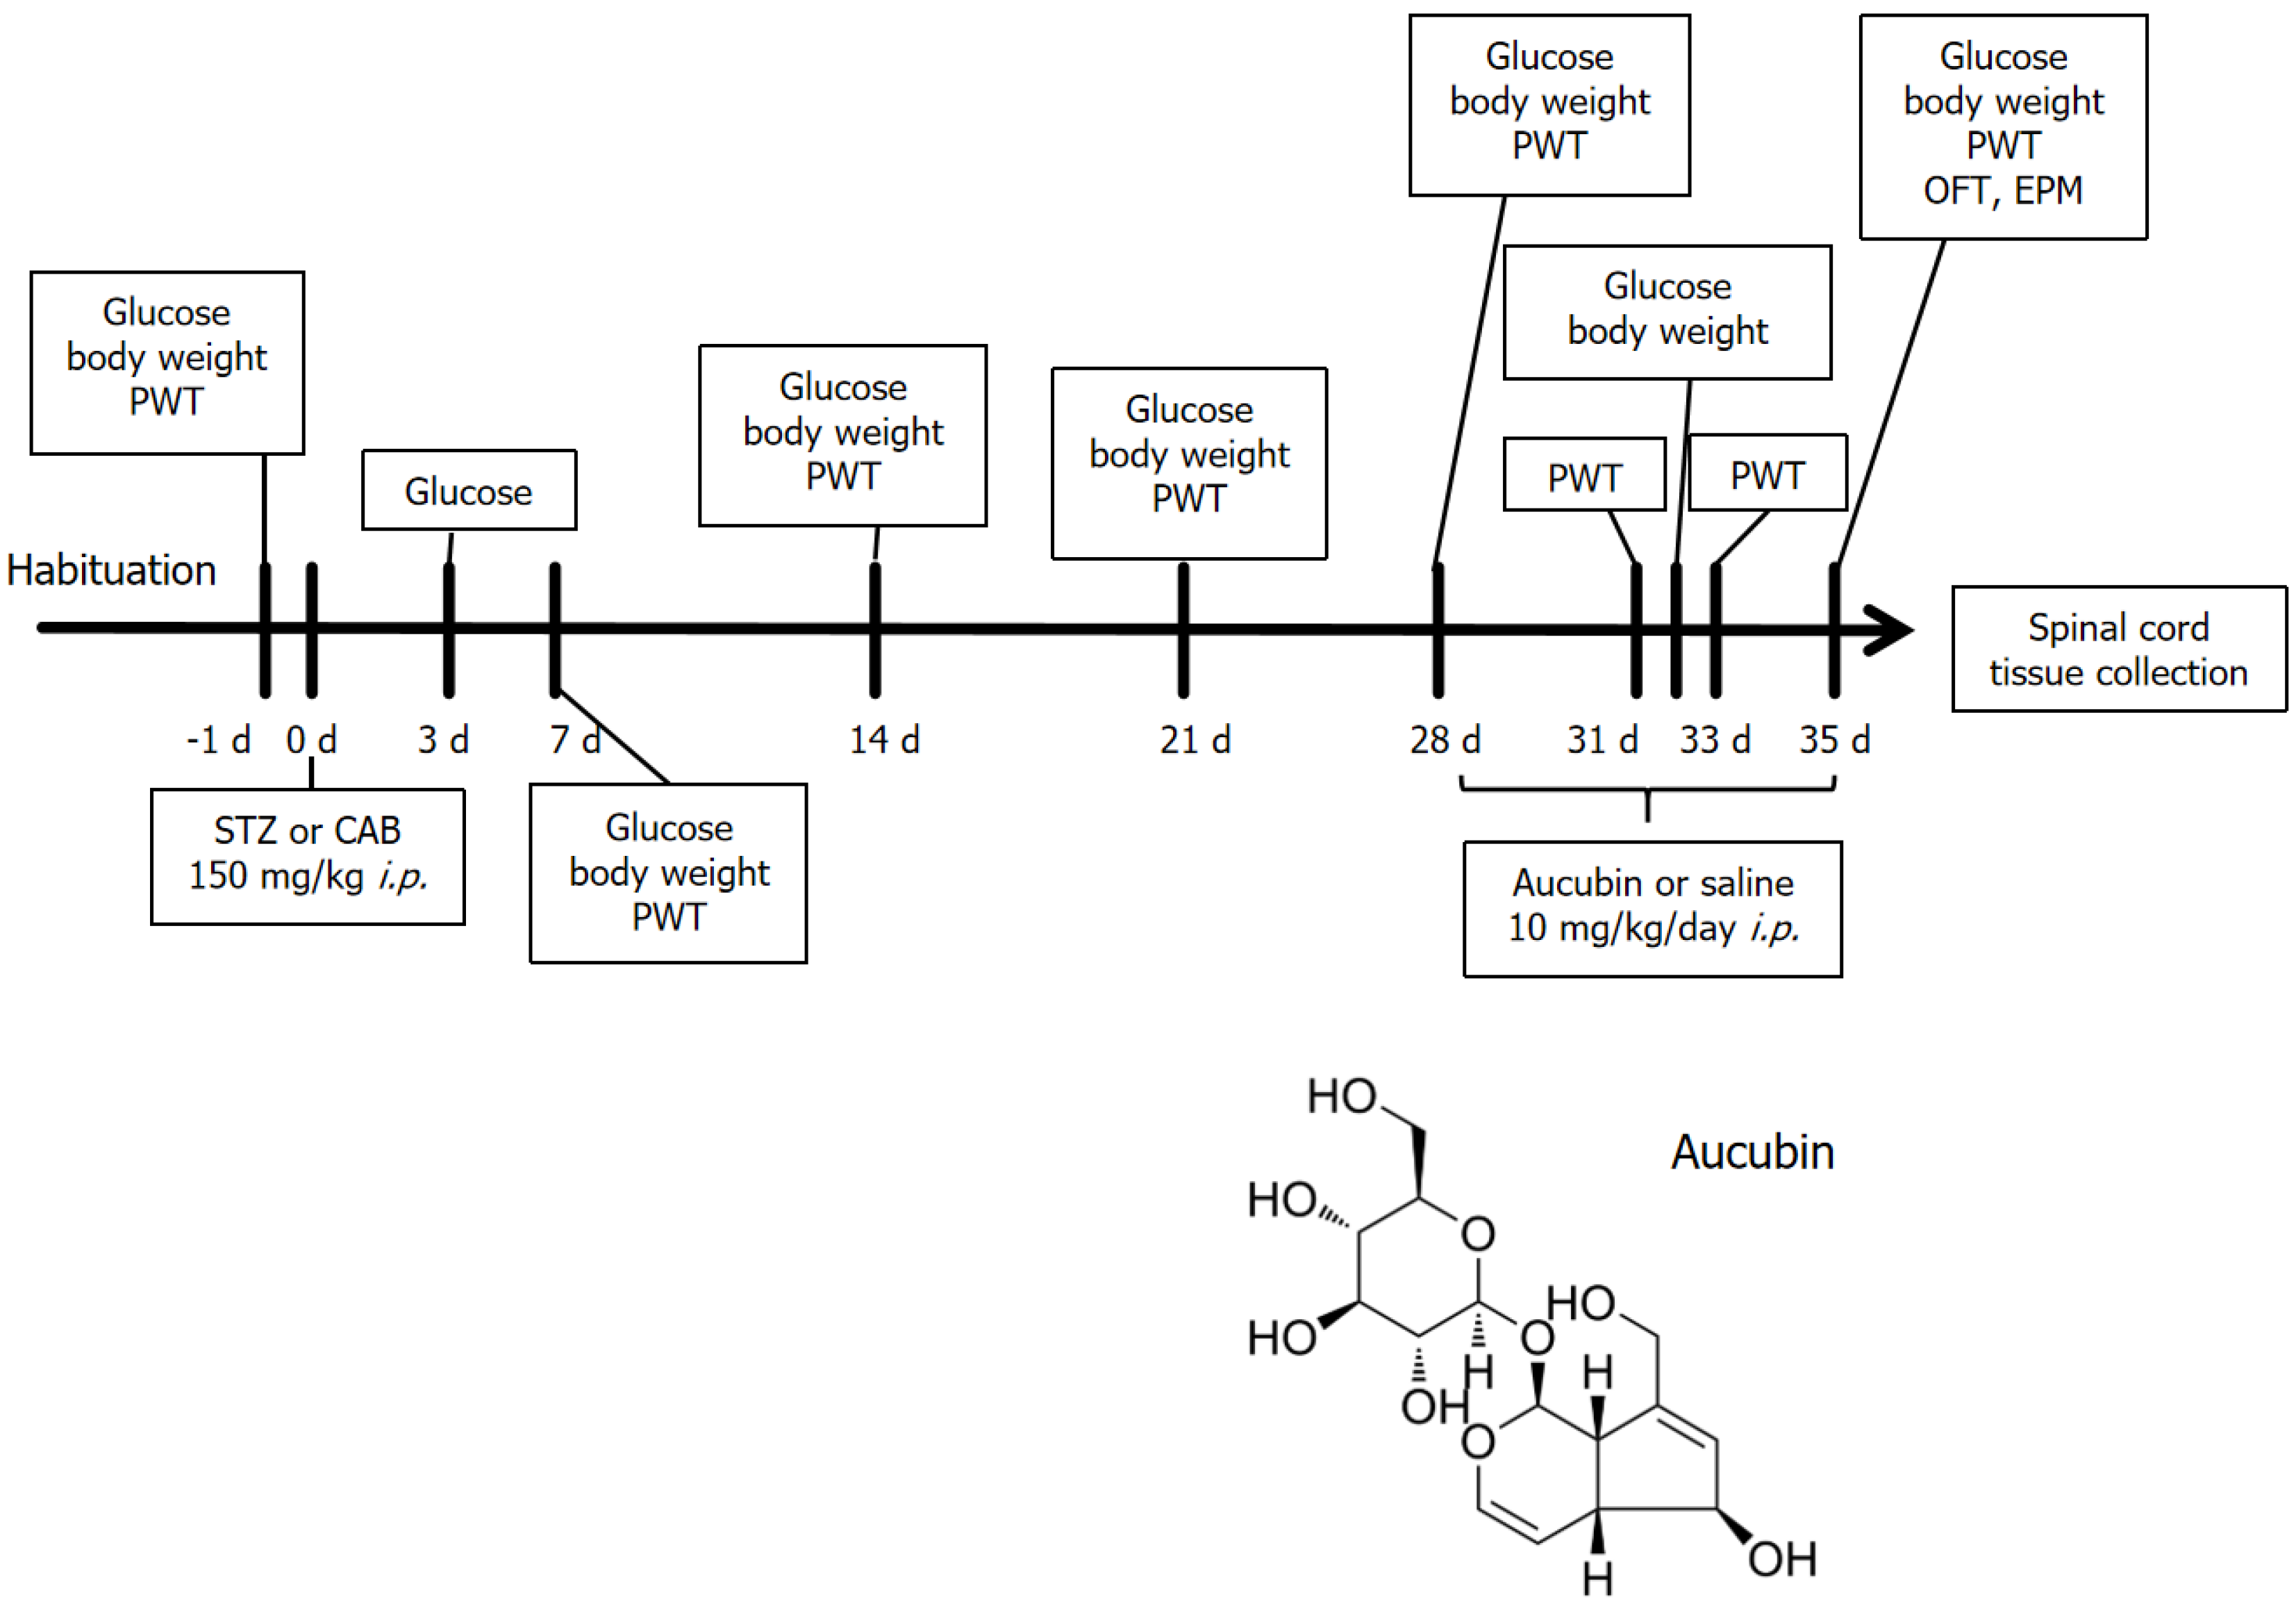
Figure 1 Schematic diagram of the experimental protocol.
PWT: Paw withdrawal threshold; STZ: Streptozotocin; CAB: Citric acid buffer; i.p.: Intraperitoneal injection; OFT: Open field test.
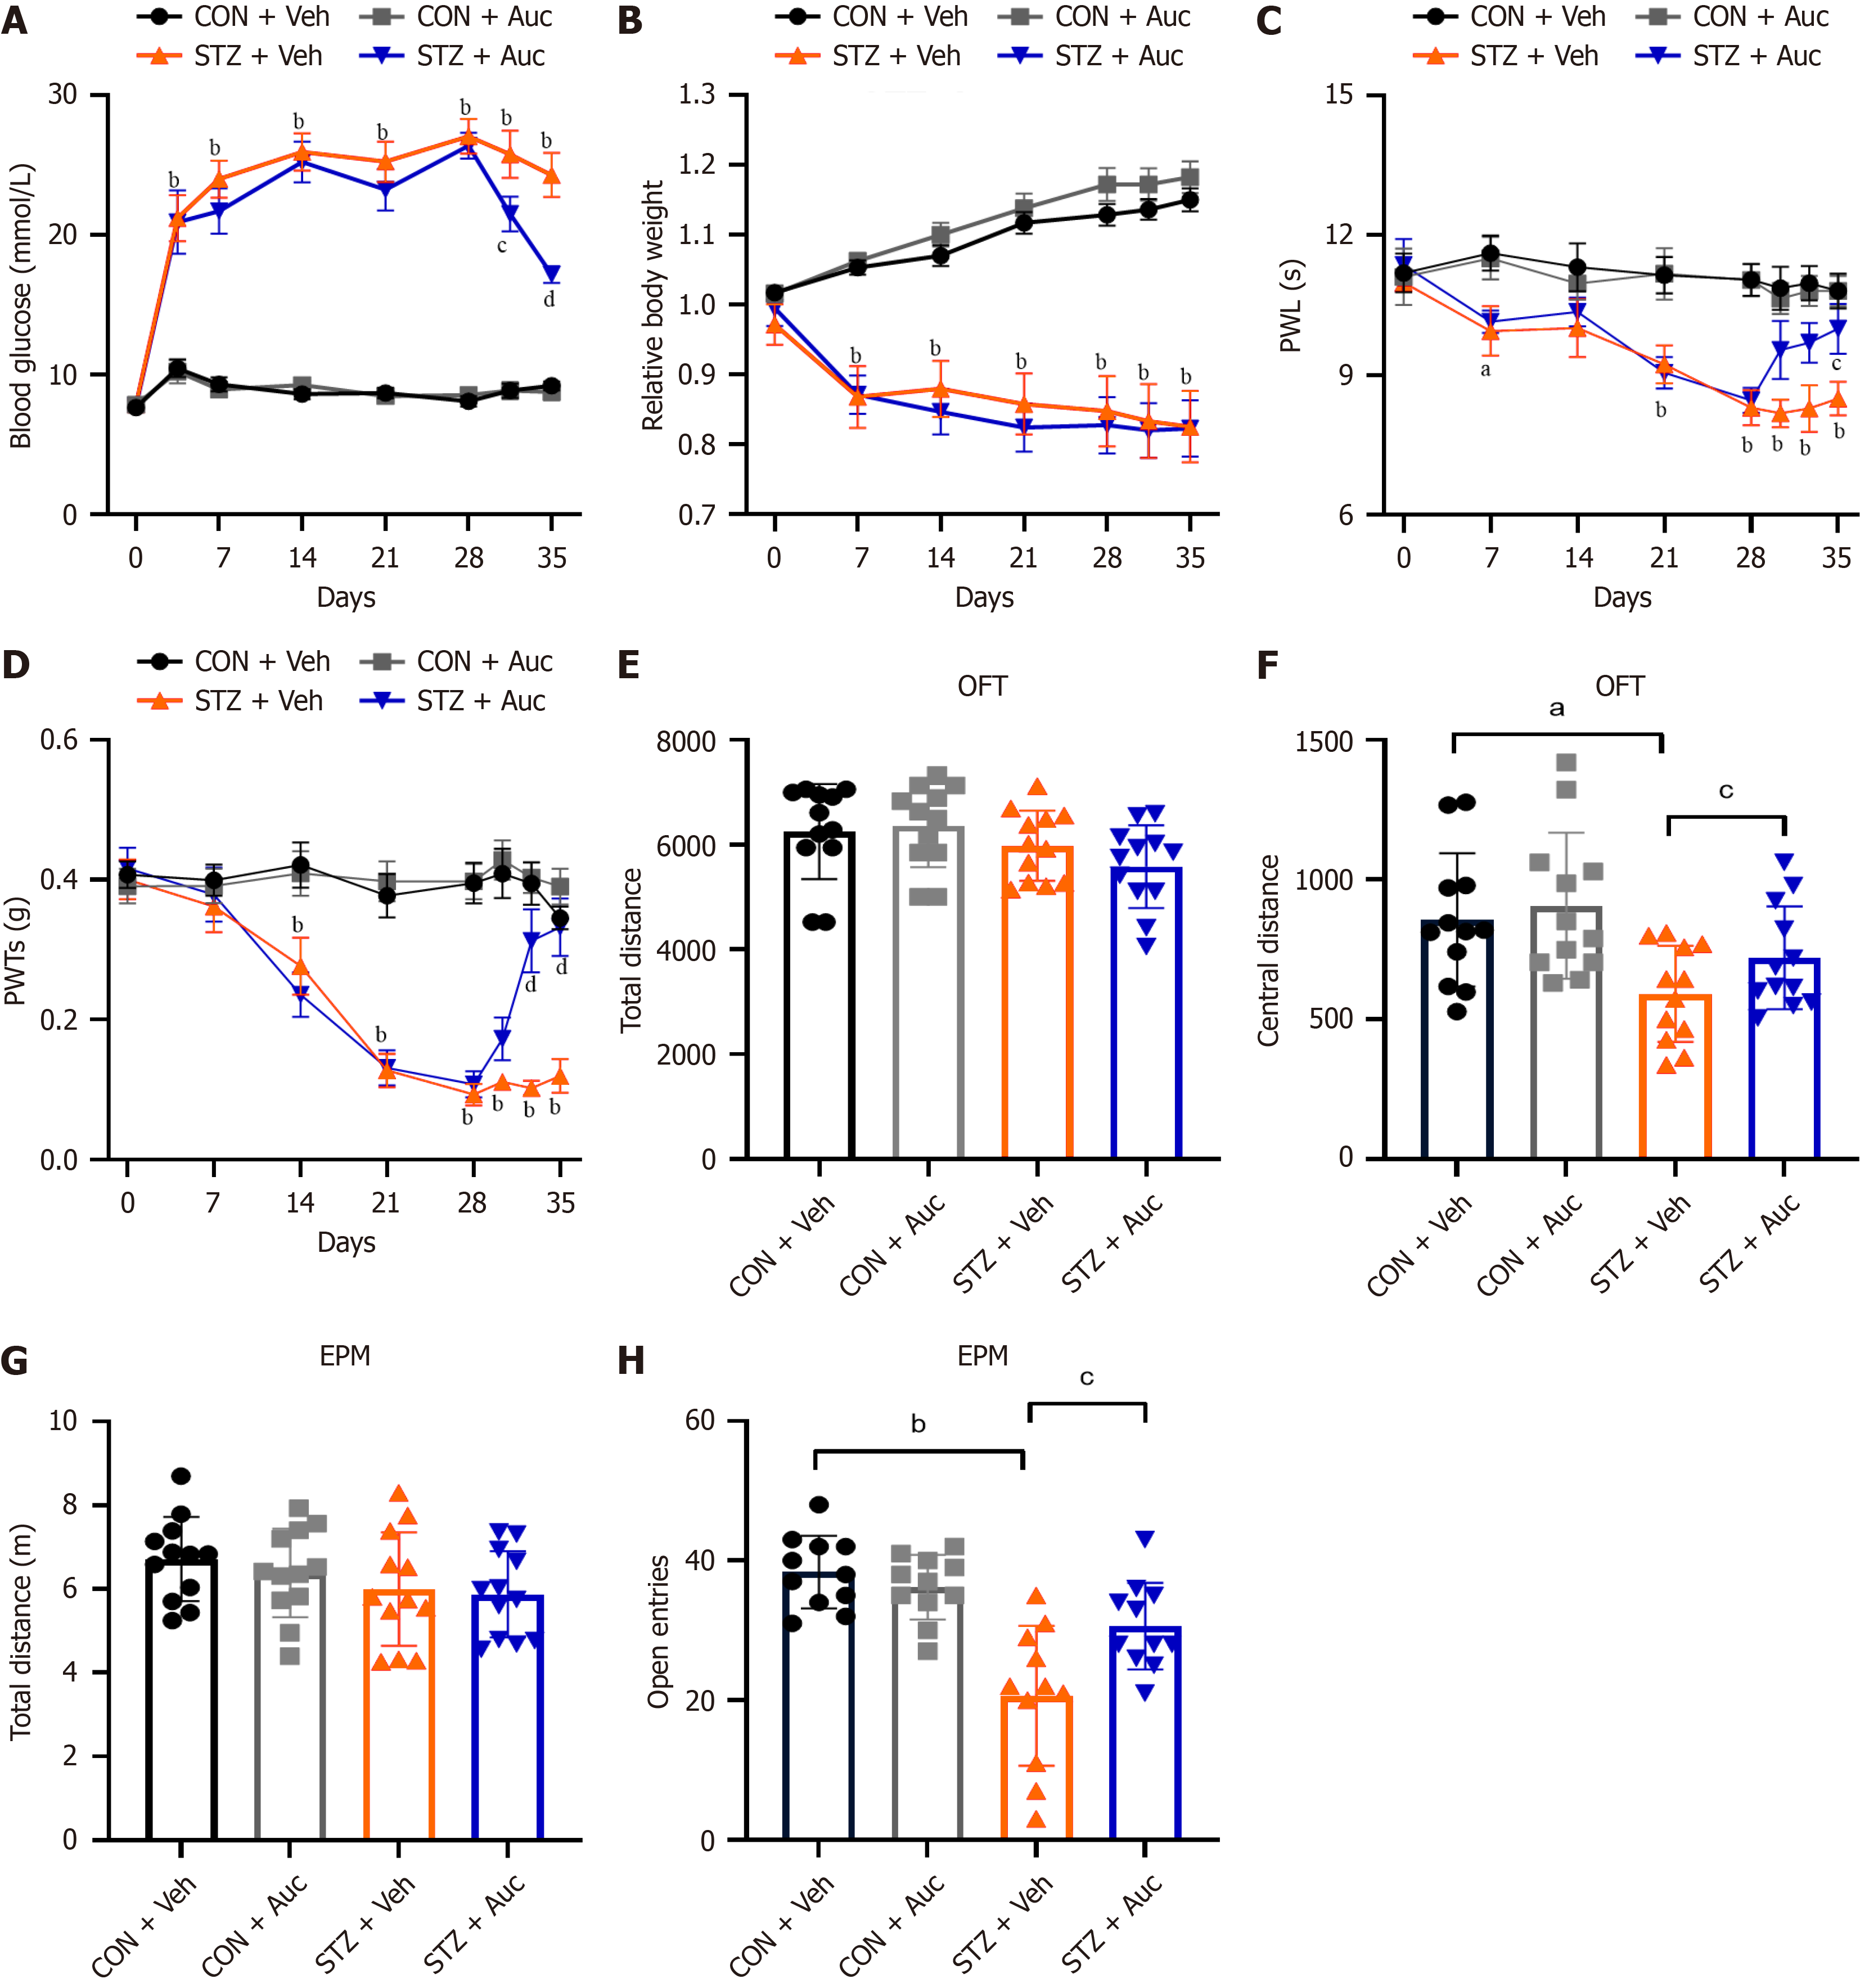
Figure 2 Aucubin alleviate streptozotocin-induced diabetic neuropathic pain and anxiety-like behavior.
A: Blood glucose level of the diabetic neuropathic pain diabetic neuropathic pain (DNP): Mice after aucubin treatment; B: Body weight of the DNP mice after aucubin treatment; C: Mechanical paw withdrawal threshold in mice; D: Thermal paw withdrawal latency in mice; E: Total distance traveled in the open field test (OFT); F: Distance traveled by mice in the central area in the OFT after streptozotocin streptozotocin (STZ): Injection; G: Total distance traveled in the elevated plus maze (EPM); H: Number of entries of mice into the open arms in the EPM after STZ injection. Data are presented as means ± SEM (n = 10). aP < 0.05, bP < 0.01 control (CON) + vehicle (Veh) vs STZ + Veh; cP < 0.05, dP < 0.01 STZ + Veh vs STZ + aucubin. CON: Control; STZ: Streptozotocin; Veh: Vehicle; Auc: Aucubin; PWT: Paw withdrawal threshold; OFT: Open field test; EPM: Elevated plus maze.
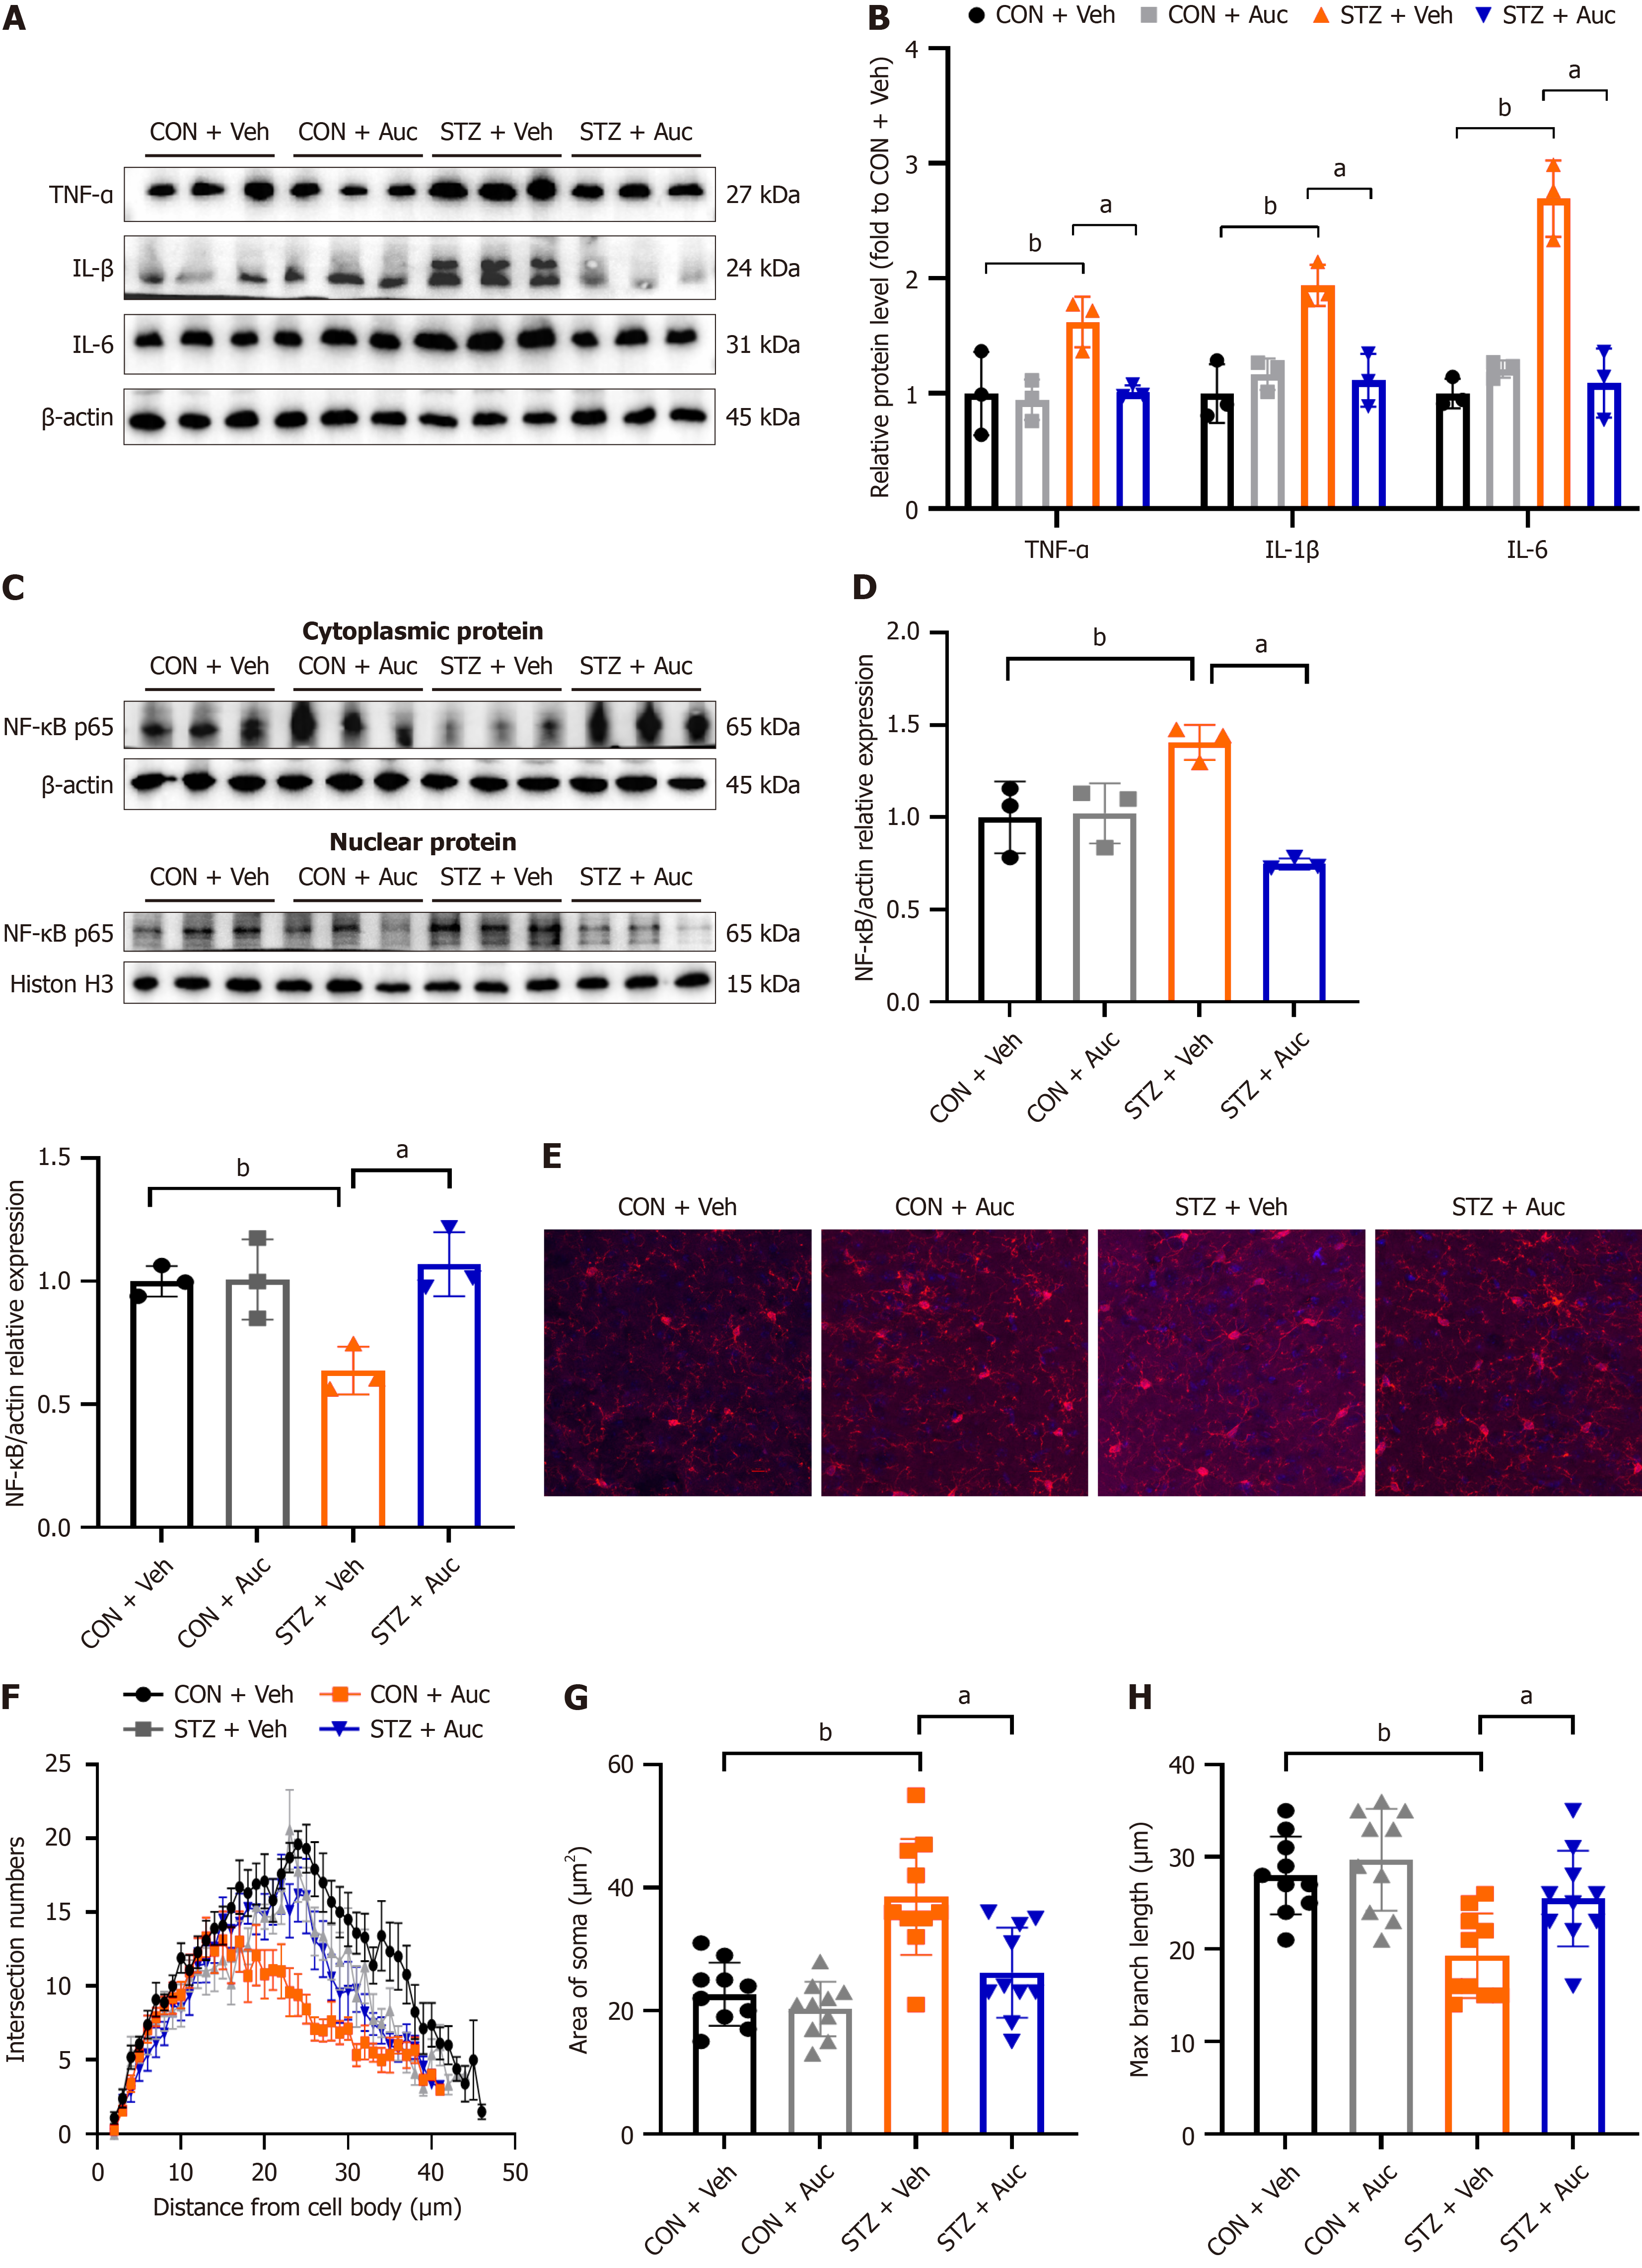
Figure 3 Aucubin releases streptozotocin-induced inflammatory responses.
A: Representative bands of tumour necrosis factor-α (TNF-α), interleukin (IL)-1β, and IL-6; B; Quantitative analysis of the relative expression of TNF-α, IL-1β, and IL-6 (n = 3); C: Representative bands of nuclear factor-κB (NF-κB) in cytoplasmic protein and nuclear protein; D: Quantitative analysis of the relative expression of NF-kappa B in cytoplasmic protein and nuclear protein (n = 3); E: Representative images of immunofluorescence of iba1; F-H: Sholl analysis of microglia of interscetion numbers (F); area of soma (G); and max branch length (H). Data are expressed as mean ± SEM. aP < 0.01 streptozotocin (STZ) + vehicle (Veh) vs STZ + aucubin; bP < 0.01 control + Veh vs STZ + Veh. CON: Control; STZ: Streptozotocin; Veh: Vehicle; Auc: Aucubin; TNF-α: Tumour necrosis factor-α; IL: Interleukin.
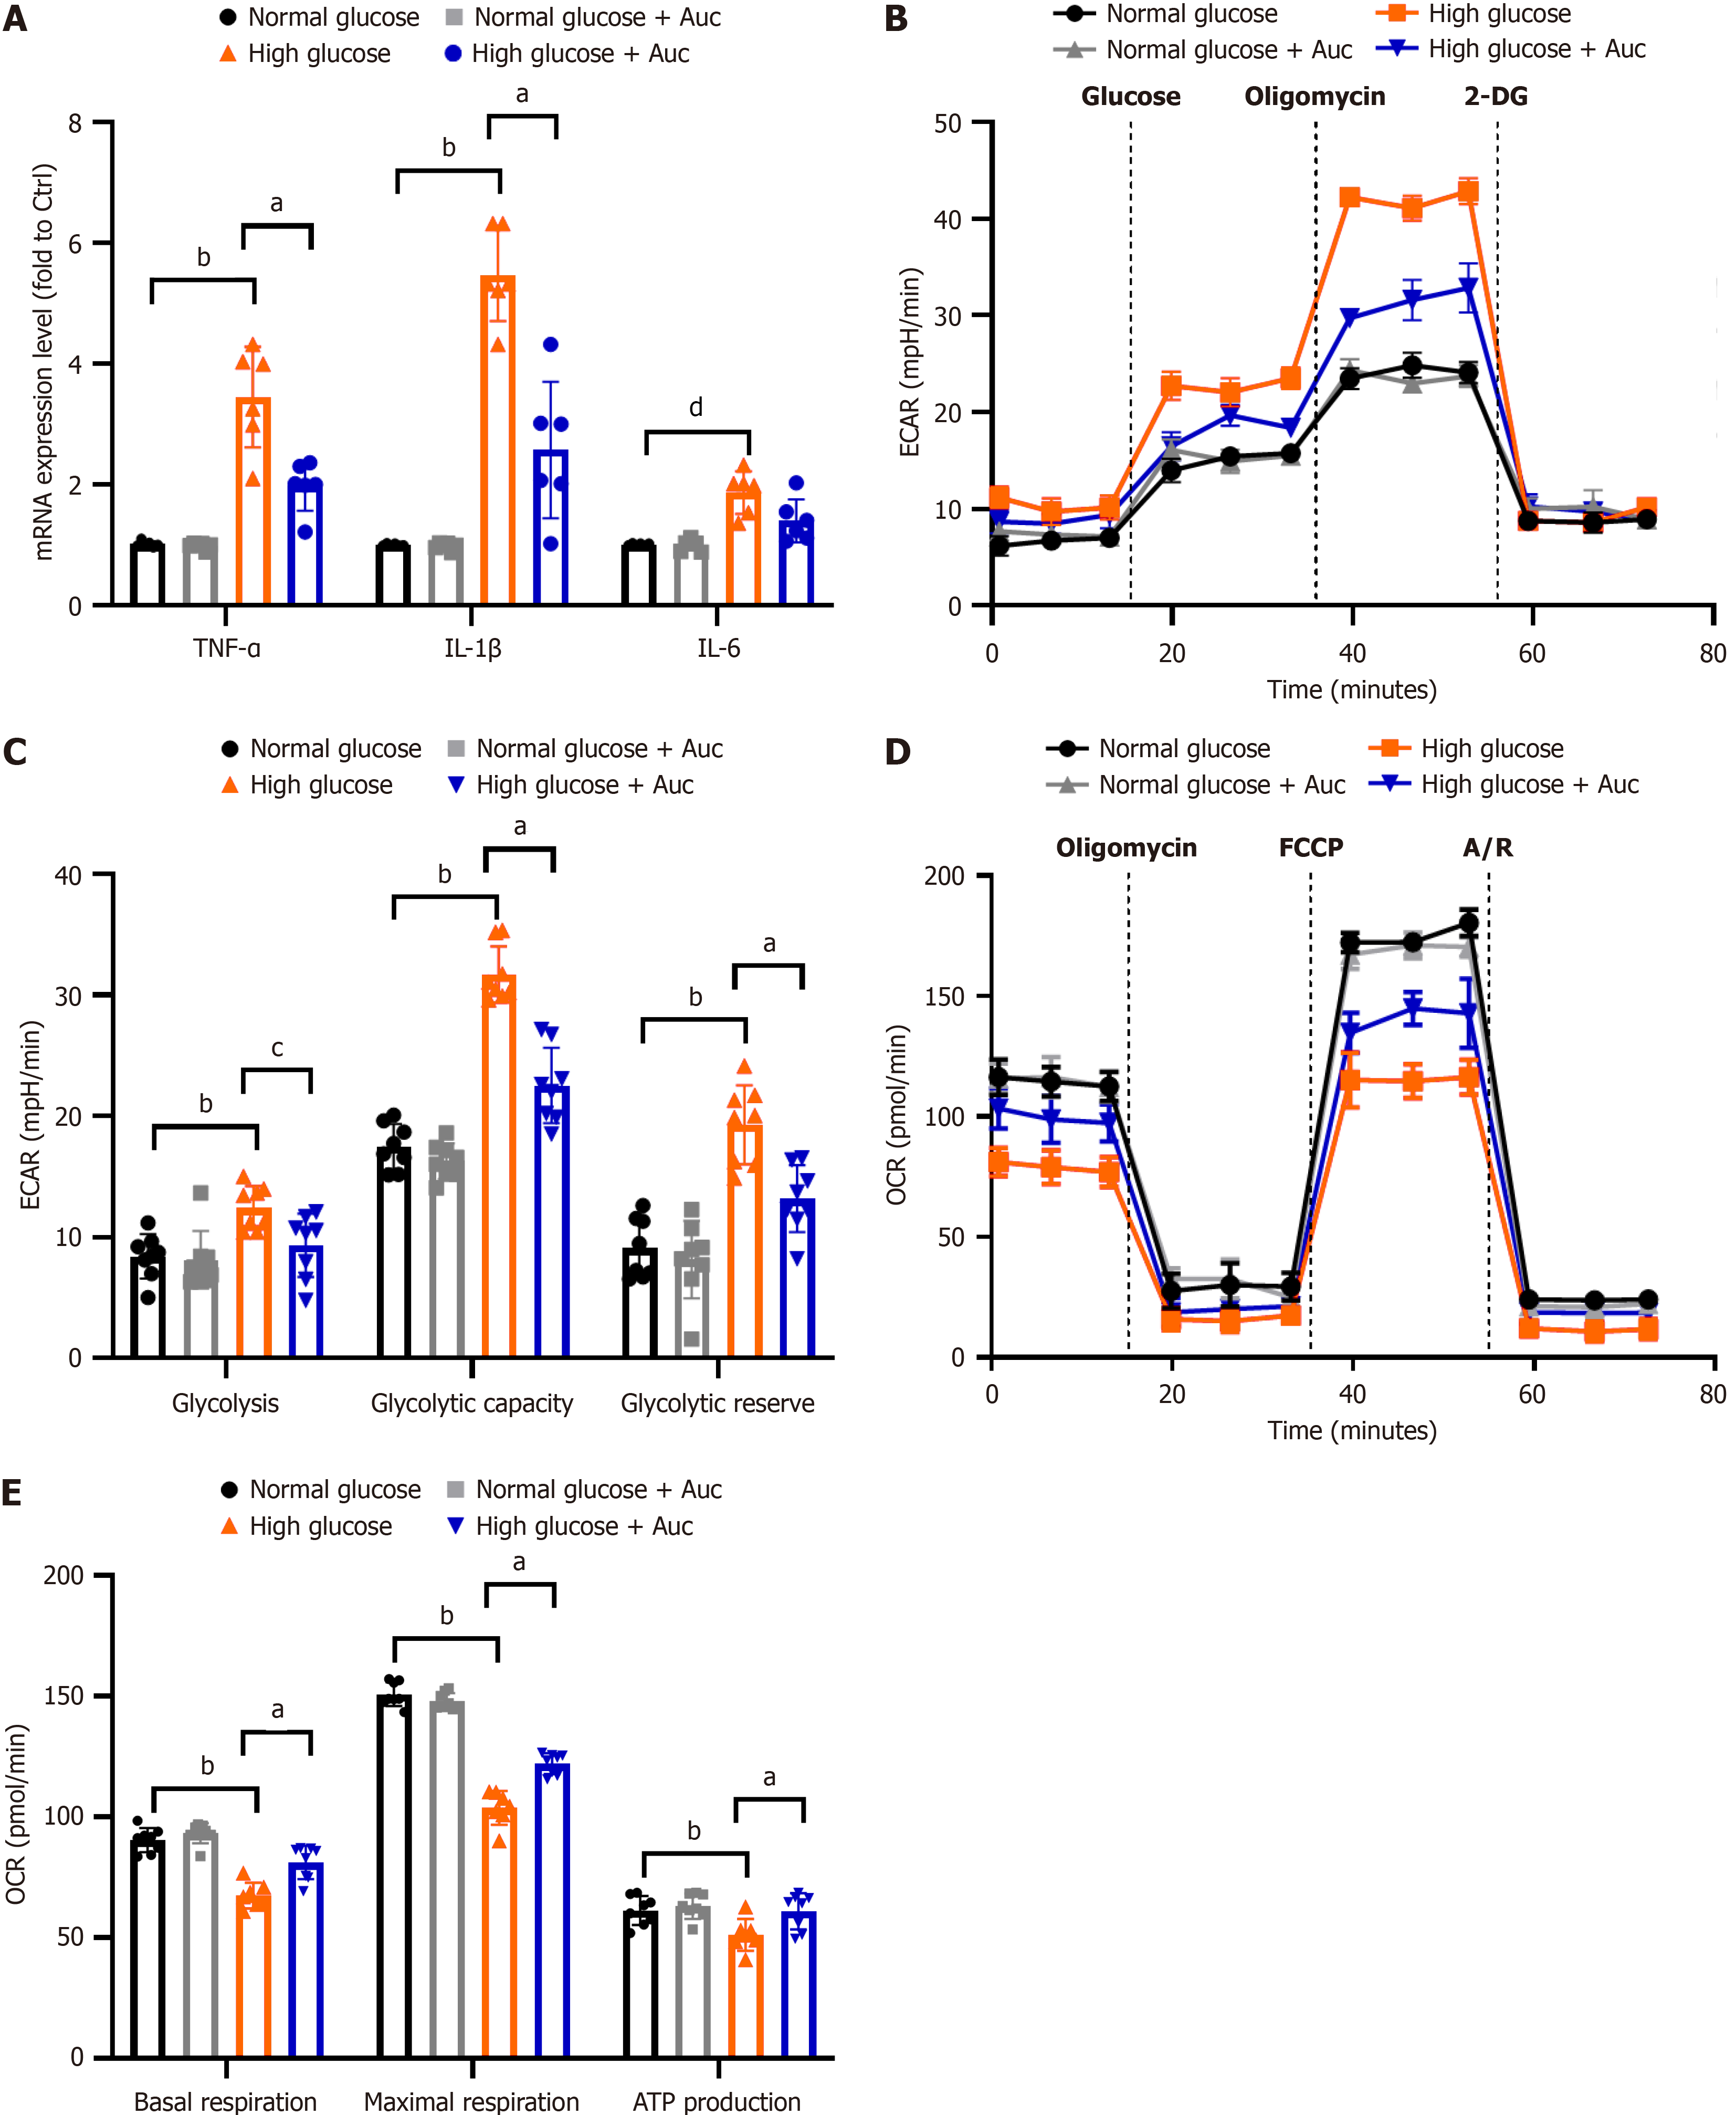
Figure 4 Aucubin reduced aerobic glycolysis and inflammation in the BV-2 cell.
A: the mRNA levels of pro-inflammatory cytokine; B-E: The experimental program of the extracellular acidification rate (B and C) and oxygen consumption rate (D and E) of BV-2 measured by Seahorse XFe96 Extracellular Flux Analyzer. Data are expressed as mean ± SEM. n = 6. aP < 0.01 high glucose vs high glucose + auccubin (Auc); bP < 0.01 normal glucose vs high glucose; cP < 0.05 high glucose vs high glucose + Auc; dP < 0.05 normal glucose vs high glucose. ECAR: Extracellular acidification rate; 2-DG: 2-deoxy-d-glucose; OCR: Oxygen consumption rate; FCCP: Carbonyl cyanide-p-trifluoromethoxyphenylhydrazone; Auc: Aucubin; TNF-α: Tumour necrosis factor-α; IL: Interleukin.
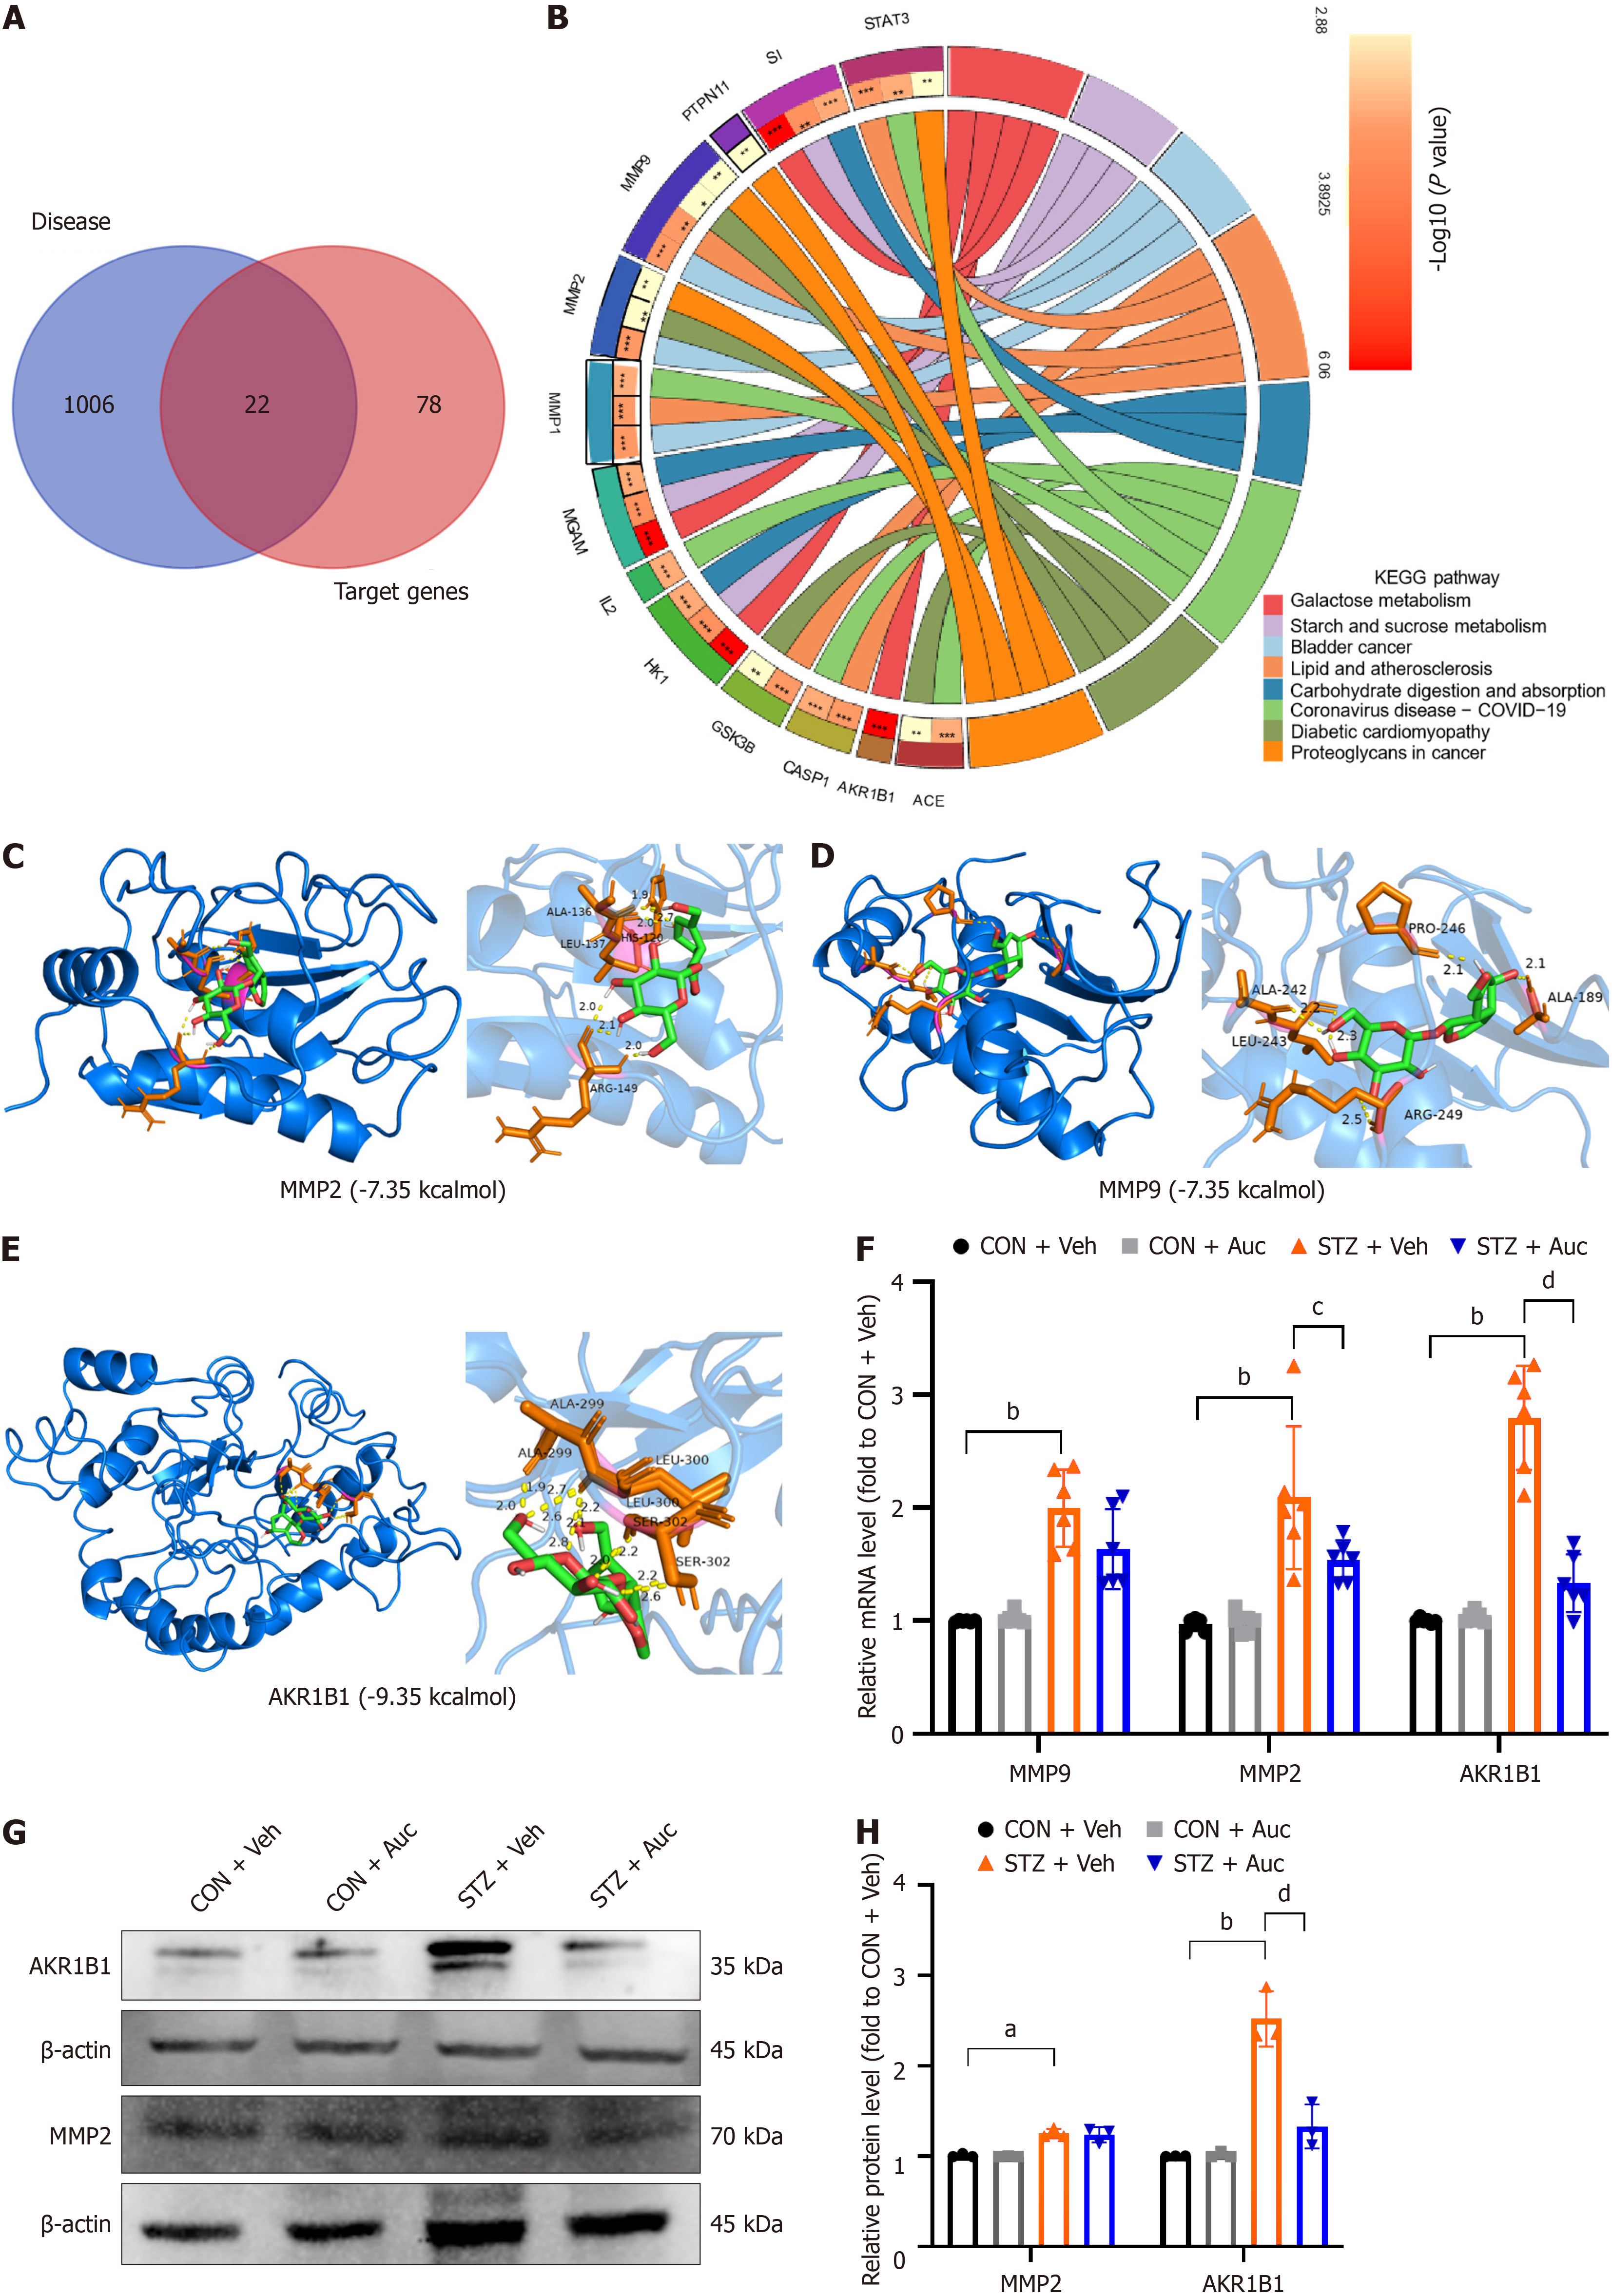
Figure 5 The potential target proteins of aucubin on the diabetic neuropathic pain.
A: Venn diagram showing the potential target genes for aucubin in treating diabetic neuropathic pain; B: Kyoto Encyclopedia of Genes and Genomes pathway analysis of the potential target genes; C-E: Molecular docking between the target 3 proteins (MMP2, MMP9, and AKR1B1) and aucubin (Auc) conducted using Auto Dock Tool 1.5.7; F: mRNA levels of MMP9, MMP2, and AKR1B1 in mice after streptozotocin (STZ) and Auc treatment. (n = 6); G: Representative bands of Western blot for MMP2 and AKR1B1 in mice after STZ and Auc treatment; H: Quantitative analysis of the relative expression of MMP2 and AKR1B1 (n = 3). Data are expressed as mean ± SEM. aP < 0.05, bP < 0.01 CON + vehicle (Veh) vs STZ + Veh; cP < 0.05, dP < 0.01 STZ +Veh vs STZ + Auc. CON: Control; STZ: Streptozotocin; Auc: Aucubin; Veh: Vehicle.
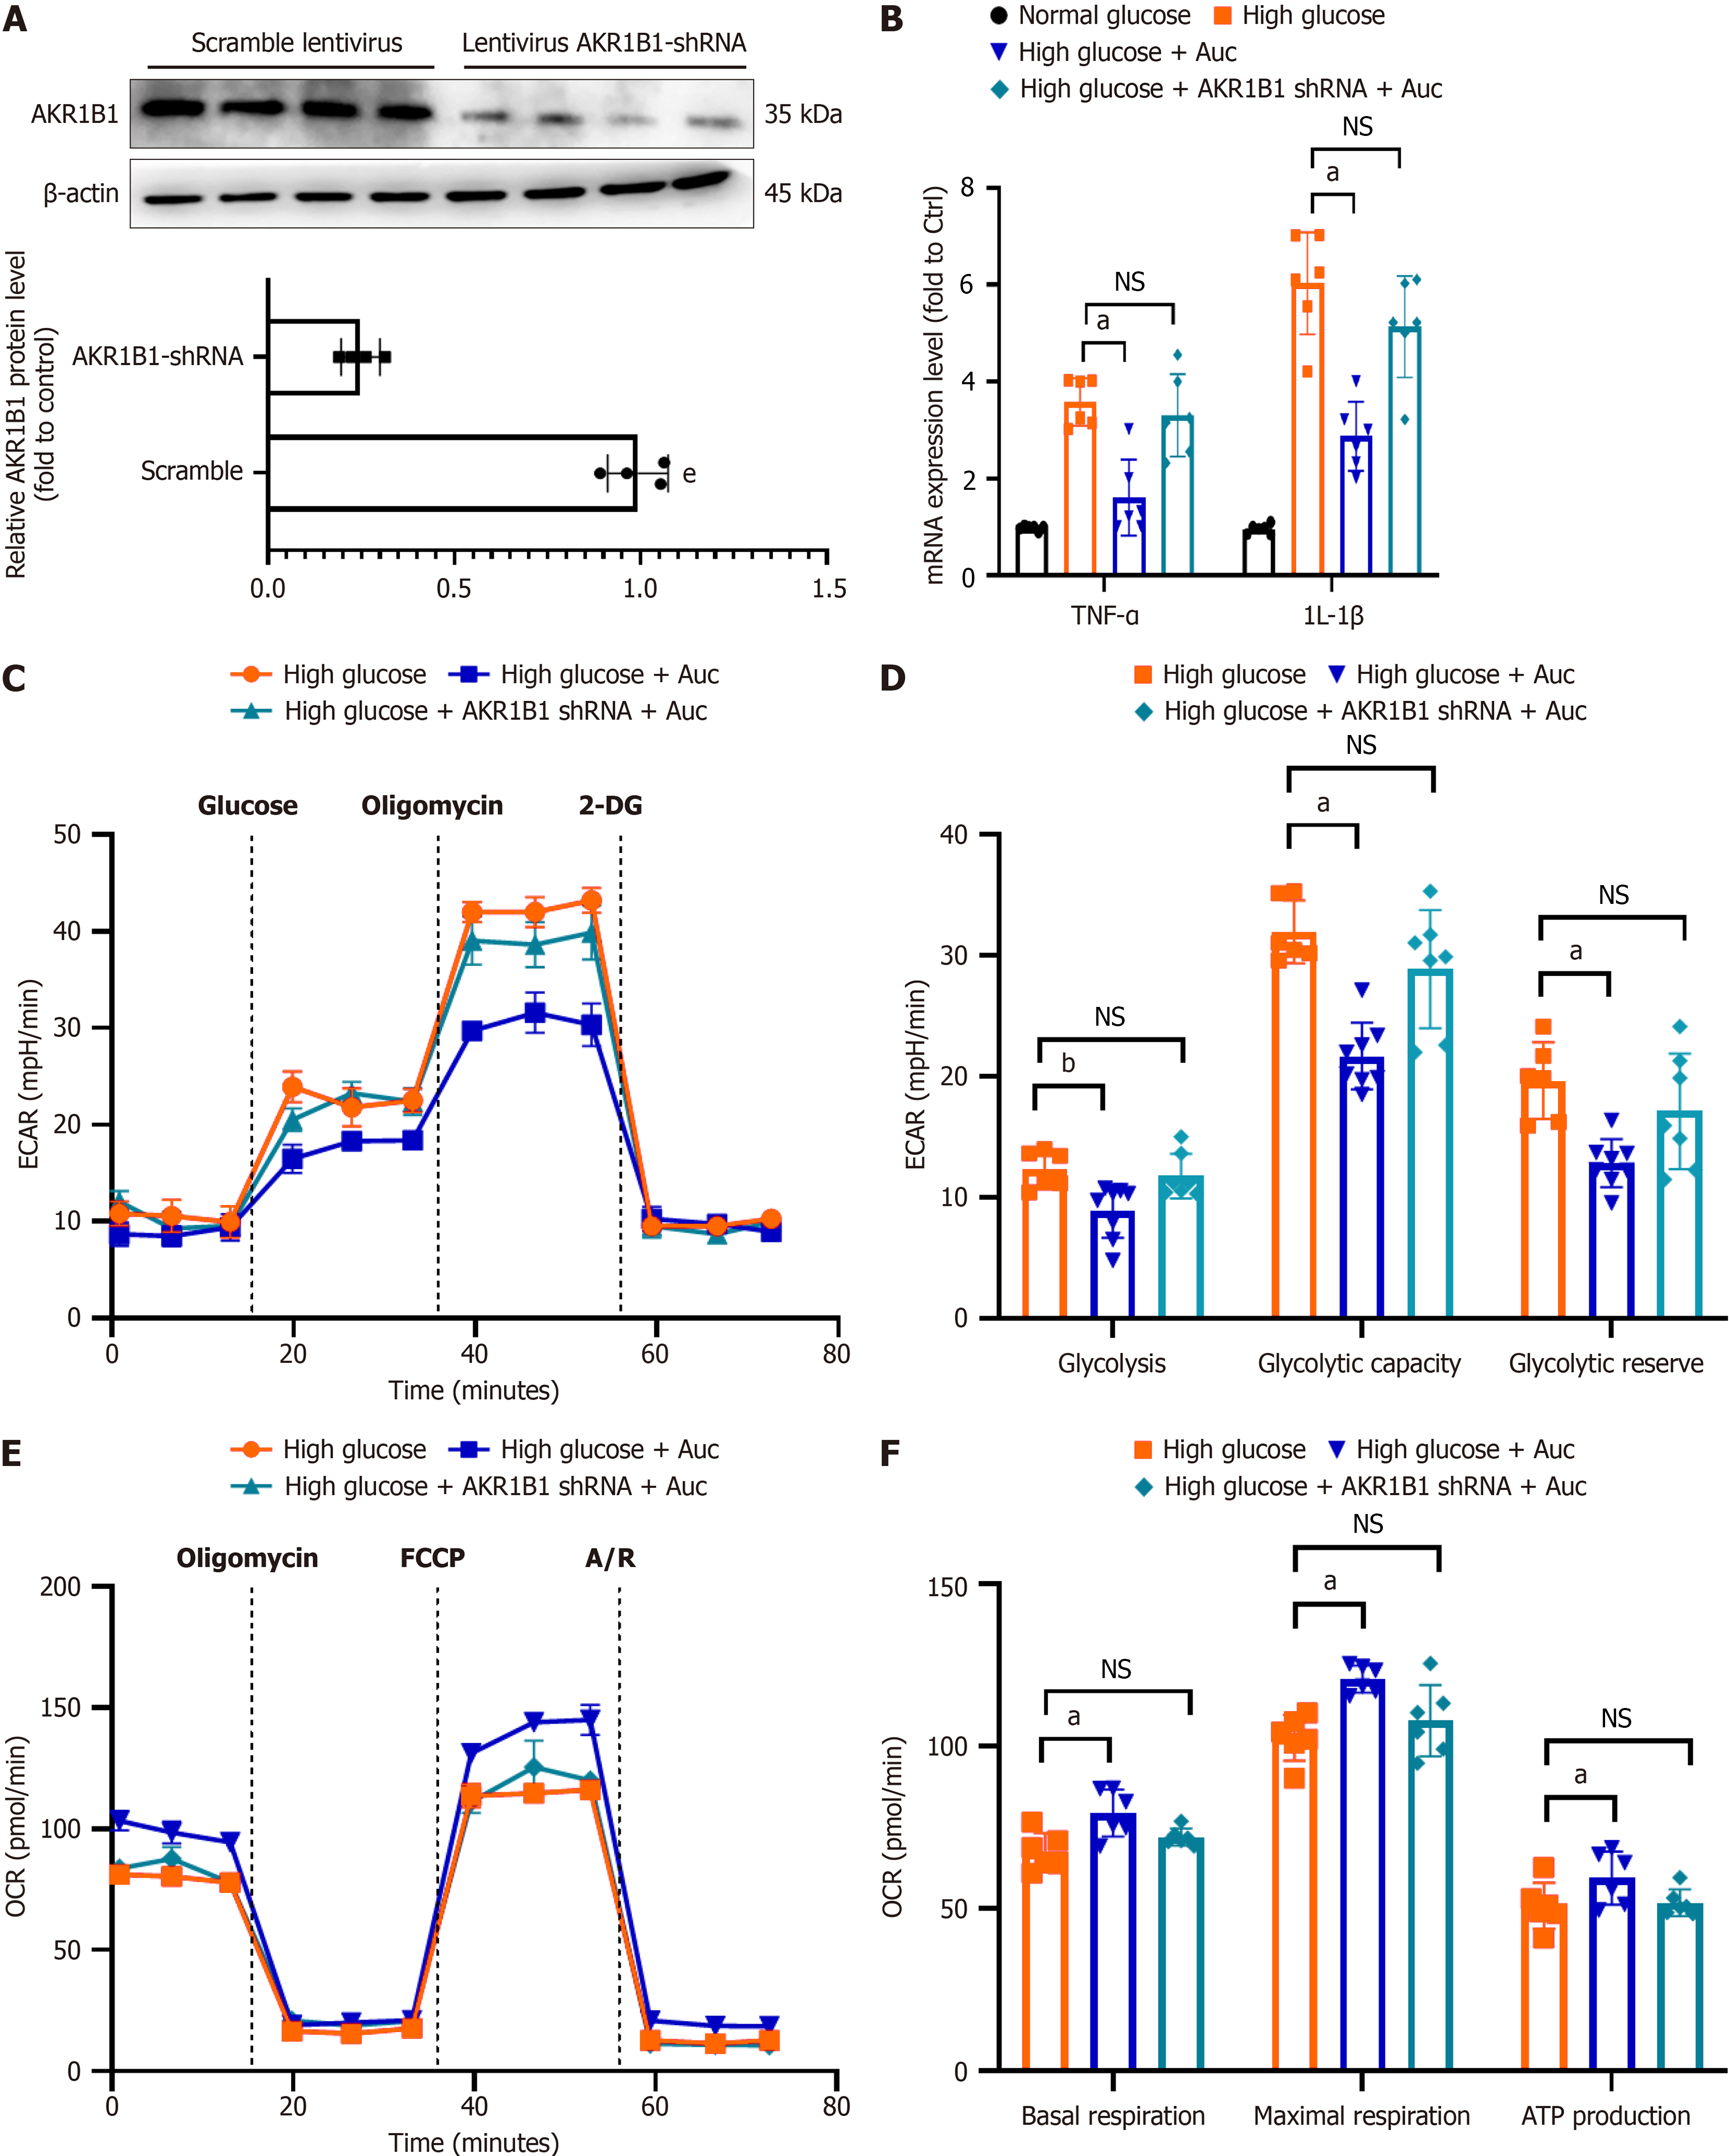
Figure 6 Aucubin fails to restore aerobic glycolysis and inflammation in the context of AKR1B1 deficiency.
A: The expression level of AKR1B1 after transfecting AKR1B1 shRNA lentivirus. The quantitative analysis of the relative expression of AKR1B1 below. Data are expressed as mean ± SEM (n = 4); B: The mRNA levels of pro-inflammatory cytokine; C-F: The experimental program of extracellular acidification rate (C and D) and the oxygen consumption rate (E and F) of BV-2 measured by Seahorse XFe96 Extracellular Flux Analyzer. Data are expressed as mean ± SEM (n = 6). aP < 0.01, bP < 0.05, high glucose vs high glucose + aucubin. NS: No significance; Auc: Aucubin; 2-DG: 2-deoxy-d-glucose; ECAR: Extracellular acidification rate; OCR: Oxygen consumption rate.
- Citation: Zheng XZ, Yu HY, Chen YR, Fang JS. Aucubin mitigates the elevation of microglial aerobic glycolysis and inflammation in diabetic neuropathic pain via aldose reductase. World J Diabetes 2025; 16(5): 103915
- URL: https://www.wjgnet.com/1948-9358/full/v16/i5/103915.htm
- DOI: https://dx.doi.org/10.4239/wjd.v16.i5.103915


