Copyright
©The Author(s) 2025.
World J Diabetes. May 15, 2025; 16(5): 103602
Published online May 15, 2025. doi: 10.4239/wjd.v16.i5.103602
Published online May 15, 2025. doi: 10.4239/wjd.v16.i5.103602
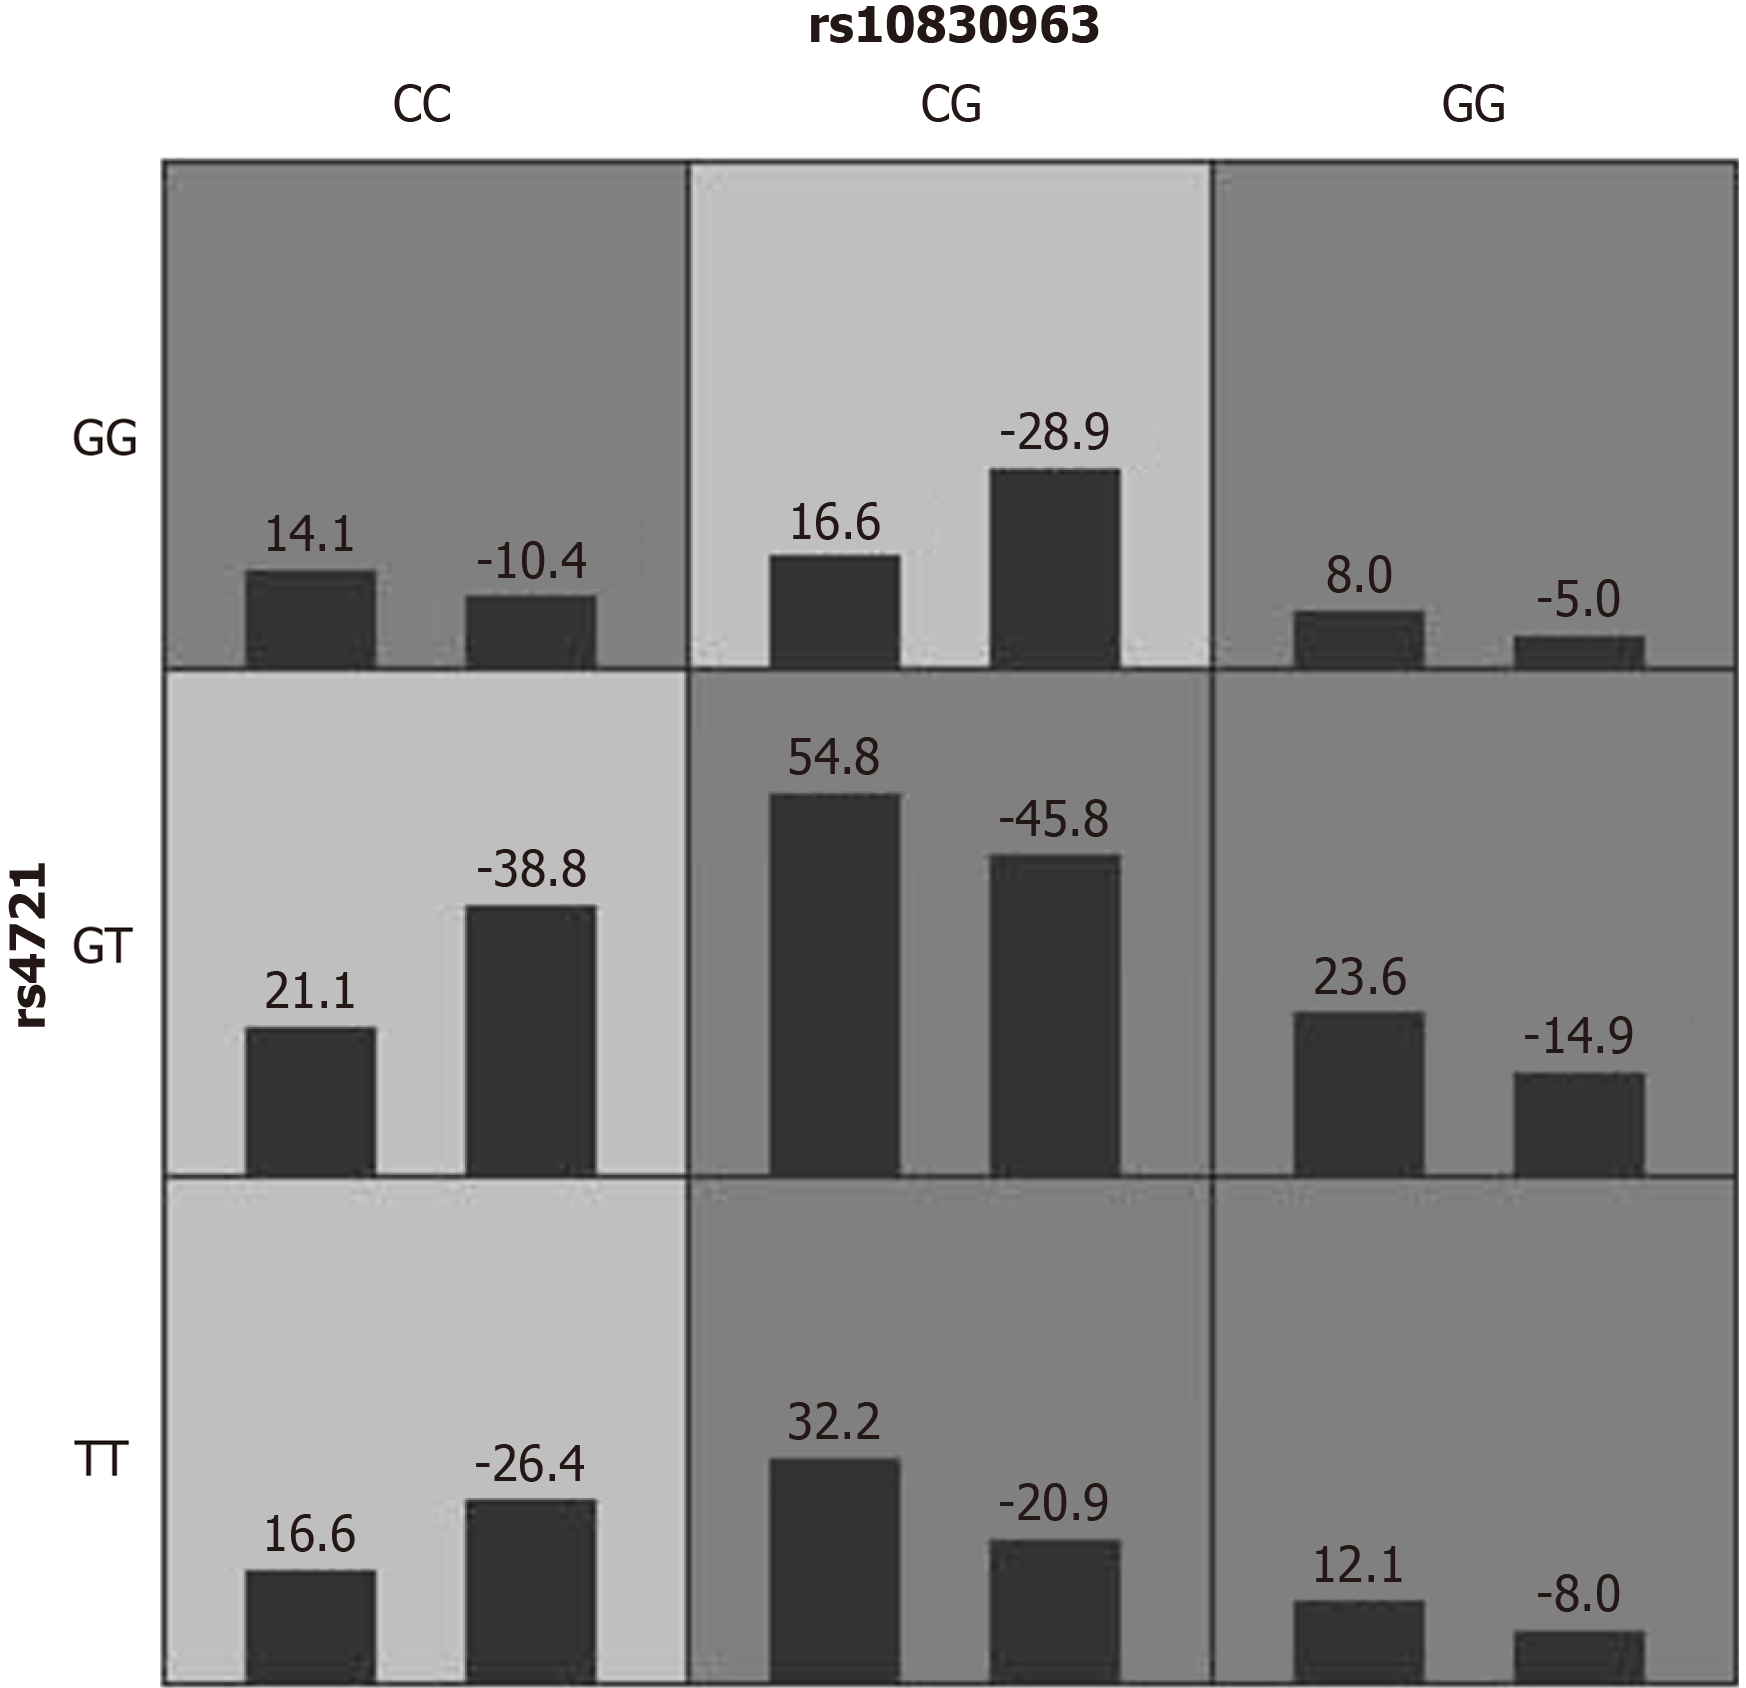
Figure 1 Two-site risk model of rs10830963 × rs4721.
Light-colored grids represent the low-risk type, in which the positive score was less than the negative score. The dark-colored grids are the high-risk type, in which the positive score was greater than the negative score. CC × GT, CC × TT, and CG × GG were defined as low-risk types, and CC × GG, CG × GT, CG × TT, GG × GG, GG × GT, GG × TT were defined as high-risk types.
- Citation: Zheng TT, Liu JH, Huang WT, Hong B, Wang D, Liu CY, Zhang J, Li SS, Wu SW, Wang Q, Chen L, Jin L. Single-nucleotide polymorphisms in genes involved in folate metabolism or selected other metabolites and risk for gestational diabetes mellitus. World J Diabetes 2025; 16(5): 103602
- URL: https://www.wjgnet.com/1948-9358/full/v16/i5/103602.htm
- DOI: https://dx.doi.org/10.4239/wjd.v16.i5.103602


