Copyright
©The Author(s) 2025.
World J Diabetes. May 15, 2025; 16(5): 103403
Published online May 15, 2025. doi: 10.4239/wjd.v16.i5.103403
Published online May 15, 2025. doi: 10.4239/wjd.v16.i5.103403
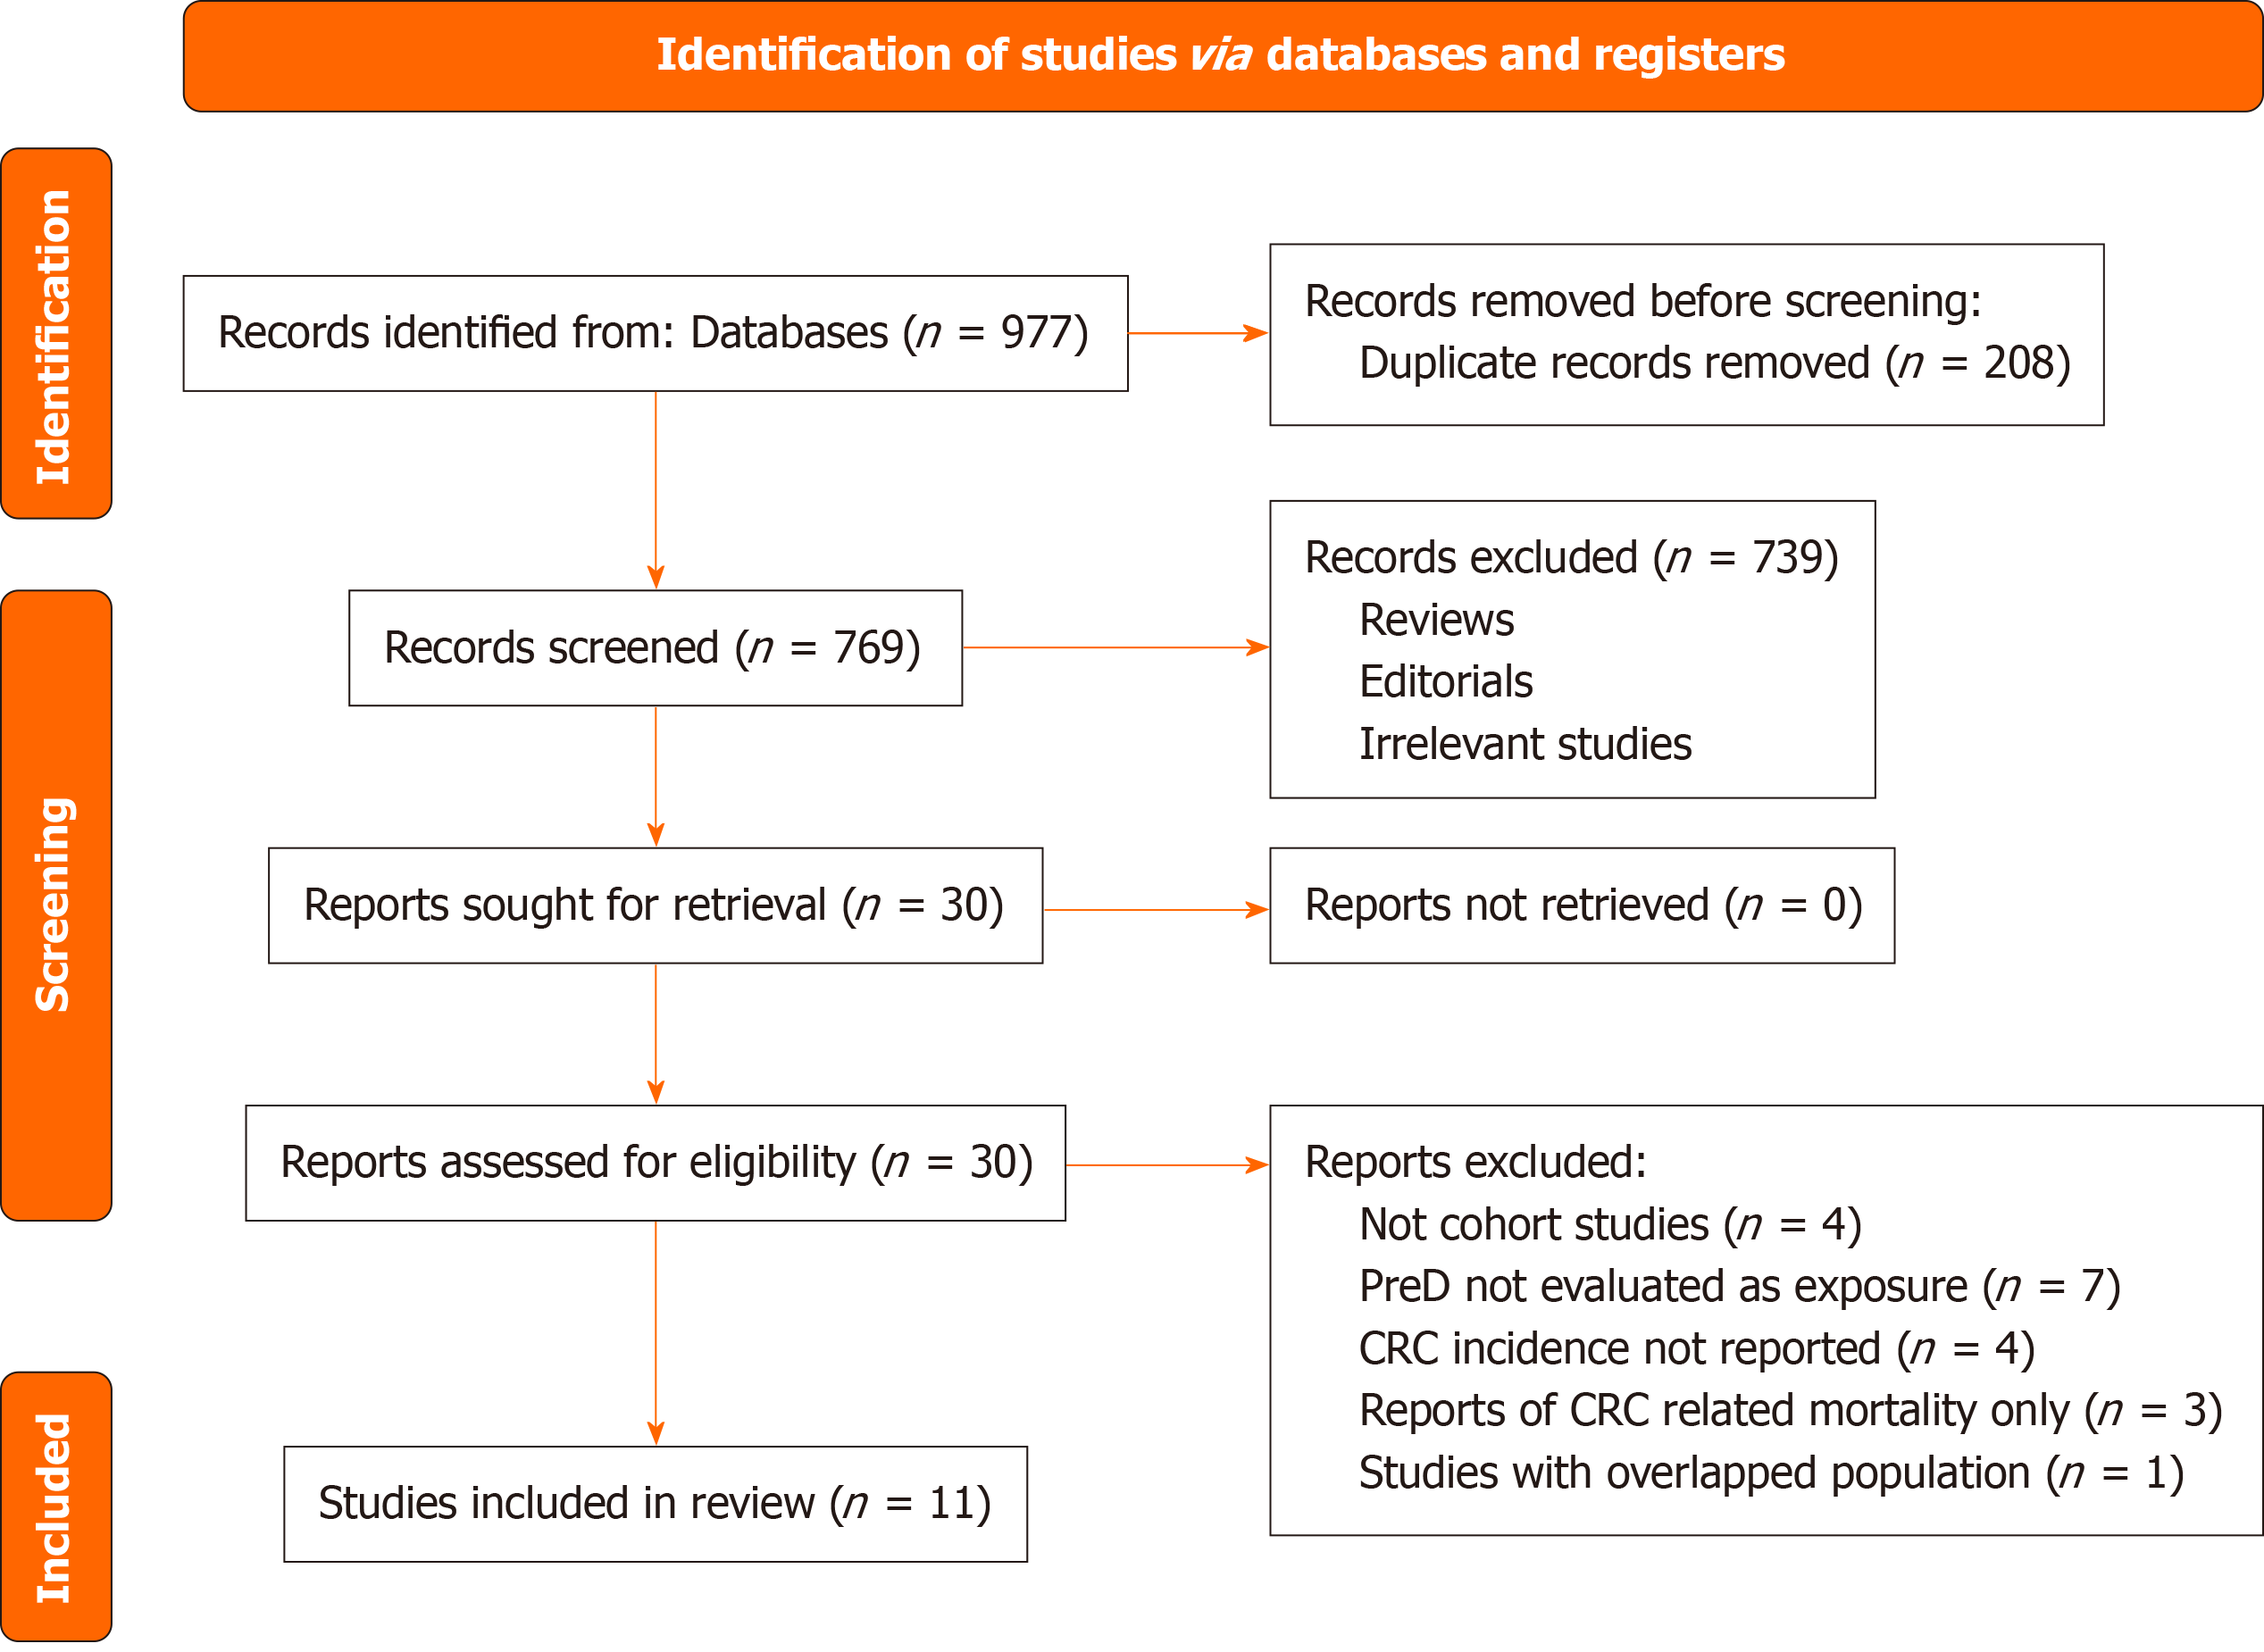
Figure 1 The flowchart depicts the process of database search and study inclusion.
CRC: Colorectal cancer.
Figure 2 Forest plots of the subgroup analyses of the association between prediabetes and the risk of colorectal cancer.
A: Overall subgroup analysis; B: Subgroup analysis according to study design; C: Subgroup analysis according to the study country; D: Subgroup analysis according to mean age of the participants; E: Subgroup analysis according to the sex of the participants; F: Subgroup analysis according to the definition of prediabetes; G: Subgroup analysis according to the mean follow-up duration; H: Subgroup analysis according to adjustment for body mass index or waist circumference. CI: Confidence interval.
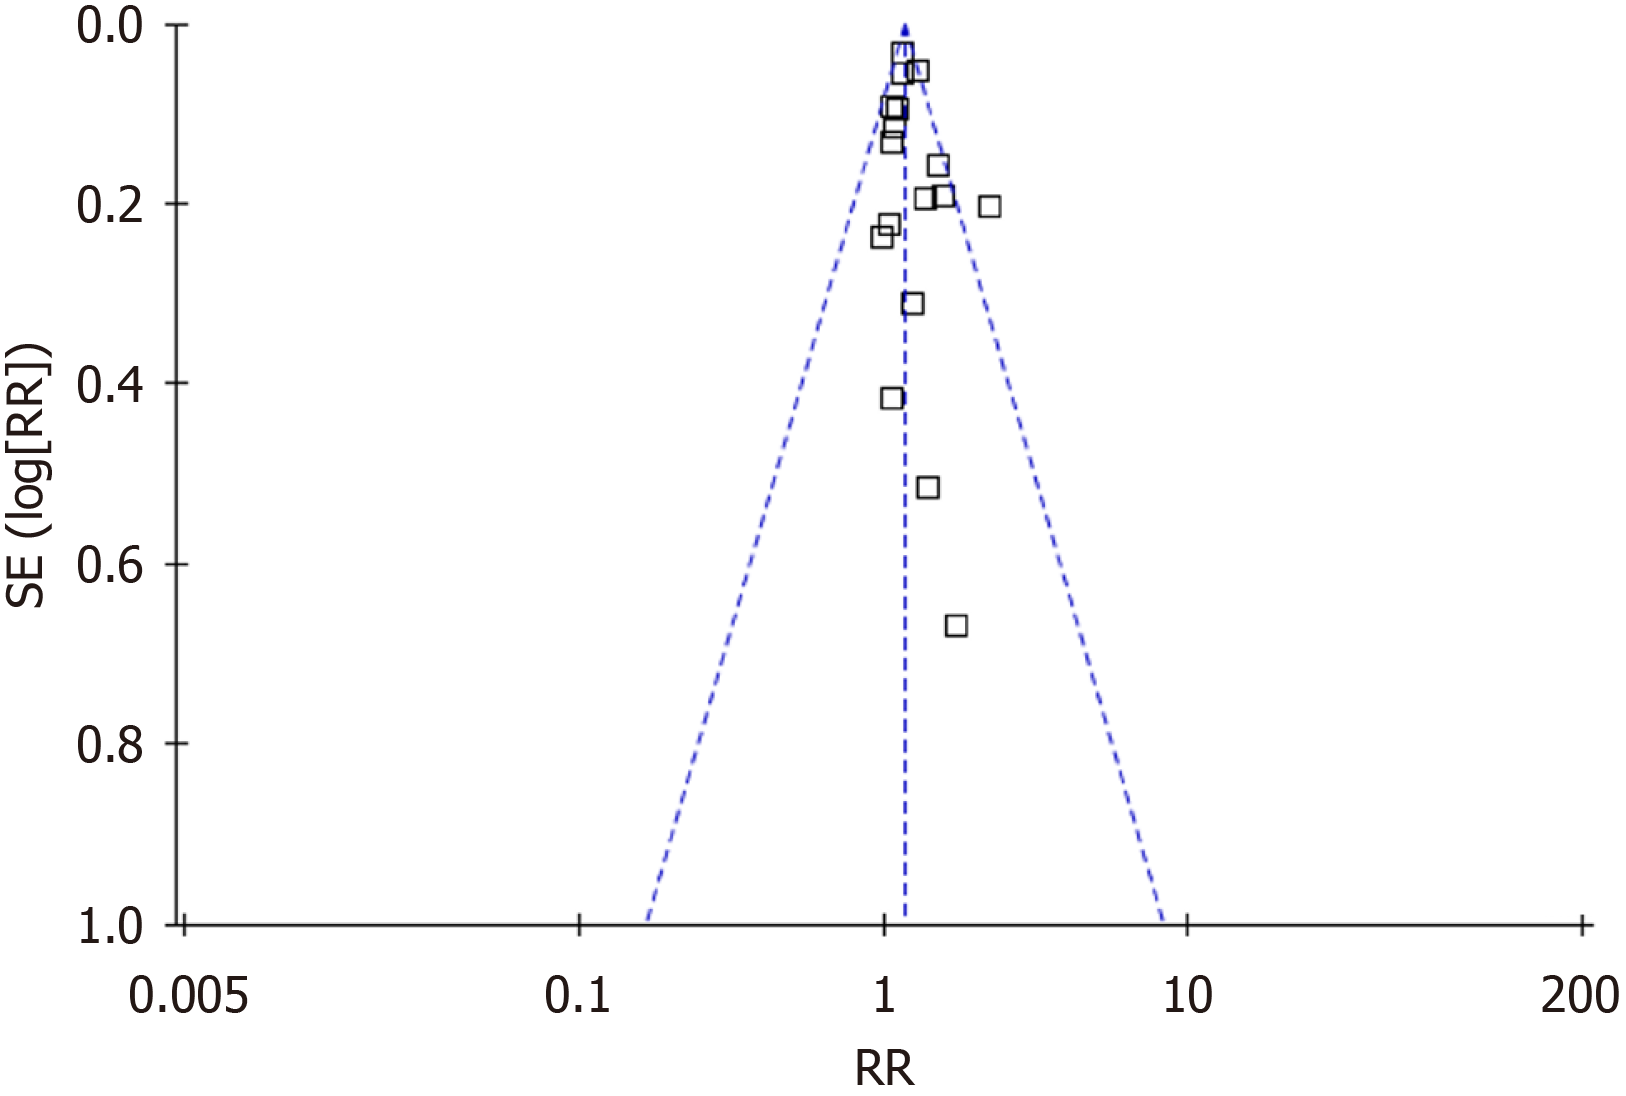
Figure 3 Funnel plots of the association between prediabetes and the risk of colorectal cancer.
RR: Risk ratio.
- Citation: Wang N, Zhao TY, Ma X. Increased colorectal cancer risk in prediabetes: A meta-analysis. World J Diabetes 2025; 16(5): 103403
- URL: https://www.wjgnet.com/1948-9358/full/v16/i5/103403.htm
- DOI: https://dx.doi.org/10.4239/wjd.v16.i5.103403


