Copyright
©The Author(s) 2025.
World J Diabetes. May 15, 2025; 16(5): 102196
Published online May 15, 2025. doi: 10.4239/wjd.v16.i5.102196
Published online May 15, 2025. doi: 10.4239/wjd.v16.i5.102196
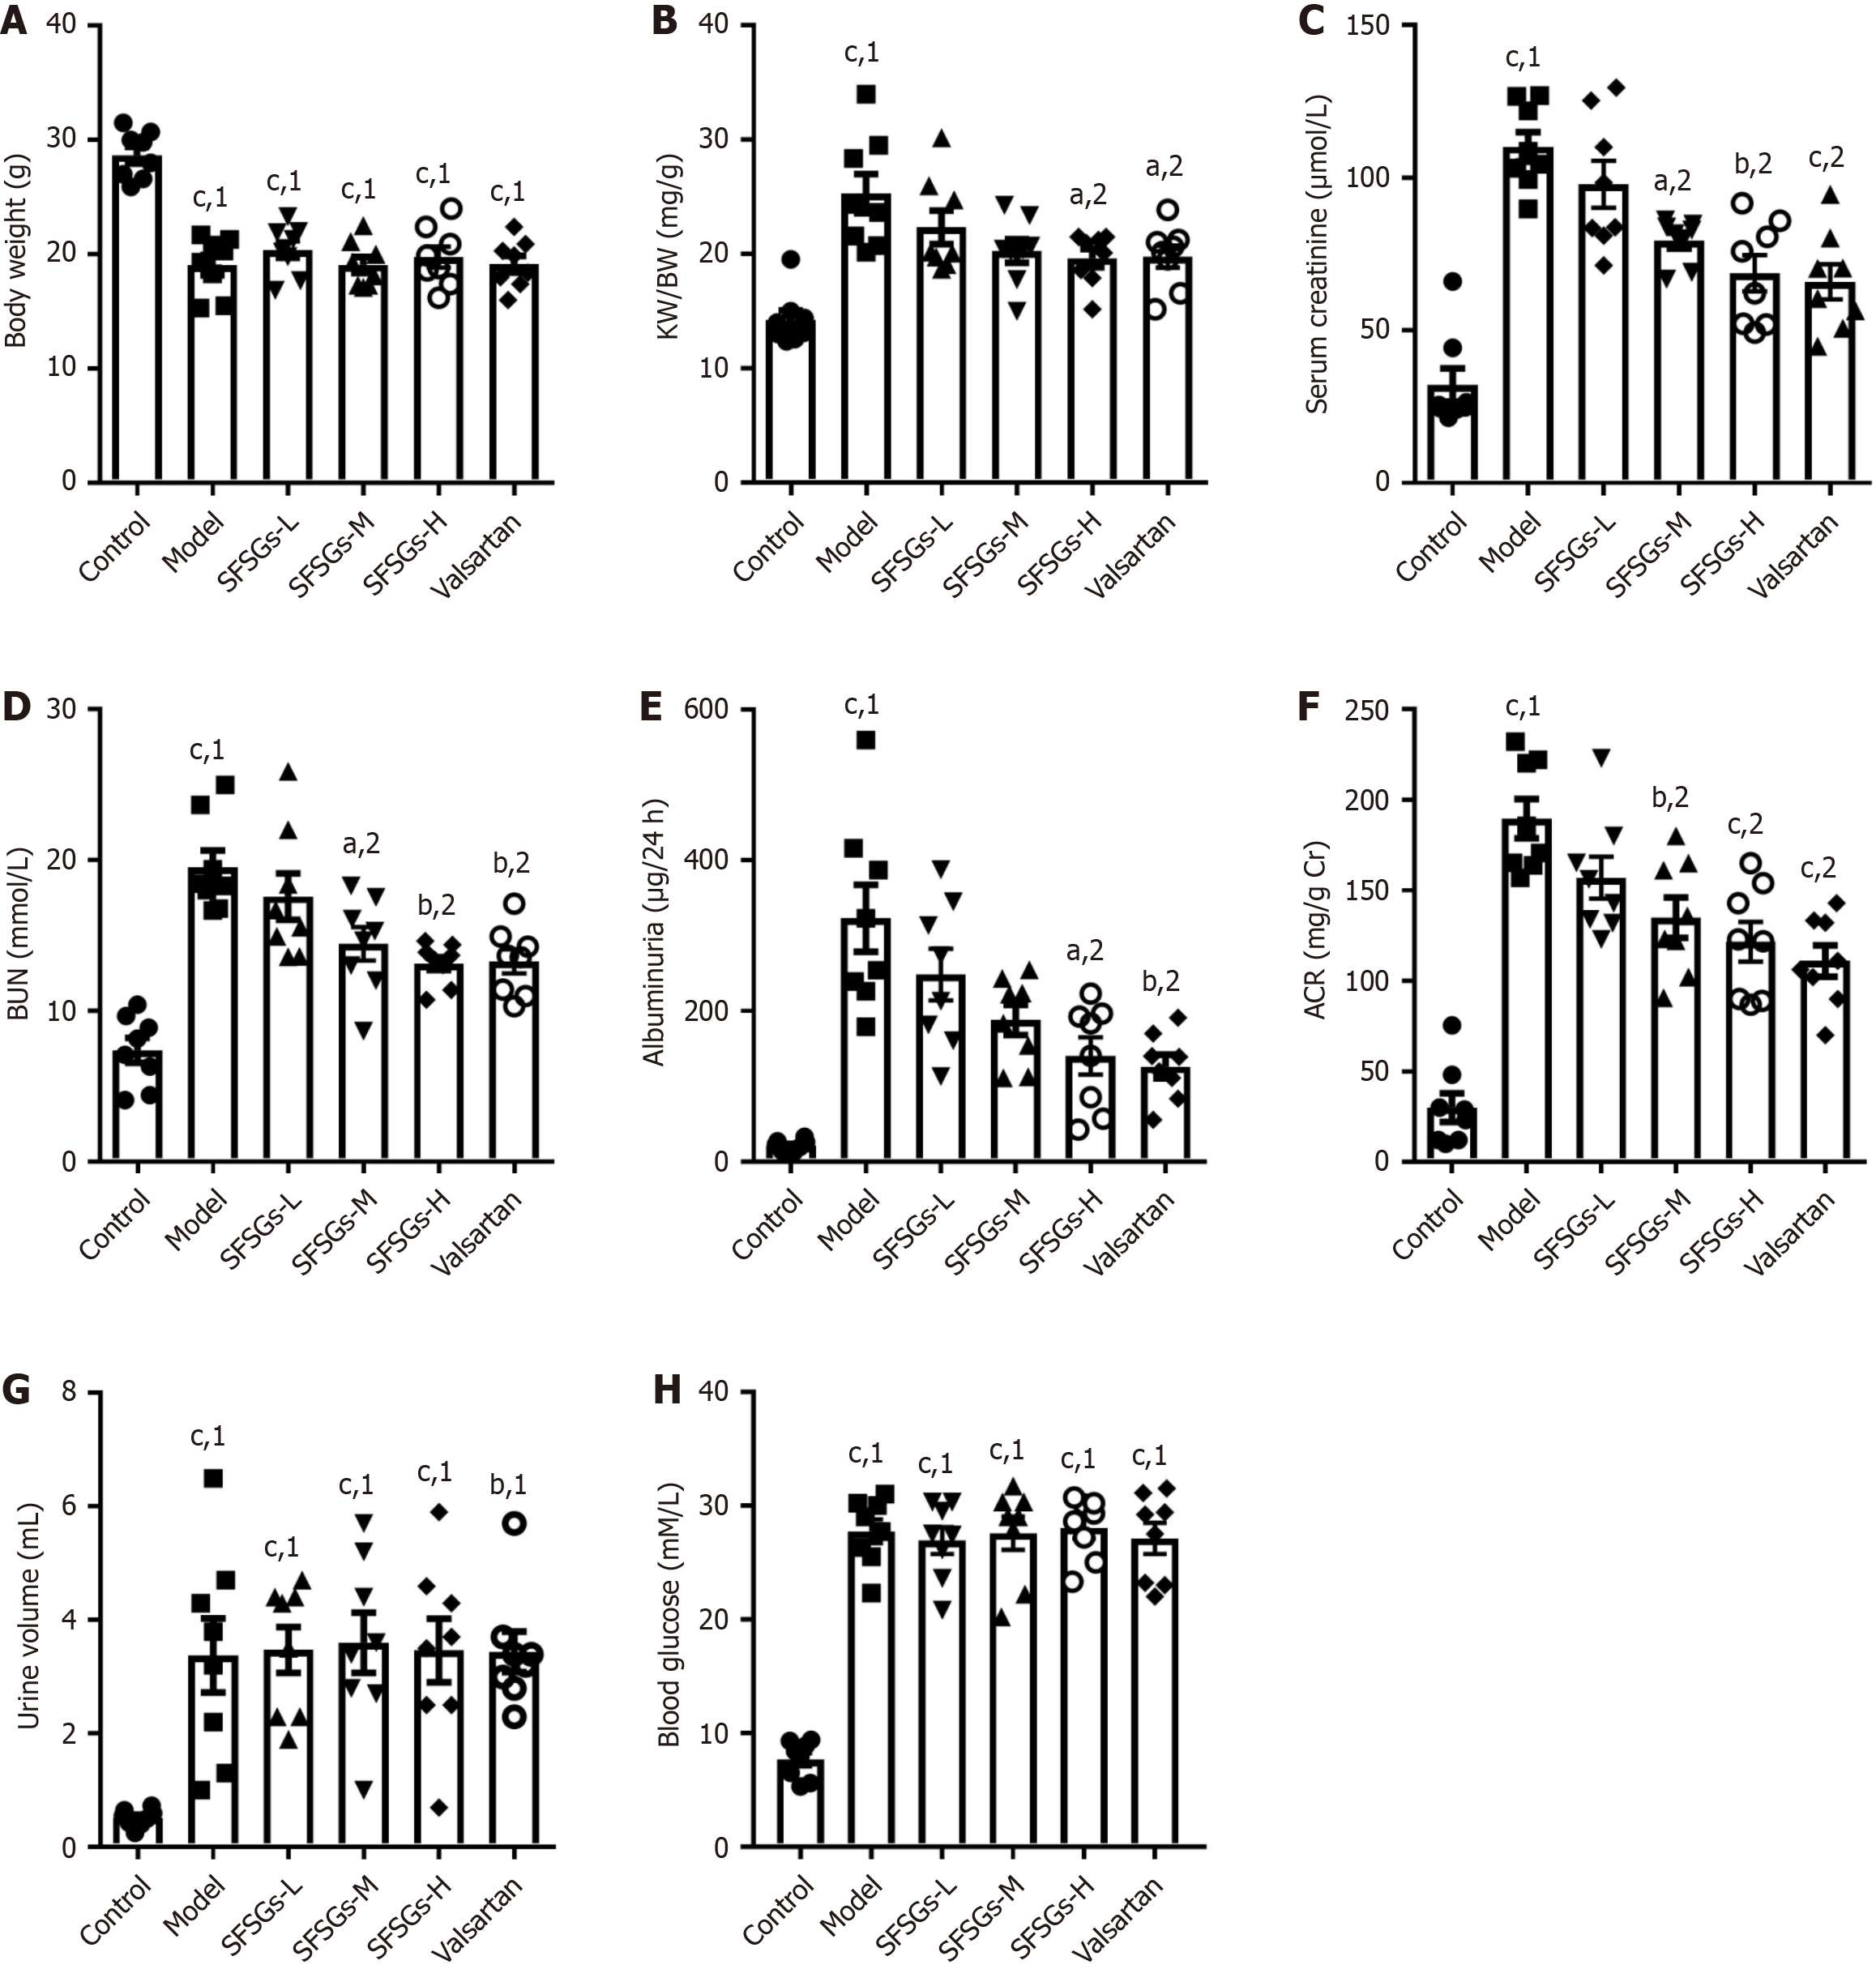
Figure 1 Shenfushu granules delay the progression of diabetic kidney disease.
A: Body weight; B: Kidney weight/body weight; C: Serum creatinine level; D: Blood urea nitrogen level; E: 24-hour albuminuria level; F: Albumin/urine creatinine ratio; G: Urine volume; H: Blood glucose level. The data are presented as the mean ± SE (n = 8). aP < 0.05. bP < 0.01. cP < 0.001. 1P vs control group. 2P vs model group. KW: Kidney weight; BW: Body weight; BUN: Blood urea nitrogen; ACR: Albumin/urine creatinine ratio; SFSGs: Shenfushu granules; L: Low; M: Middle; H: High.
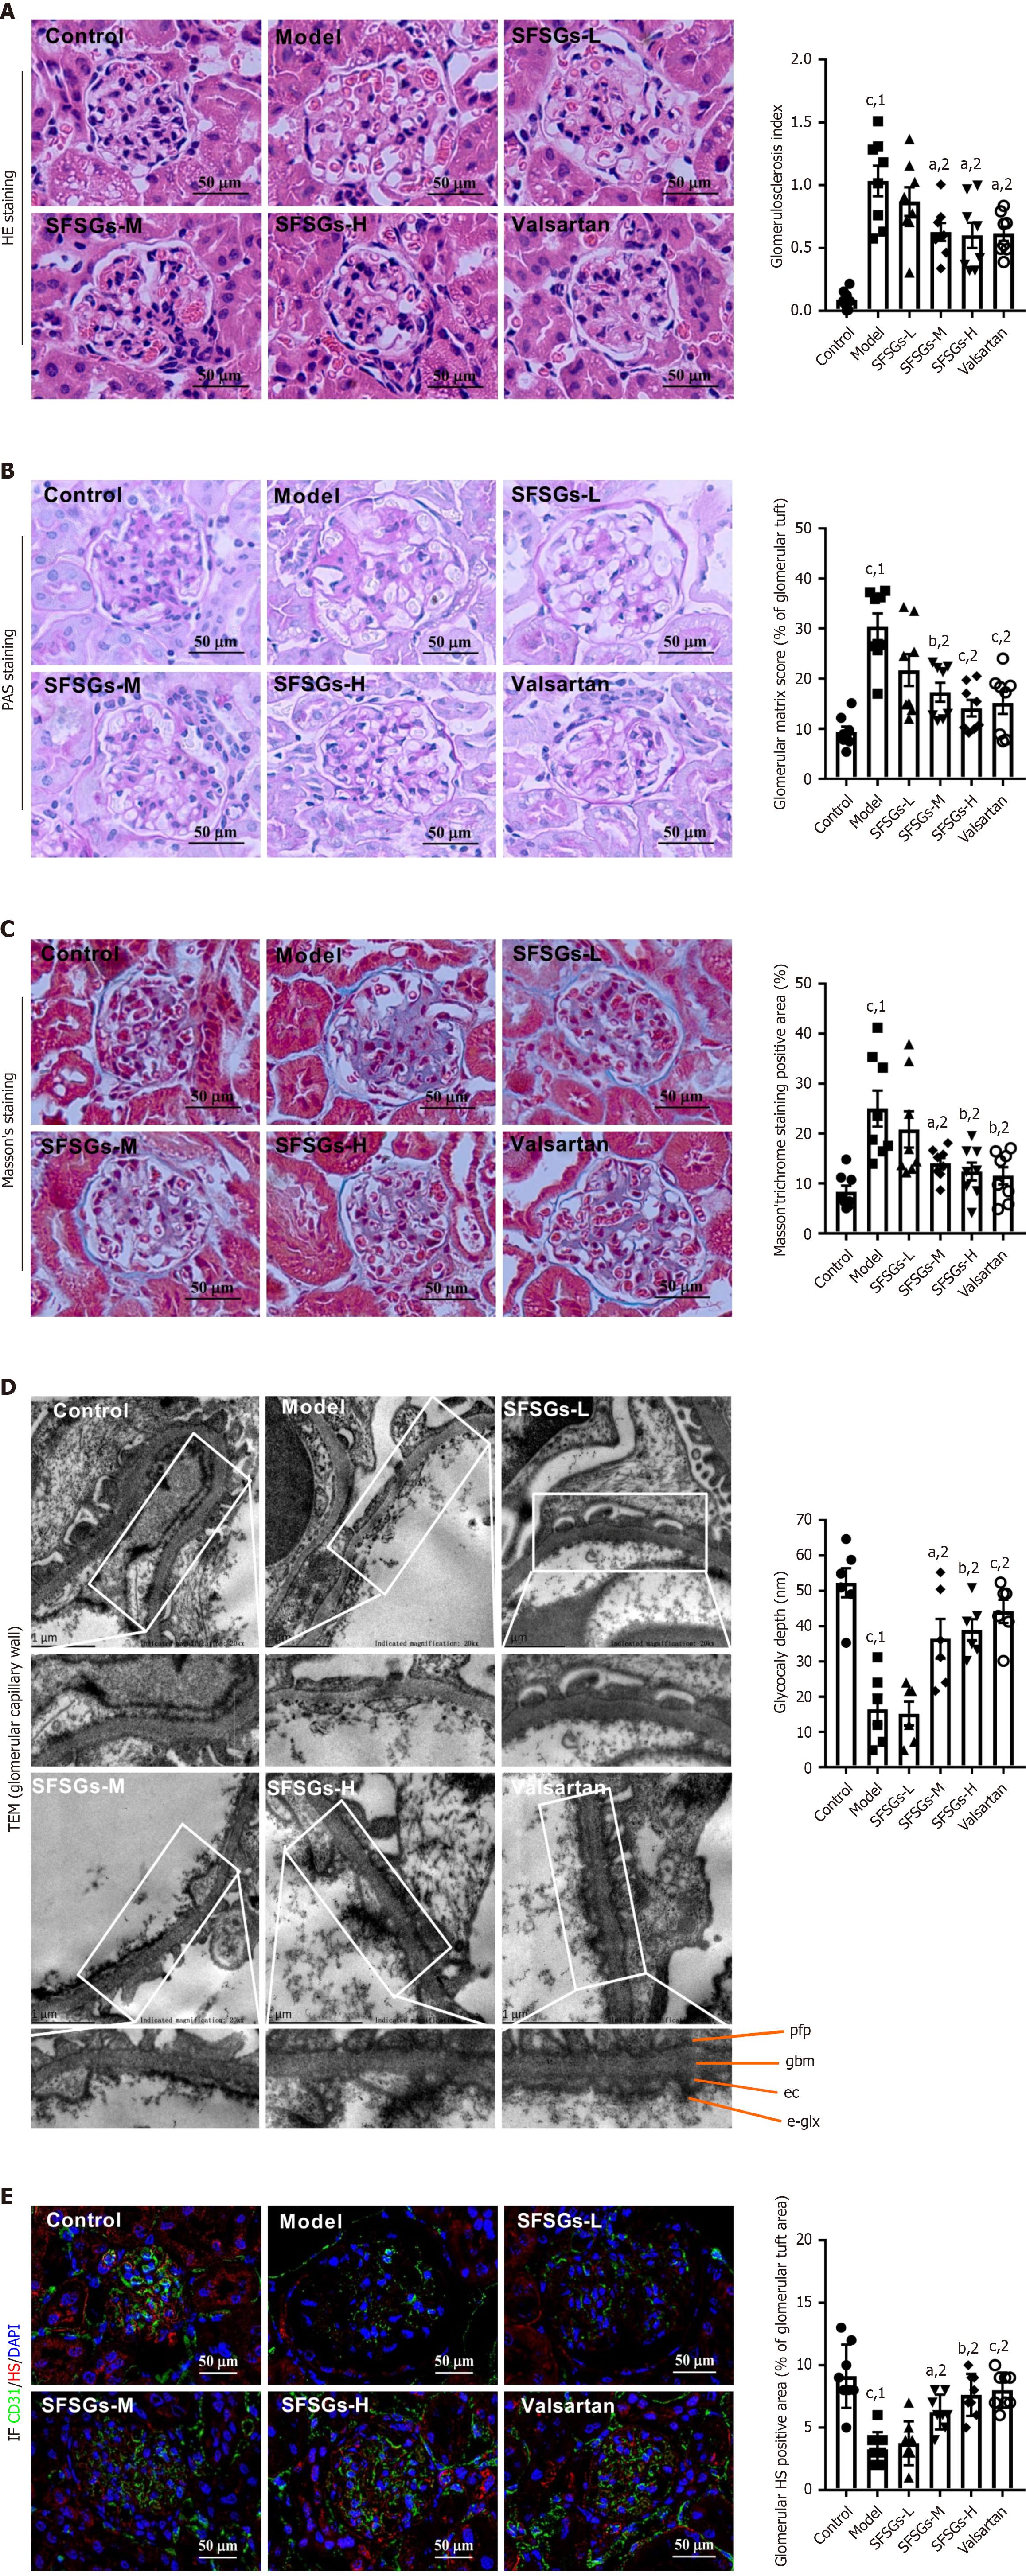
Figure 2 Shenfushu granules alleviates renal injury in diabetic kidney disease.
A: Representative images of hematoxylin and eosin-stained sections (400 × magnification, scale bar: 50 μm); B: Representative images of periodic acid-Schiff staining (400 × magnification, scale bar: 50 μm); C: Representative images of Masson’s trichrome staining (400 × magnification, scale bar: 50 μm); D: Representative transmission electron microscopy images of a glomerular endothelial cell and its glycocalyx; E: Representative images of immunofluorescence for heparan sulfate. The data are presented as the mean ± SE (n ≥ 5). aP < 0.05. bP < 0.01. cP < 0.001. 1P vs control group. 2P vs model group. HE: Hematoxylin and eosin; PAS: Periodic acid-Schiff; TEM: Transmission electron microscope; IF: Immu
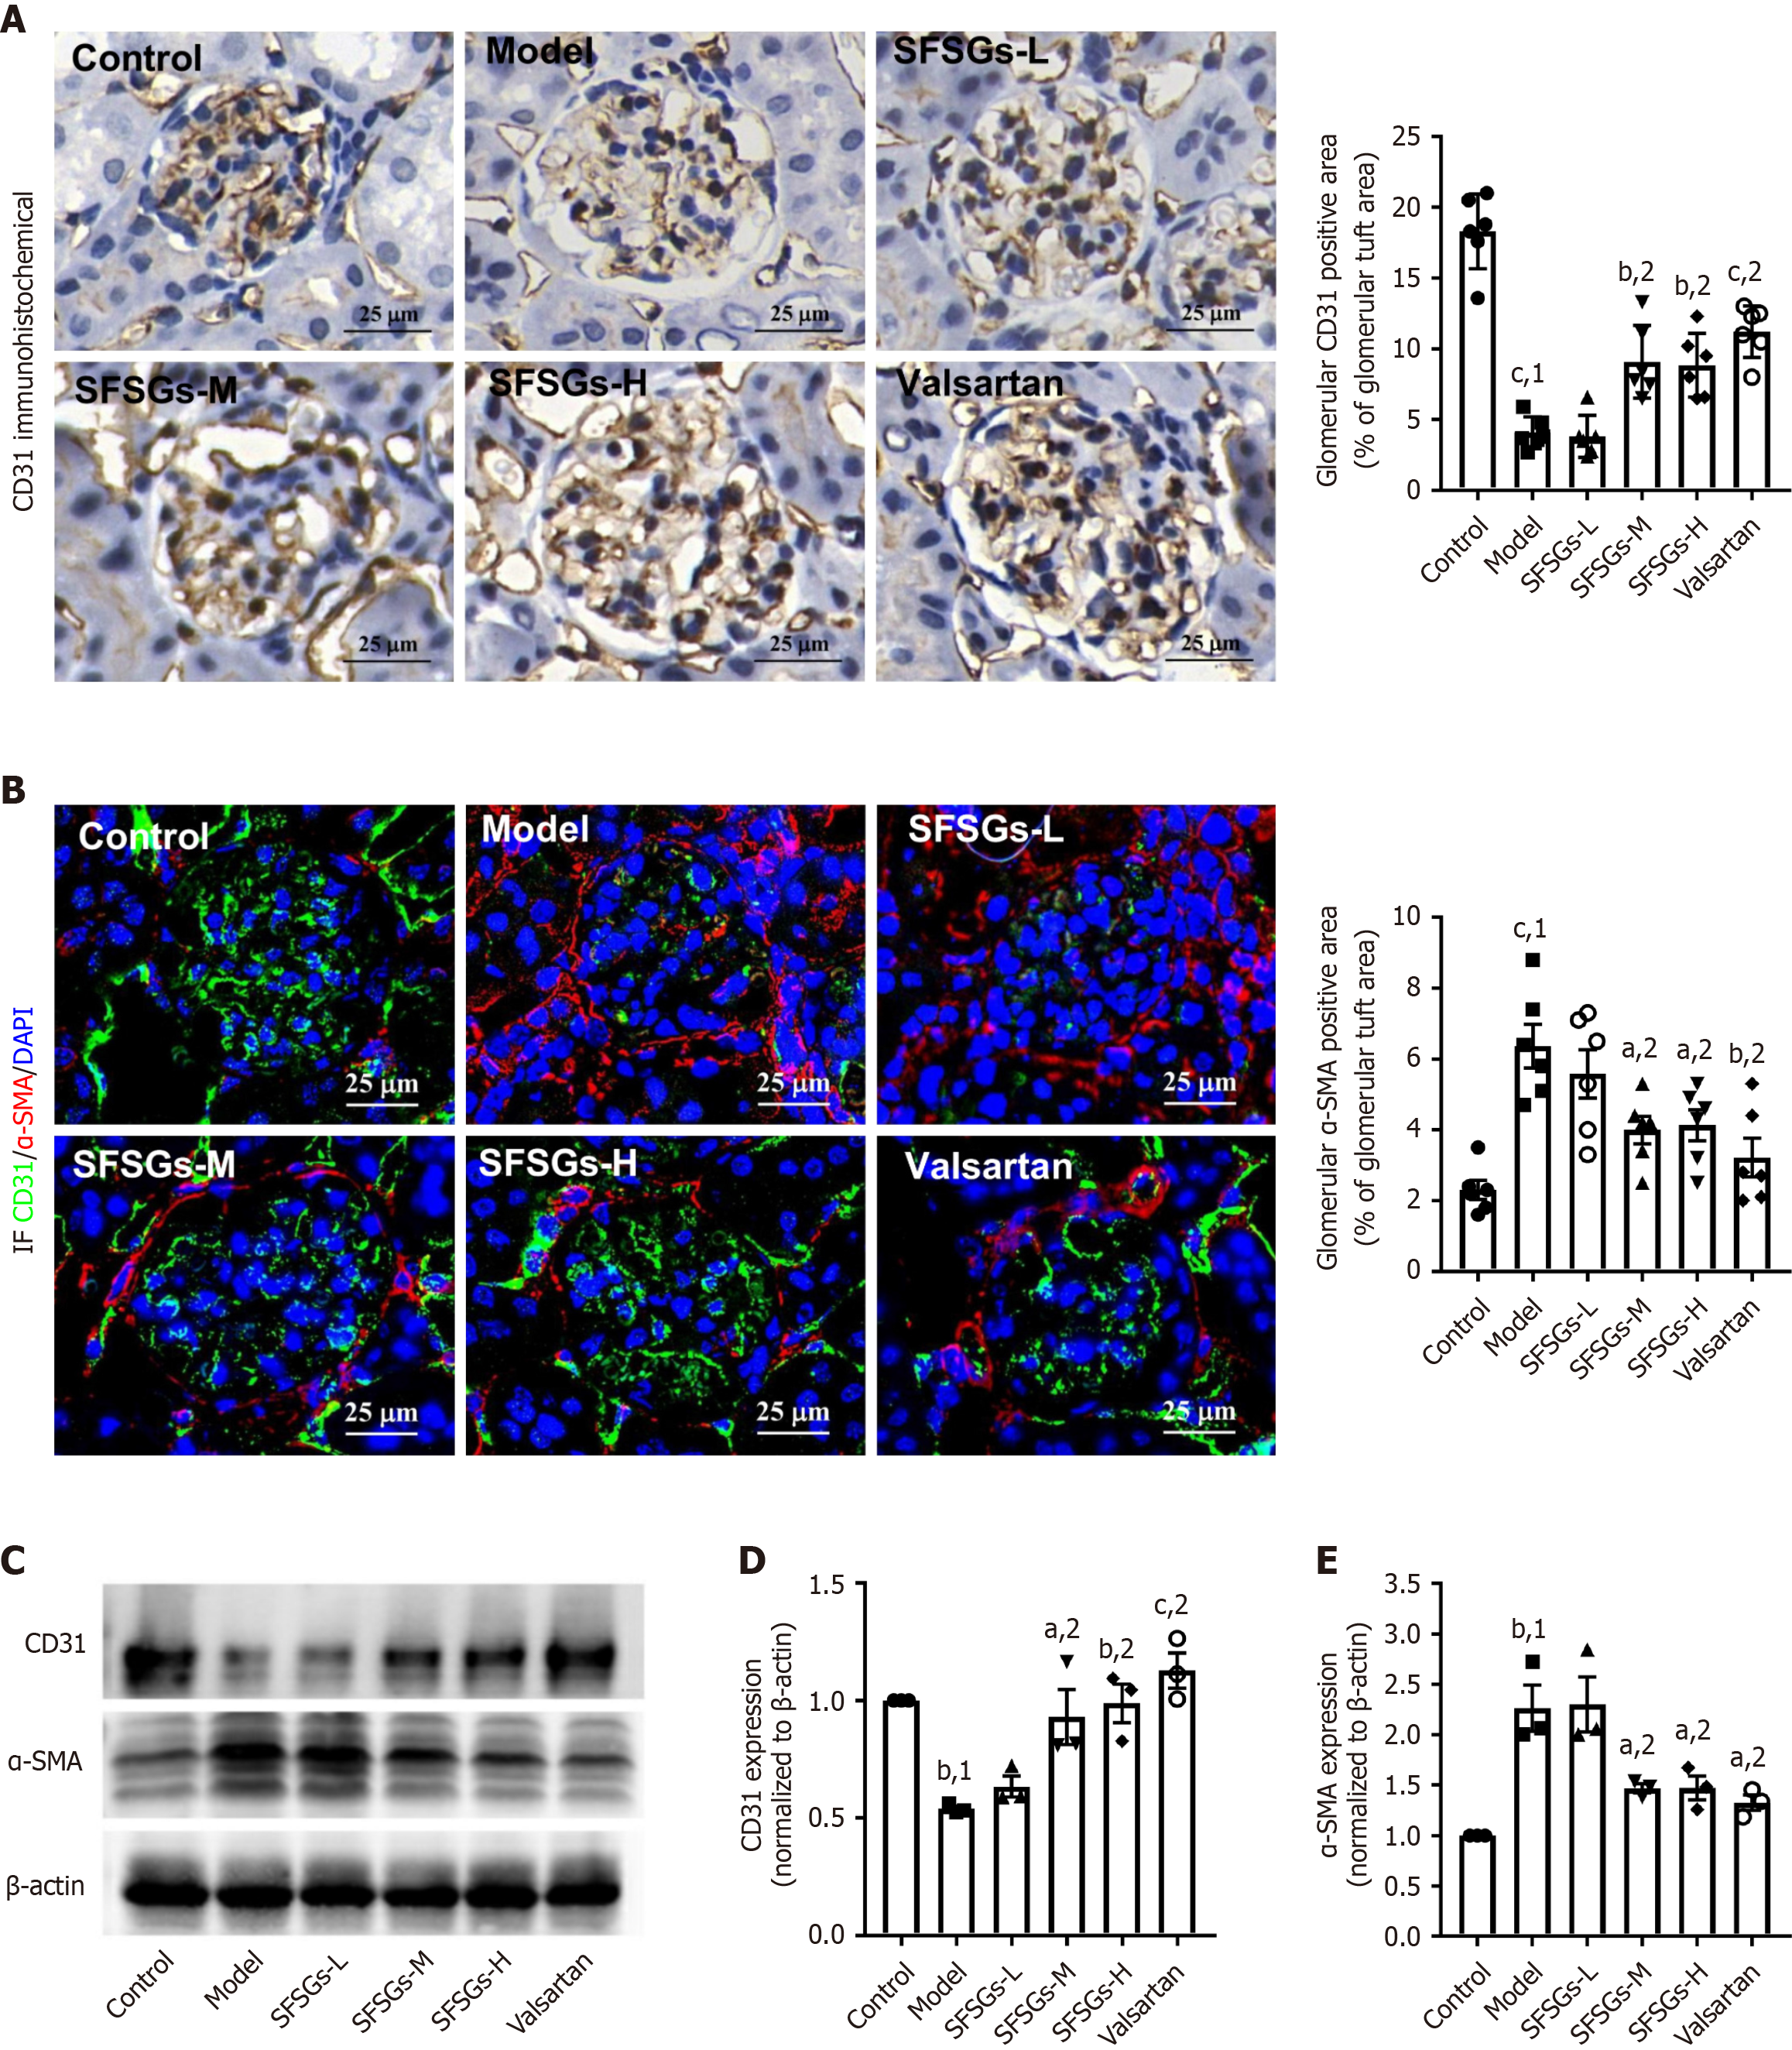
Figure 3 Shenfushu granules inhibits endothelial-mesenchymal transition in glomeruli.
A: Representative images of immunohistochemistry staining for cluster of differentiation (CD) 31 (630 × magnification, scale bar: 25 μm); B: Representative images of immunohistochemistry staining for α-smooth muscle actin (α-SMA) (630 × magnification, scale bar: 25 μm); C: Western blot analysis of CD31 and α-SMA expression. β-actin was used as the loading control; D: Densitometric analyses of CD31; E: Densitometric analyses of α-SMA. The data are presented as the mean ± SE (n ≥ 3). aP < 0.05. bP < 0.01. cP < 0.001. 1P vs control group. 2P vs model group. IF: Immunofluorescence; CD31: Cluster of differentiation 31; α-SMA: α-smooth muscle actin; DAPI: 4’,6-diamidino-2-phenylindole; SFSGs: Shenfushu granules; L: Low; M: Middle; H: High.
Figure 4 Network pharmacology identifies potential targets of Shenfushu granules.
A: Venn diagram of the methods used to identify potential targets of the active ingredients of Shenfushu granules in the treatment of diabetic kidney disease; B: Protein-protein interaction network diagram; C: Core targets; D: Gene Ontology enrichment analysis; E: Kyoto Encyclopedia of Genes and Genomes pathway analysis. SFSGs: Shenfushu granules; DKD: Diabetic kidney disease; MAPK: Mitogen-activated protein kinase; MAP: Mitogen-activated protein; ERK: Extracellular signal-regulated kinase; ATP: Adenosine triphosphate; BP: Biological process; CC: Cellular component; MF: Molecular function; EGFR: Epidermal growth factor receptor; PI3K: Phosphatidylinositol 3-kinase; AKT: Protein kinase B; TNF: Tumor necrosis factor; HIF-1: Hypoxia inducible factor-1.
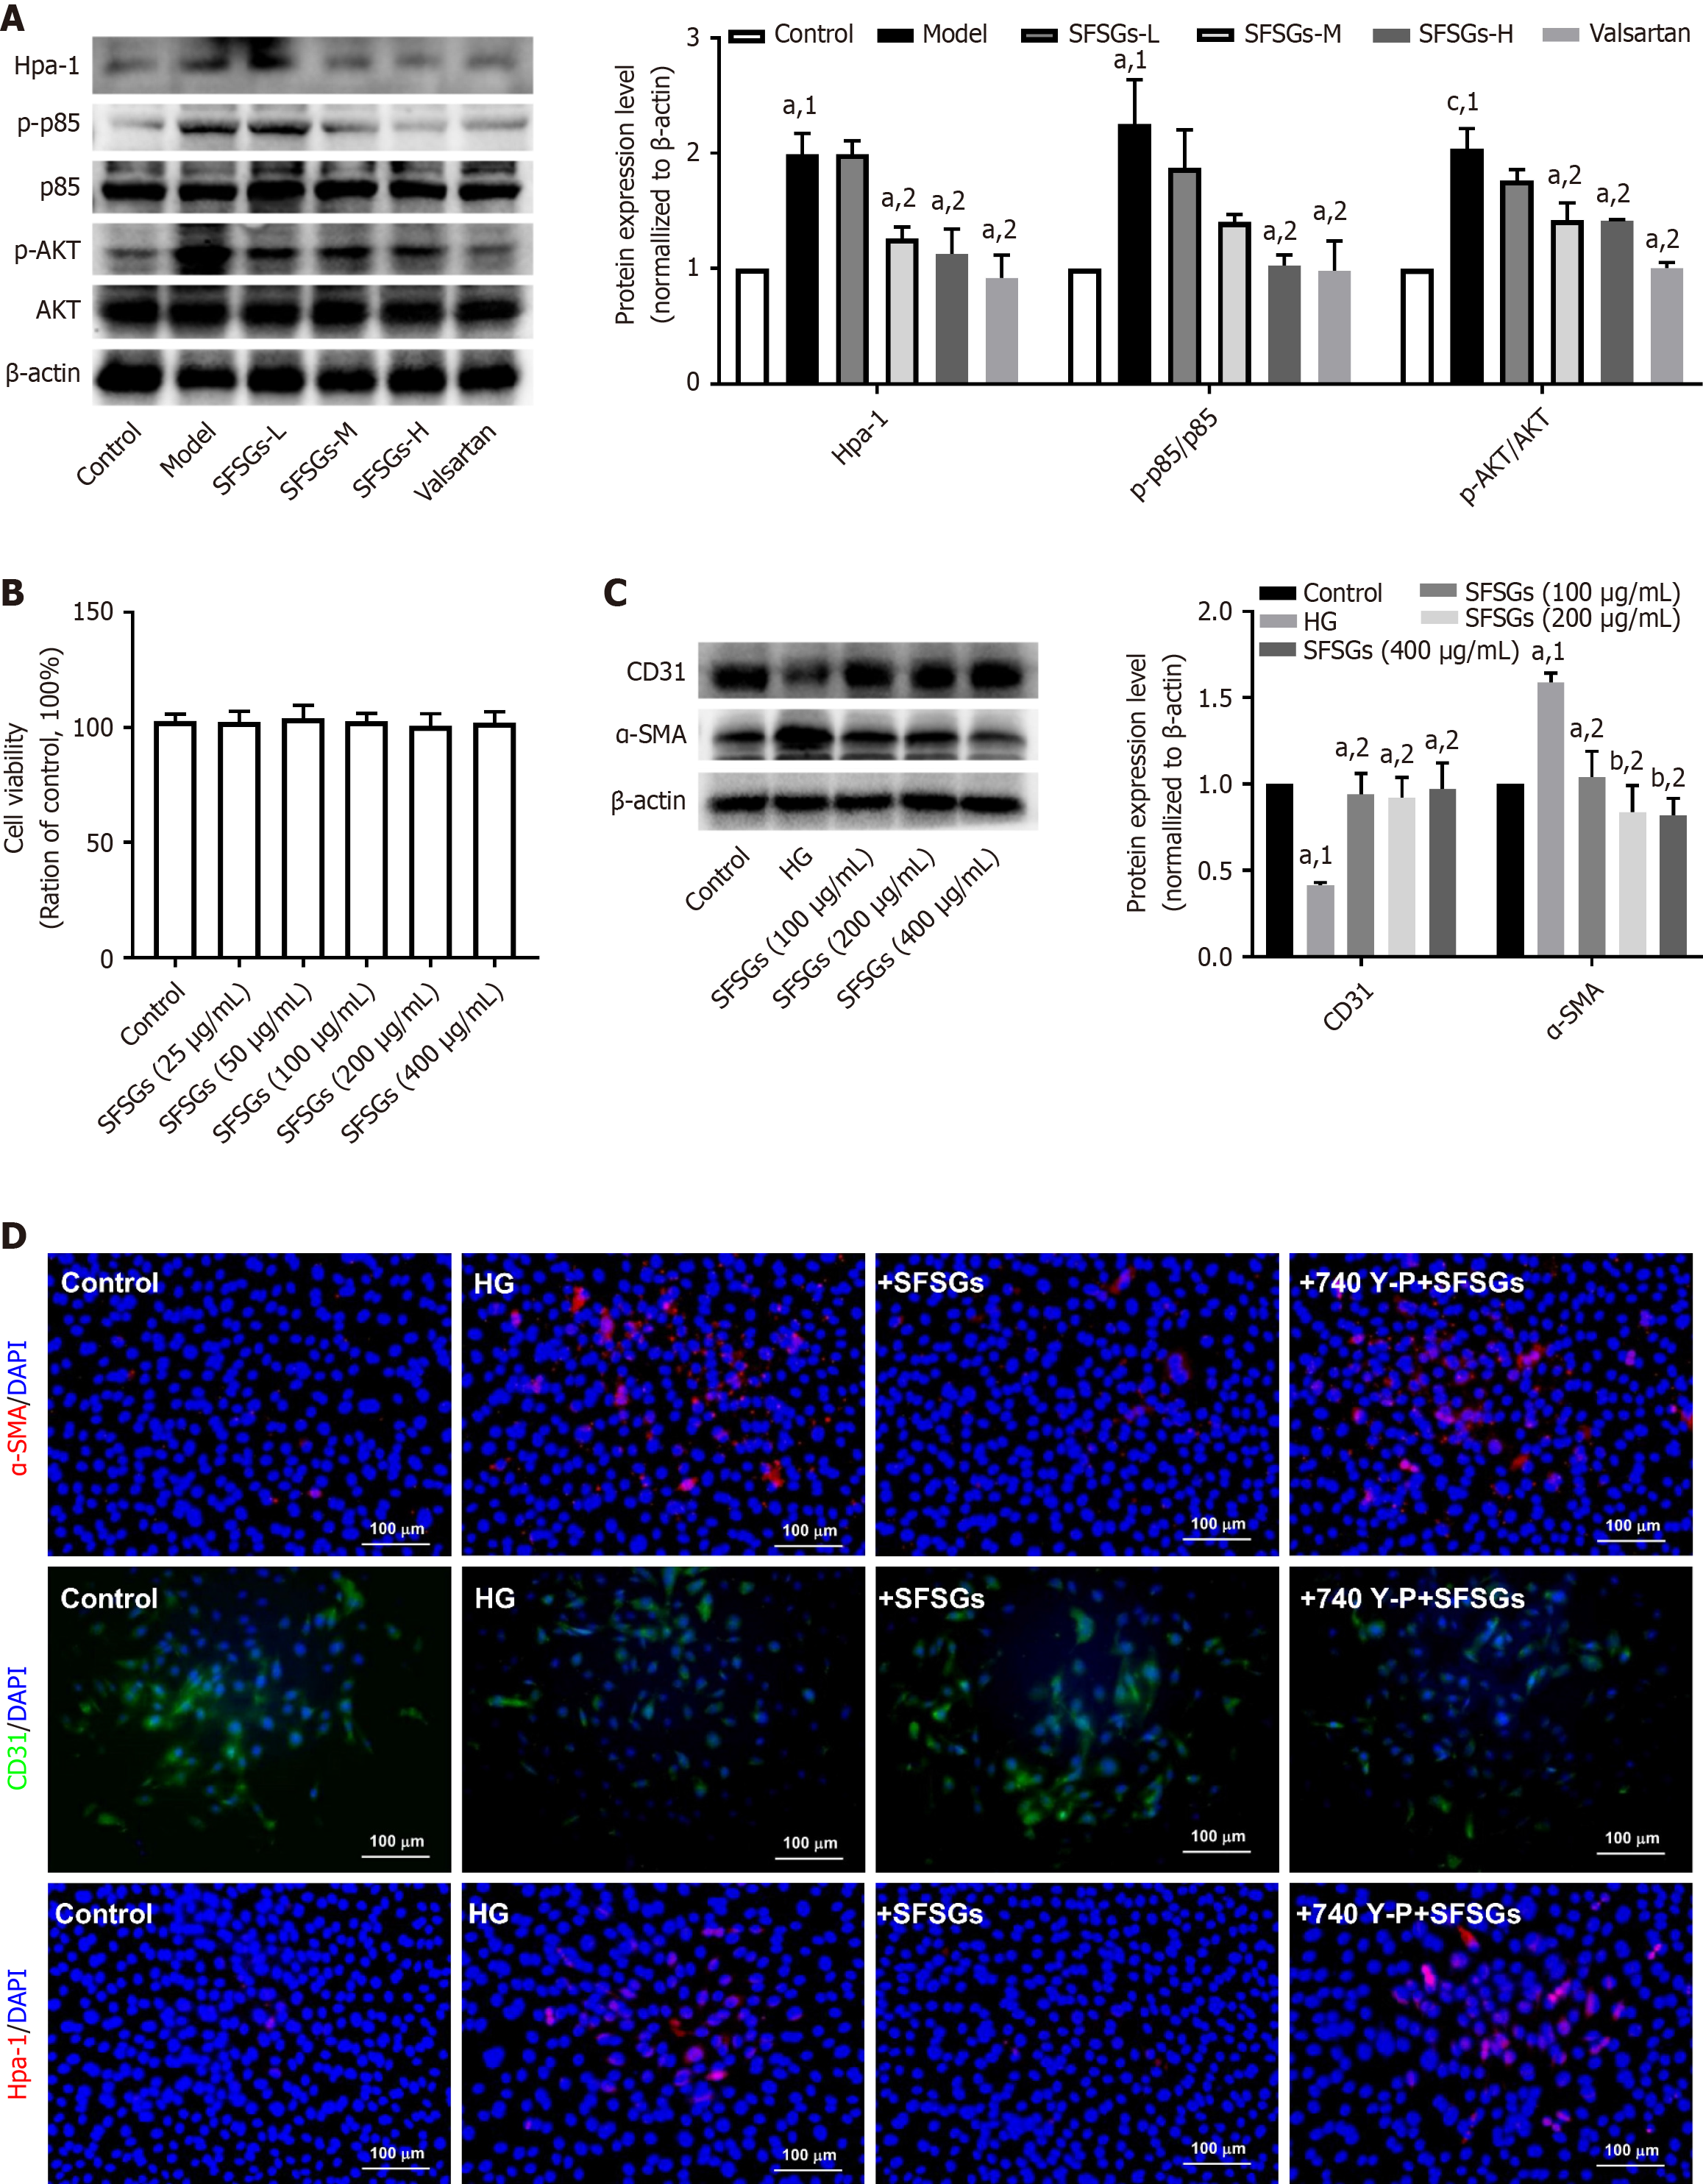
Figure 5 Shenfushu granules inhibit glomerular endothelial-mesenchymal transition via PIK3R1.
A: Western blot analysis of heparanase-1 (Hpa-1), phospho-PIK3R1 (p-p85), PIK3R1 (p85), phospho-protein kinase B (AKT) and AKT. β-actin was used as the loading control; B: Effect of Shenfushu granules (SFSGs) on the viability of human renal glomerular endothelial cells; C: Effects of different concentrations of SFSGs extract on high glucose-induced endothelial-mesenchymal transition. Western blot analysis of cluster of differentiation (CD) 31 and α-smooth muscle actin (α-SMA) expression. β-actin was used as the loading control; D: Representative images of immunofluorescence staining for α-SMA, CD31, and Hpa-1 (200 × magnification, scale bar: 100 μm). The data are presented as the mean ± SE (n ≥ 3). aP < 0.05. bP < 0.01. cP < 0.001. 1P vs control group. 2P vs model group or high glucose group. Hpa-1: Heparanase-1; p-AKT: Phospho-protein kinase B; AKT: Protein kinase B; CD31: Cluster of differentiation 31; EndMT: Endothelial-mesenchymal transition; IF: Immunofluorescence; α-SMA: α-smooth muscle actin; HG: High glucose; DAPI: 4’,6-diamidino-2-phenylindole; SFSGs: Shenfushu granules; L: Low; M: Middle; H: High.
Figure 6 Interaction analysis between core components and core targets.
A: Drug-component-disease-target network diagram; B: Molecular docking scores; C: Molecular docking visualization analysis; D: Root mean square deviation; E: Root mean square fluctuation; F: Number of hydrogen bonds. DKD: Diabetic kidney disease; DH: Rheum tanguticum Maxim ex Balf; TFL: Smilax glabra Roxb; GC: Glycyrrhiza uralensis Fisch; DS: Salvia miltiorrhiza Bunge; ZQ: Citrus × aurantium; ML: Ostrea rivularis Gould; RMSD: Root mean square deviation; RMSF: Root mean square fluctuation.
- Citation: Yang XD, Ma SJ, Xiang DX, Yang YY. Shenfushu granules attenuate diabetic kidney disease by inhibiting PIK3R1/protein kinase B/heparanase-mediated endothelial-mesenchymal transition. World J Diabetes 2025; 16(5): 102196
- URL: https://www.wjgnet.com/1948-9358/full/v16/i5/102196.htm
- DOI: https://dx.doi.org/10.4239/wjd.v16.i5.102196


